X-ray Study of Triggered Star Formation and Protostars in IC 1396N
Abstract
The IC 1396N cometary globule (CG) within the large nearby HII region IC 1396 has been observed with the ACIS detector on board the X-ray Observatory. We detect 117 X-ray sources, of which are likely members of the young open cluster Trumpler 37 dispersed throughout the HII region, and 25 are associated with young stars formed within the globule. Infrared photometry (2MASS and ) shows the X-ray population is very young: 3 older Class III stars, 16 classical T Tauri stars, 6 protostars including a Class 0/I system. We infer a total T Tauri population of stars in the globule, including the undetected population, with a star formation efficiency of .
An elongated source spatial distribution with an age gradient oriented towards the exciting star is discovered in the X-ray population of IC 1396N, supporting similar findings in other cometary globules. The geometric and age distribution is consistent with the radiation driven implosion (RDI) model for triggered star formation in CGs by HII region shocks. The inferred velocity of the shock front propagating into the globule is km/s. The large number of X-ray-luminous protostars in the globule suggests either an unusually high ratio of Class I/0 vs. Class II/III stars, or a non-standard IMF favoring higher mass stars by the triggering process.
The source associated with the luminous Class 0/I protostar IRAS 21391+5802 is one of the youngest stars ever detected in the X-ray band. We also establish for the first time that the X-ray absorption in protostars arises from the local infalling envelopes rather than ambient molecular cloud material.
1 Introduction
It has long been recognized that star formation in molecular clouds can be triggered by ionization or shock fronts produced by nearby massive stars (Elmegreen & Lada, 1977; Habing & Israel, 1979; Elmegreen, 2002). This leads to triggered star formation at the interface between HII regions and molecular clouds and, on large scales, to the sequential formation of star clusters in molecular cloud complexes. Two mechanisms for triggered star formation have been discussed: the radiation driven implosion (RDI) model and the ‘collect-and-collapse’ model (see review by Elmegreen, 1998). In the RDI model, photoevaporation of the cloud outer layers induces a shock that compresses the cloud interior leading to gravitational collapse (Reipurth, 1983; Sugitani et al., 1989; Lefloch & Lazareff, 1994; Gorti & Hollenbach, 2002). In the ‘collect-and-collapse’ model, the HII region compresses the cloud, triggering the formation of self-gravitating cores on timescales of yr (see review by Henney, 2006). Modern models indicate that the time-dependent relationships between dissociation, ionization, and shock fronts can be complex: gravitational collapse can form stars in a thin dense layer between the shock and ionization fronts propagating through the cloud (Hosokawa & Inutsuka, 2005, 2006; Zavagno et al., 2006).
Triggered star formation has been reported on the edges of large HII regions in the Carina Nebula (Smith et al., 2000), Orion clouds (Stanke et al., 2002; Lee et al., 2005), M 16 (Fukuda et al., 2002), M 17 (Jiang et al., 2002), 30 Doradus (Walborn et al., 2002), NGC 3603 (Moffat et al., 2002), RCW 49 (Whitney et al., 2004), W 5 (Karr & Martin, 2003), the Gum Nebula (Kim et al., 2005), and samples of more distant HII regions (Deharveng et al., 2005). Most of these are large star-forming complexes where the geometry and conditions are difficult to ascertain.
Bright-rimmed cometary globules (CGs) are simpler structures where triggering processes may be active and thus offer an opportunity for understanding better the mechanisms at work. These are small, isolated clouds with dense cores surrounded by ionized rims facing the exciting star and tails extending in the opposite direction (e.g. Loren & Wootten, 1978; Sugitani et al., 1991). CGs likely originate as dense clumps in the parental molecular clouds that have emerged after the dispersion of lower density gas by ultraviolet radiation from OB stars.
The large nearby HII region IC 1396 has a rich population of bright-rimmed and cometary globules seen in silhouette against the emission nebula (Figure 1). Over a dozen contain IRAS sources and are likely sites of star formation (Schwartz et al., 1991). Roughly 3∘ in diameter, IC 1396 is excited by the O6.5f star HD 206267 in the Trumpler 37 cluster, which lies at the center of the Cepheus OB2 Association (Simonson, 1968; Walborn & Panek, 1984).
We study here globule IC 1396N (labeled E in Figure 2 of Weikard et al., 1996) located pc projected distance north of HD 206267 with the bright rim tracing the ionization front facing HD 206267 (Figure 1). Signs of ongoing star formation in the globule include the luminous far-infrared source IRAS 21391+5802, H2O maser sources, molecular outflows, HH flows, and clusters of near-infrared (NIR) embedded sources and radio-mm protostars (Sugitani et al., 1989; Schwartz et al., 1991; Tofani et al., 1995; Slysh et al., 1999; Codella et al., 2001; Nisini et al., 2001; Beltrán et al., 2002; Reipurth et al., 2003). Mass estimates for the globule range from 300 to 500 M⊙ and the absorption through its core is mag (Wilking et al., 1993; Serabyn et al., 1993; Nisini et al., 2001; Froebrich et al., 2005). We adopt a distance of 750 pc (Matthews, 1979) for compatibility with most recent studies, though we note that the parallactic distance measurement is pc (de Zeeuw et al., 1999).
Our study is unusual in that we use an X-ray telescope to find the young stellar population around IC 1396N. X-ray surveys are complementary to optical and infrared surveys because they trace magnetic activity (mainly plasma heated in violent magnetic reconnection flares) rather than photospheric or circumstellar disk blackbody emission of low-mass pre-main sequence (PMS) stars (see reviews by Feigelson & Montmerle, 1999; Feigelson et al., 2006, and references therein). In regions like IC 1396, NIR surveys are overwhelmed by unrelated field stars; many old background stars may penetrate through the cloud and mimic young embedded objects (§3.4). Foreground and background Galactic stars have much less impact on X-ray studies, as magnetic activity in PMS stars is elevated above main-sequence levels (Preibisch & Feigelson, 2005). The main X-ray contaminants are extragalactic objects, which are uncommon and can be identified with some reliability (Getman et al., 2005b, 2006). X-ray surveys penetrate deeply into obscuring material ( mag) and thus are effective in detecting embedded objects (Getman et al., 2005b; Grosso et al., 2005). X-ray observations also are not hampered by two problems that affect NIR and optical studies of young stellar populations in HII regions: they are not biased towards stars with protoplanetary disks, and are not subject to confusion from bright diffuse emission by heated gas and dust. The Chandra X-ray Observatory, with its excellent high-resolution mirrors, is often effective in resolving crowded fields down to ″ scales (Getman et al., 2005b). The central region of IC 1396 was previously studied with the lower resolution observatory (Schulz et al., 1997) but the northern part of the nebula with the IC 1396N globule was off the field.
The observation of IC 1396N and source list are described in §2. Over 100 X-ray sources are detected, from which we identify a cluster of 25 young objects associated with the globule (§3). Based on location, absorption, and infrared photometry, we distinguish embedded protostellar and more evolved T Tauri sub-populations (§3.3). We compare the X-ray cluster to the NIR observations of Nisini et al. (2001) in §3.4 and study X-ray properties of the cluster in §4. A particularly important intermediate-mass Class 0/I protostar is presented in §5. We end with discussion of how the rich cluster of protostars in IC 1396N fits within the larger picture of X-ray detections from protostars in other star forming regions, and with discussion of the implications for understanding triggered star formation in CGs (§6).
2 The Chandra Observation and Source List
2.1 Observation and Data Reduction
The X-ray observation of the globule IC 1396N and its vicinity was obtained on October 2004 with the ACIS camera (Garmire et al., 2003) on-board Chandra (Weisskopf et al., 2002). We consider here only results arising from the imaging array (ACIS-I) of four abutted pixel front-side illuminated charge-coupled devices (CCDs) covering about on the sky. The S2 and S3 detectors in the spectroscopic array (ACIS-S) were also operational, but as the telescope point spread function (PSF) is considerably degraded far off-axis, the S2-S3 data are omitted from the analysis. The aim point of the array was , (J2000) or , and the satellite roll angle (i.e., orientation of the CCD array relative to the north-south direction) was . The total net exposure time of our observation is 30 ks with no background flaring due to solar activity or data losses.
Data reduction follows procedures similar to those described in detail by Townsley et al. (2003, Appendix B) and Getman et al. (2005a). Briefly, the data are partially corrected for CCD charge transfer inefficiency (Townsley et al., 2002), cleaned with “grade” (only ASCA grades 0, 2, 3, 4, and 6 are accepted), “status”, and “good-time interval” filters, trimmed of background events outside of the keV band and, cleaned of bad pixel columns with energies of keV left by the standard processing. The slight PSF broadening from the X-ray Center’s (CXC’s) software randomization of positions is removed. Based on several dozen matches between bright and 2MASS point sources, we correct the absolute astrometry to the Hipparcos reference frame. These and later procedures were performed with software package 3.2, 3.0.0, 5.3, CTI corrector version 1.44, and the ACIS Extract package version 3.94. The latter two tools were developed at Penn State111Descriptions and codes for CTI correction and ACIS Extract can be found at http://www.astro.psu.edu/users/townsley/cti/ and http://www.astro.psu.edu/xray/docs/TARA/ae_users_guide.html, respectively..
2.2 X-ray Point Source Catalog
Figure 1 shows the resulting image of the ACIS-I field after adaptive smoothing with the CIAO tool . More than 100 point sources are easily discerned. Source searching was performed with data images and exposure maps constructed at three spatial resolutions (0.5, 1.0, and per pixel) using the wavdetect tool. We run wavdetect with a low threshold which is highly sensitive but permits false detections at this point in the analysis. This is followed by visual examination to locate other candidate sources, mainly close doubles and sources near the detection threshold. Using ACIS Extract, photons are extracted within polygonal contours of encircled energy using detailed position-dependent models of the PSF. Background is measured locally in source-free regions. Due to a very low, spatially invariant, ACIS-I background in the current observation of IC 1396 there is a one-to-one correspondence between a source’s significance and net counts (black circles in Figure 2). For example, this is not the case for a much more complicated COUP observation (Getman et al., 2005a), where the local source background is often highly elevated due to crowded fields, readout trails, and PSF wings from bright sources (grey circles in Figure 2). The source significance, calculated by ACIS Extract, is the ratio of the source’s net (background-subtracted) counts to the uncertainty on that quantity222The uncertainty on the net counts is estimated by calculating errors (Gehrels, 1986, eqs. 7 and 12) on total observed and background counts and then propagating (Lyons, 1991, eq. 1.31) those errors to net counts. More detailed information on the algorithm for calculating source significance can be found in the section “Algorithms”, subsection “Broad Band Photometry”, of the Users Guide for ACIS Extract at http://www.astro.psu.edu/xray/docs/TARA/ae_users_guide.html.: . Similar to the procedure of Getman et al. (2006), the list of candidate sources is trimmed to omit sources with fewer than estimated source background-subtracted counts, . In this case the above criterion is equivalent to accepting sources with a source significance of (see Figure 2). The resulting catalog of 117 sources is listed in Table 1.
The ACIS Extract package estimates (often using tools) a variety of source characteristics including celestial position, off-axis angle, net and background counts within the PSF-based extraction area, source significance assuming Poisson statistics, effective exposure (corrected for telescope vignetting and satellite dithering), median energy after background subtraction333The derivation of median energy of background-subtracted events is given in Townsley et al. (2006, §3.1)., a variability indicator extracted from the one-sided Kolmogorov-Smirnov statistics, and occasional anomalies related to chip gap or field edge positions. These are all reported in Table 1; see Getman et al. (2005a) for a full description of these quantities.
There are nine very weak sources with counts with low statistical significance. Three of these (#68, 72, and 82) will be discussed in §3 as likely members of young stellar cluster in IC 1396N globule. Four of these weakest sources (#42, 57, 69, and 79) have very hard spectra with median energy of keV and without counterparts; these are good candidates for extragalactic contaminants. The remaining two weak sources (# 34 and 88) have rather soft photon energies with counterparts; these are candidate members of the older cluster Trumpler 37 that extends into the ACIS field of view. We thus believe most of these faintest sources are real despite their marginal statistical significance.
2.3 Stellar and Nonstellar Sources
Out of 117 X-ray sources, 66 are identified with 2MASS NIR counterparts (last column in Table 1). Median separations agree well with that derived from the COUP project (Getman et al., 2005a): they are better than at the central part of the ACIS-I field, and at larger off-axis angles. Twenty nine of the 51 sources without NIR detections have hard spectra with median energy keV. Of these, five are probably newly discovered protostars in the globule (§3). The remaining 24 are candidates for extragalactic contaminants (consistent with the extragalactic prediction described below).
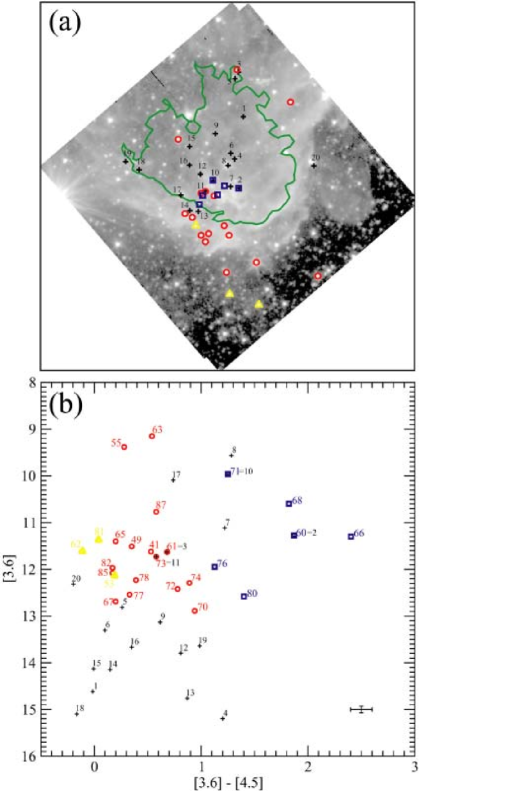
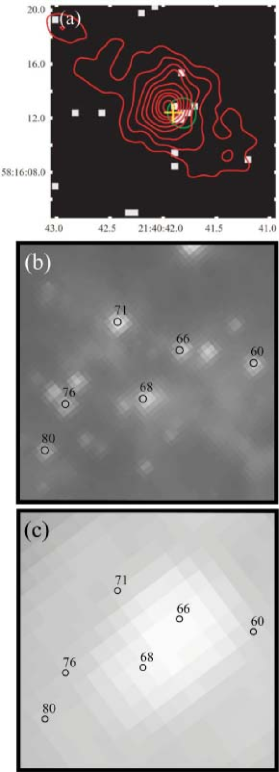
Figure 3 shows the spatial distribution of the 117 X-ray sources on the ACIS-I field. There is a clear spatial concentration of 25 X-ray sources (marked as yellow, red, and blue) associated with the IC 1396N globule, which we discuss below. But some of the 117 X-ray sources will be unrelated to the IC 1396 star forming region. To quantify this problem, we use results from detailed simulations of Galactic field and extragalactic background contamination populations performed by Getman et al. (2006) for the observation of the Cepheus B region, which had similar exposure time. The IC 1396 and Cepheus B star forming regions have similar Galactic directions ( and respectively) with approximately the same distance from the Sun. We thus expect to have similar numbers of contaminating sources: Galactic foreground stars, Galactic background stars, and extragalactic objects (considering all four CCD chips), all uniformly distributed across the ACIS-I field. In total, we estimate that % of the 117 sources are unrelated to IC 1396 corresponding to a uniform density of one contaminating source in every square arcminutes.
3 X-ray Stellar Cluster in the Globule
3.1 The X-ray sample
We concentrate this study on sources which likely arise from star formation in the globule, identified by their spatial clustering within the globule and within the region around the bright rim which traces the ionization front. About of the remaining X-ray sources are probably members of the young open star cluster Trumpler 37, part of the younger ( Myr) subgroup of the Cep OB2 association (Simonson, 1968) surrounding the globule (see Figure 1). They join the list of previously unknown X-ray emitting low-mass PMS stars in the region discovered with the satellite (Schulz et al., 1997).
Figure 3 highlights the region around the IC 1396N globule showing 30 X-ray sources on a 3.6 m image produced with the IRAC instrument on board the Spitzer Space Telescope. This region covers about 30.2 square arcminutes so that, from the estimate in §2.3, we expect that a few of these 30 X-ray sources will be unrelated to the cloud. Five sources (# 46, 47, 50, 58, and 86) have properties consistent with extragalactic contaminants (Getman et al., 2005b): hard X-ray spectra with keV, location around (rather than within) the globule, and no 2MASS or counterparts. We thus omit these sources and consider the remaining 25 as likely stellar members of the globule.
3.2 Infrared Photometry
The image in Figure 3 was one of several retrieved from the archive data of IC 1396N after basic calibration was applied. MIR images of IC 1396N were obtained in the 3.6, 4.5, 5.8, 8.0, 24 and 70 m bands as part of the observing program “Star Formation in Bright Rimmed Clouds” (Giovanni Fazio, PI). The Spitzer Space Observatory, Infrared Array Camera (IRAC), and Multiband Imaging Photometer for Spitzer (MIPS) detectors are described by Werner et al. (2004), Fazio et al. (2004), and Rieke et al. (2004), respectively.
We extracted MIR photometry from the Spitzer data using two different packages: the apex.pl point source extraction script (version 3.7) from the Spitzer MOPEX package; and the aper.pro aperture photometry routine from the IDLPHOT package444Descriptions and codes for MOPEX and IDLPHOT packages can be found at http://ssc.spitzer.caltech.edu/postbcd/download-mopex.html and http://idlastro.gsfc.nasa.gov/ftp/pro/idlphot/README, respectively.. In the first approach, source profile fitting is performed using Point Response Functions (PRFs) which refines source positions and automatically adjusts fluxes for crowded sources. In the second approach, we use 5-pixel apertures for single sources and 3-pixel apertures for weak crowded sources with a flux correction factor of to account for photons outside of the aperture. This small correction factor was derived by comparing 3- and 5-pixel aperture photometry for a few bright sources in the field. Both methods give similar formal statistical errors of typically mag, but for individual sources their photometric results can differ up to mag.
We report apex.pl photometry for the 25 X-ray sources associated with the IC 1396N globule in Table 2. Zero magnitude flux densities of 280.9, 179.7, and 115.0 Jy have been applied to IRAC fluxes in the 3.6, 4.5, and 5.8 m bands, respectively, to convert them to the magnitude system (Reach et al., 2005). We do not report photometry in 8.0 m band as sensitivity is reduced by bright extended emission attributed to polycyclic aromatic hydrocarbons (PAHs).
Table 2 also gives photometry for 20 of the 25 X-ray sources with counterparts in the catalog (limiting magnitude mag) and the somewhat deeper ( mag) NIR observation of the globule by Nisini et al. (2001). separations are generally better than , indicating excellent X-ray astrometry similar to that achieved in the Chandra Orion Ultradeep Project (COUP, Getman et al., 2005a). X-ray sources with NIR counterparts are shown as red and yellow circles in Figure 3; these generally lie in the bright rim of the globule.
3.3 Infrared Properties of Cluster Members
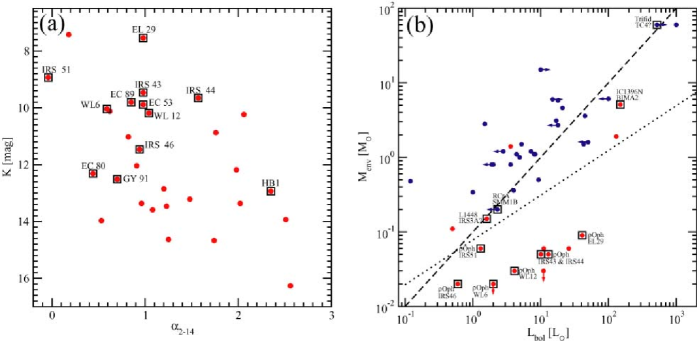
Using the photometric results in Table 2, we place the globule X-ray sources on infrared color-magnitude and color-color diagrams in Figure 4. Most of the X-ray sources appear to be PMS stars with masses of M⊙ subject to mag absorption. A few sources lying inside the head of the globule (e.g. # 73, 78, and 82 in Figure 3) have high absorptions up to 10 mag. In the color-color diagram (Figure 4), a few sources (# 63, 72, and possibly 55, 73, and 77) show the -band excess indicator of a heated inner dusty protoplanetary disk characteristic of accreting Class II PMS stars (e.g. Kenyon & Hartmann, 1995). Most have colors consistent with the reddened photospheres characteristic of Class III PMS stars, as is typically found in X-ray surveys of young stellar clusters.
However, it is now recognized that -band excess is a less reliable indicator of disks and accretion than excesses in MIR bands. -band excess strongly depends on star-disk system parameters such as the disk inclination, accretion rate, and inner disk holes; it can be produced by other phenomena such as extended emission in H II regions and reflection nebulosity. Color indices towards longer MIR wavelengths give more effective measures of protoplanetary disks and better distinguish PMS phases: Class I protostars, Class II accretion disk systems, and Class III systems with weak or absent disks. Observations of Taurus-Auriga young stars with reliable photometry show that the color criteria and give excellent discrimination between Class II and Class 0 or Class I systems (Hartmann et al., 2005). Similarly, the criterion isolates Class 0 and Class I protostellar systems from Class II and Class III T Tauri systems.
vs. and vs. color-color diagrams are shown in Figure 4. Based on the criteria of Hartmann et al. (2005), we classify 6 out of 25 X-ray sources in the IC 1396N cluster as Class 0 or Class I protostars555Five out of six protostellar objects are assigned to Class I, and one object (#66), for which additional (sub)millimeter data suggest a high ratio (§5.1) and a location within the transitional Class 0/I locus on the evolutionary diagram for protostars (§5.3), is assigned to Class 0/I. which we plot as squares in Figures 3 and 4. Sources # 53, 62 and 81 with negligible infrared excesses in all color-color diagrams can be best classified as Class III PMS stars. These are plotted as triangles. The remaining 16 X-ray sources are Class II ‘classical’ T Tauri systems plotted as circles. Classifications based on MIR colors are listed in column 15 of Table 2.
To further elucidate their infrared properties, we present in Figure 5 the infrared spectral energy distributions (SEDs) for all 25 X-ray stars in the IC 1396N globule. Up to six bands ( and IRAC 3.6, 4.5, and 5.8 m) are shown. The panels show the proposed evolutionary sequence with the 6 Class 0 or Class I objects plotted first and the 3 Class III objects plotted last. The SEDs largely confirm the classification derived above from color-magnitude diagrams and emphasize some interesting disk features in a few objects. All protostellar objects (# 60, 66, 68, 71, 76 and 80) have positive slopes of their SEDs with increasing flux towards longer wavelengths. Source # 70, classified as Class II but without a NIR counterpart, is shown next as a likely borderline Class I/II star. The Class II stars have roughly flat spectral slopes. Source #85 shows a small excess at 5.8 m suggesting a disk inner hole, and #67 and 78 have kinked SEDs suggesting flaring disks. The three Class III stars (# 53, 62 and 81) are consistent with simple photospheres.
3.4 Comparison with the Nisini et al. sample
Using the NIR camera SWIRCAM on the 1.1-m telescope AZT-24, Nisini et al. (2001) performed NIR observations of the IC 1396N globule with the sensitivity limits of mag. The twenty reddest NIR sources ( mag and/or mag) were proposed members of the embedded in the globule young cluster. Table 3 gives their positions and -band magnitudes from Nisini et al. (2001), their and counterparts when available, and IRAC photometry obtained by us with procedures as described in §3.2. We omit photometry in the [5.8] band as most have low S/N ratios in this band.
Only four of these twenty sources from Nisini et al. (2001) are detected in our observation. Figure 6 compares their spatial distributions. Most of the red NIR sources are located northward along the same north-south line as the X-ray objects, lying deep in the interior of the globule. Figure 6 shows that most of the NIR sources undetected in X-rays are fainter than the stars ( mag compared to mag). If they are members of the globule, these Nisini et al. stars are less luminous and less massive than the sample. Indeed, combining a standard Initial Mass Function with the limit of M⊙ estimated in §4.3, a population of undetected very low mass globule members is expected. Alternatively, some of the Nisini et al. stars may be reddened background stars seen through the cloud. Good candidates for background stars are NIR stars (their # 1, 5, 6, 14, 15, 18 and 20) with no intrinsic excess in either or colors. Froebrich et al. (2005) use the Besançon Galactic stellar population model to show that the background stars in IC 1396 globules begin to exceed the mag level if the extinction of the cloud is higher than mag. A significant number of reddened background stars is expected for globules with mag; these are mostly M type giants for a cloud with mag, but other spectral types will contaminate NIR samples of clouds with higher extinction.
Three of the Nisini et al. (2001) NIR stars missing from our X-ray image (their # 7, 8 and 17) have color excesses consistent with dusty disk systems and are located within the X-ray cluster. They are also bright in the [3.6] band, with magnitudes far above the sensitivity limit ( mag) of the observation (Figure 6). These stars are probably cluster members with X-ray emission below the sensitivity of our short exposure, or perhaps are viewed with their circumstellar disks nearly edge-on in which case the X-ray absorbing column may be increased (Kastner et al., 2005).
We conclude that the brighter Nisini et al. (2001) stars are very likely globule members with dusty disks: four detected in X-rays plus three bright in the [3.6] band, but undetected in X-rays. Their fainter stars are either M⊙ cloud members or background stars seen through the cloud. But perhaps of greater importance is the failure of NIR methods to identify most of the globule members found in the image. The X-ray stars are all easily seen on NIR images with mag, but their NIR colors do not allow easy discrimination from the contaminating population of Galactic field stars.
4 X-ray Properties of the Cluster
Table 4 gives X-ray photometric and spectral information on our 25 globule members. X-ray photometry is obtained with (§2.2) and includes a number of useful quantities: number of source counts, significance of a KS one-sample test for variability (), and the background-corrected median X-ray photon energy in the keV band ().
4.1 Flaring
Previous studies have shown that PMS stellar X-ray emission is highly variable due to magnetic reconnection flaring (Feigelson et al., 2006). A flare with peak X-ray luminosity erg s-1 occurs every few days in solar-mass Orion PMS stars (Wolk et al., 2005). Between flares, these stars spend 3/4 of the time in a quasi-constant characteristic level that is likely due to microflaring. Flaring rates appear similar in lower mass stars but with lower luminosities. Very powerful flares have also been seen in Class I protostars (Imanishi et al., 2001).
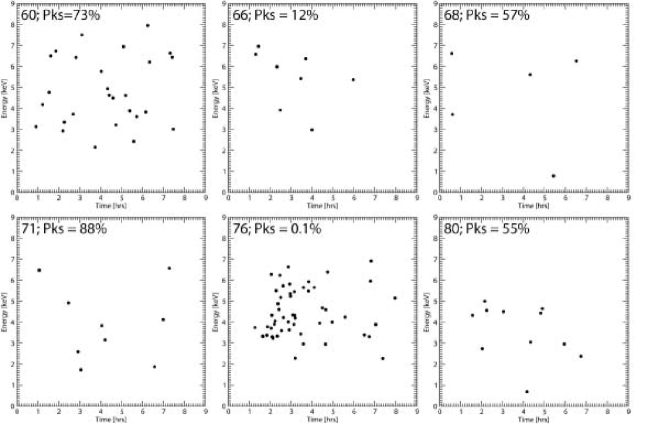
The present observation of IC 1396N has a duration of only hours, so only a small fraction of stars are expected to be found in a flaring state. Typical sources have only counts so that only high amplitude variations can be detected. Table 4 shows that 3 of the 25 sources show statistically significant () variability: the protostar #76 and the T Tauri systems #61 and 70. Tentative evidence for X-ray variations are seen in another protostar (#66) and T Tauri star (#55). Figure 7 shows the time-energy diagrams for photons detected from the six protostars.
4.2 Absorption
X-ray median energy is a reliable indicator of absorbing column density for sources with keV, following the empirical relationship cm-2 (Feigelson et al., 2005). All six X-ray protostars in IC 1396N have keV (Figure 7) corresponding to an absorbing column density of cm-2 (or mag assuming a standard gas-to-dust ratio of Ryter (1996)).
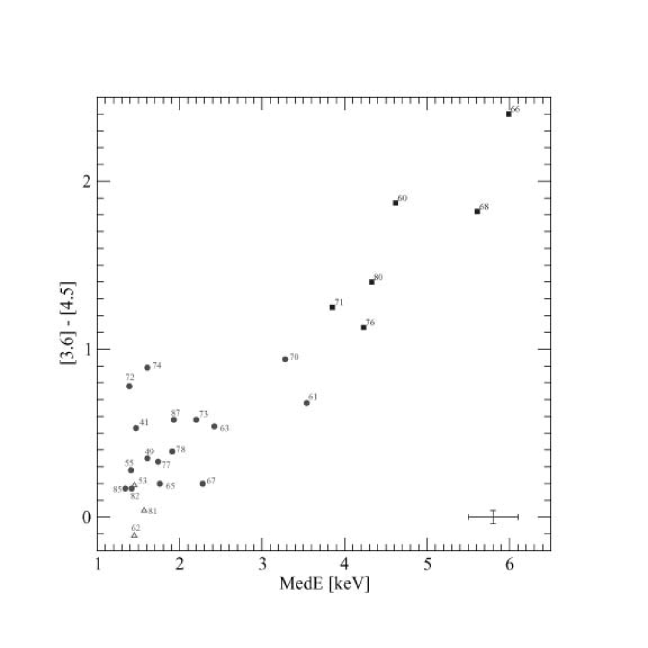
Due to the newly available photometry, we demonstrate for the first time a relationship between X-ray and MIR colors for obscured PMS systems. Figure 8 shows a clear correlation between the MIR color and the X-ray median energy for all hard X-ray sources with keV. A similar relationship is found using the [4.5]-[5.8] color index. We show typical errors for the photometry and for the median energy. The latter was derived from MARX simulations for 10 count X-ray sources with a broad range of spectral parameters (Getman et al., 2006).
X-ray absorption at the energies of interest arises mainly from inner shell photoelectric ionization in metals (N, O, Ne, Mg, Si, Ar, Fe, etc.). Atoms in any physical state — atomic, molecular or solid — contribute to the X-ray absorption. For PMS systems, most of this gas is molecular and lies either in the intervening cloud and/or in the circumstellar envelope or disk. The MIR reddening arises from micron-scale solid-state interstellar grains.
The specific pattern seen in Figure 8 can thus be interpreted as follows. For most T Tauri systems (circles), the scatter in the color is mainly due to different accretion rates; sources with higher accretion rates are redder in due to an increase in emission from the inner disk and the heated ‘wall’ at the dust sublimation edge (Allen et al., 2004). There is no report that higher accretion leads to increased absorption of PMS X-rays; the scatter in for T Tauri stars most likely arises from different amounts of intervening cloud material. At absorptions cm-2, large differences in give relatively small changes in for the ACIS detector (Feigelson et al., 2005). As the maximum line-of-sight column through the IC 1396N globule is mag (§1), random locations in the cloud should produce random scatter up to keV, as observed in Figure 8.
For the protostars (squares), the MIR colors are mostly determined by the density of the local infalling envelope. The color index increases for denser envelopes because the optical depth surface moves to the cooler outer envelope (Allen et al., 2004). The proportional increase in seen among the protostars in Figures 8 thus arises from absorption by molecular gas in the local envelope. This may be the clearest demonstration to date of X-ray absorption from protostellar envelopes independent of absorption in the larger molecular cloud.
4.3 X-ray luminosities, completeness, and the globule stellar population
Results from the ACIS Extract spectral analysis are given in Table 4. Our procedures for fitting X-ray spectra and obtaining broad-band luminosities are based on those described in Getman et al. (2005a, 2006). For the three brightest T Tauri sources with greater than 45 net counts (#61, 62 and 63) and for all protostars, one-temperature APEC plasma emission models were fitted using the XSPEC package assuming 0.3 times solar elemental abundances. To explore the whole range of various alternative models that successfully fit the data, we performed spectral fits on grouped (with different minimum numbers of grouped counts, starting from 1 using the -statistic) as well as on un-grouped (using the C-statistic) spectra. We then performed a visual inspection of all spectral fits to choose the ”most appropriate” spectral fit, in which the plasma energy most closely matches the typical energy of PMS stars seen in the much deeper Orion Nebula data (Getman et al., 2005a). These typical energies are keV for unabsorbed stars with NIR counterparts, keV for absorbed stars with NIR counterparts, and keV for absorbed stars without NIR counterparts. The resulting values lie within dex of absorptions derived from dereddening sources to the 1 Myr PMS isochrone () in the vs. color-magnitude diagram (Figure 4).
For the weaker T Tauri sources in the sample, we assume the absorbing column is the value derived from NIR photometry, and we estimate their plasma energy from plane using Figure 8 in Feigelson et al. (2005). With the and parameters frozen, we then performed fits to derive the spectral model normalization and to calculate broad-band X-ray fluxes.
Formal statistical errors on X-ray luminosities have been estimated through Monte Carlo simulations described in §4.3 of Getman et al. (2006). The scientific reliability of these luminosities, however, is usually lower than the statistical uncertainty for several reasons. First, the will systematically underestimate the true emission for obscured or embedded populations due to the absence of soft band photons. Second, scatter is expected due to intrinsic variability (§4.1). Third, if the distance of 750 pc adopted in this paper were revised to the 615 pc value derived in de Zeeuw et al. (1999), then the PMS stellar X-ray luminosities will systematically be decreased by 0.2 dex. The luminosity in the hard keV energy band corrected for absorption () is most suitable for description and comparison of the intrinsic properties of young stellar objects between T Tauri and protostellar samples.
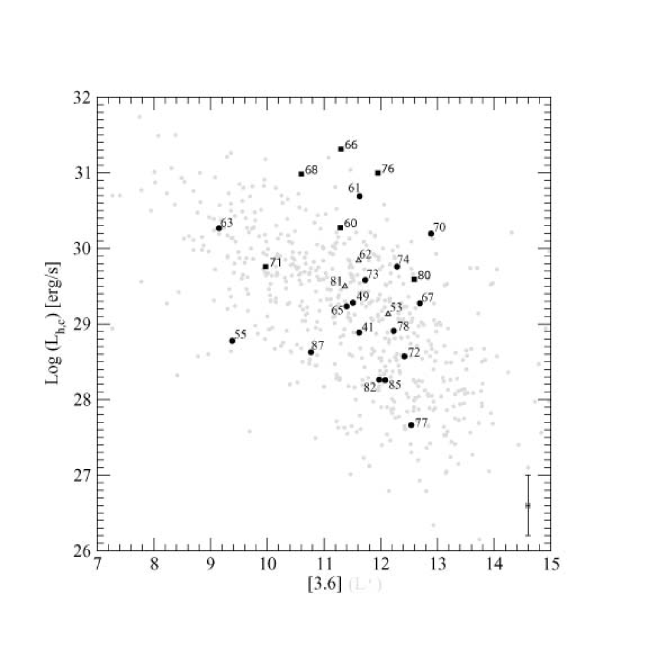
We show in Figure 9 a MIR version of the well-known correlation between X-ray luminosity and bolometric luminosities for PMS stars (e.g. Preibisch et al., 2005b). In the absence of complete detections in the NIR bands, we use the MIR [3.6] IRAC band as a proxy for stellar bolometric luminosity. and values for Orion Nebula T Tauri stars (grey circles, Getman et al., 2005a), adjusted to the distance of the IC 1396N, are shown for comparison. Note that much of the [3.6] or emission can arise from circumstellar disks, particularly in Class I systems (Figure 5), and the stellar value will be lower than the plotted values.
The IC 1396N stars generally follow the distribution seen in Orion stars, although three protostars and the Class I/II system #70 appear overluminous in X-rays. It is not clear whether this implies systematically higher X-ray luminosities in the youngest systems, or the presence of still-undiscovered Class I systems with X-ray luminosities below the sensitivity limit of our short exposure. If the T Tauri mass relation extends into the protostellar regime, lower masses exist within the IC 1396N globule and would be detected with a more sensitive exposure.
The highest luminosities of T-Tauri stars in IC 1396N are ergs s-1, while the sensitivity limit of the observation for the sample is ergs s-1. Using the COUP Mass correlation (Preibisch et al., 2005b), the implied mass corresponds roughly to the stellar mass range of the X-ray T Tauri stars seen in IC 1396N of M⊙, which is similar to that obtained from NIR color-magnitude diagram in §3.3 assuming an age of Myr. Comparison with the Cep B cloud (Getman et al., 2006) is helpful here because its distance, absorption, and exposure are similar to that of IC 1396N. Through a detailed analysis of the X-ray Luminosity Function (XLF) and Initial Mass Function (IMF), we showed that the X-ray unobscured population in Cep OB3b is complete down to M⊙ (assuming an age of 1 Myr). We expect the IC 1396N observation to be similarly nearly complete for masses M⊙. It should capture roughly half of members in the range M⊙ and few members with M⊙.
Although, the total population in IC 1396N is too small to permit a detailed XLF and IMF analysis, we can estimate the total number of unobscured stars (T-Tauri population) in the globule by comparing a ratio of numbers of stars in two mass ranges M⊙ and M⊙ for IC 1396N to that of the COUP Orion unobscured sample. COUP is complete down to M⊙ with the ratio of to stars (§7.2 in Getman et al., 2006). This implies that IC 1396N contains T-Tauri stars with M⊙ which are undetected in our observation, in addition to the detected 19 members. The total stellar mass of the unobscured population (not including brown dwarfs or close binary companions) for the globule is around M⊙.
5 X-rays from the Remarkable Protostar IRAS 21391+5802
5.1 Previous studies of IRAS 21391+5802
IRAS 21391+5802, the most luminous MIR source in the IC 13906N globule, is an embedded protostar producing a bipolar molecular outflow (Sugitani et al., 1989; Saraceno et al., 1996a). From JCMT photometry and ISO satellite spectrometry, Saraceno et al. (1996b) derive a bolometric luminosity of 235 L⊙. Nisini et al. (2001) obtain the ratio of , where is the luminosity emitted longward of 350m. This suggests the source may be classified as an extremely young Class 0 protostar, according to the criterion recommended by André et al. (2000). The millimeter emission is resolved into two sources, A and B, by the OVRO array (Codella et al., 2001).
The highest-resolution studies of the source have been made with the BIMA millimeter array and the VLA at centimeter wavelengths by Beltrán et al. (2002), resolving the emission into three sources separated by . BIMA 2 (= VLA 2 = OVRO A) is associated with the IRAS 21391+5802 MIR emission and drives the strong molecular outflow. The circumstellar mass from BIMA 2 is M⊙ in a very extended envelope and bolometric luminosity is 150 L⊙, while the other two components have envelopes with M⊙. Taking all available information into account, Beltrán et al. classify BIMA 2 as an embedded intermediate-mass protostar likely to emerge as a main sequence A- or B-type star. The source fits the correlation of normalized outflow momentum and envelope mass found for low-mass Class 0 objects (Bontemps et al., 1996). BIMA 1 (which powers a small bipolar outflow) and BIMA 3 are lower mass, and probably more evolved, objects.
5.2 and properties
Source #66 in our image is a faint, extremely hard X-ray source within of BIMA 2 = VLA 2 (Figure 10). Another X-ray source #68 is within of BIMA 3 = VLA 3 666X-ray source #60 lies north of VLA 1 and northwest of BIMA 1. This offset is too large to be considered a reliable coincidence. Instead, we associate #60 with NIR #2 of Nisini et al. (2001) with bright MIR emission in the data lying within 0.8″ of the Chandra position.. The X-ray spectrum of #66, though based on only 8 extracted photons, is very unusual: it has the highest median energy of all sources in the field ( keV; see Table 4, Figures 7 and 8). The inferred absorbing column density is cm-2, corresponding to mag. This is one of the most heavily absorbed sources ever seen with the observatory; for example, its is similar to the most embedded protostar in OMC-1 behind the Orion Nebula, COUP source # 632 (Grosso et al., 2005). Adopting this value, the inferred intrinsic hard band luminosity corrected for absorption is ergs s-1, by far the most luminous X-ray source in the IC 1396N globule.
Examination of the photon arrival times shows that seven out of eight X-ray photons detected from source #66 arrived within the first half of the exposure (Figure 7). A Kolmogorov-Smirnov test gives only a hint of possible variability. To evaluate this independently, we simulated arrival times for 8 photons assuming constant emission and tabulated the fraction of samples with splits {7,1} and {8,0} across the mid-point of the observing interval. The probability for a constant source to produce such an imbalanced arrival pattern is 3%. It is thus likely that IRAS 21391+5802 was seen during the decay of a magnetic reconnection flare during our observation.
The 70 m image (Figure 10) establishes the high far-infrared luminosities, and thus extreme youth, of the protostars #66 (BIMA 2) and #68 (BIMA 3). The other four X-ray protostars show 3.6 m emission (Figure 10) but are not as bright in 70 m as # 66 and 68. Other measures all indicate that #66 is the youngest object in the globule: extreme colors in the color-color diagram (Figure 4), the extraordinary X-ray absorption (above), the high bolometric luminosity, strong submillimeter emission, thermal centimeter emission, and a collimated molecular outflow (§5.1). In their detailed study of IRAS 21391+5802, Beltrán et al. (2002) conclude that BIMA 2 is the youngest object in the globule and is an intermediate-mass protostar with circumstellar mass M⊙.
5.3 Comparison with other X-ray Emitting Protostars
We seek here to understand how the IC 1396N X-ray protostars, and particularly #66 = IRAS 21391+5802, fit in the larger context of X-rays from protostars. The critical astrophysical question is whether X-rays are present in Class 0 stars at the very onset of star formation when collimated outflows begin. This is required if X-rays are the principal ionization source at the base of protostellar molecular outflows (Shang et al., 2002; Ferro-Fontán & de Castro, 2003; Shang et al., 2004).
Tables 5 and 6 summarize a literature search of young protostars observed at high sensitivity in X-rays. Quantitative evaluation of X-ray luminosities and upper limits is difficult to obtain, as the values are strongly dependent on the intervening column density which is often poorly determined. We thus give protostellar distances, X-ray exposure times, and a binary indicator whether the source was detected. Pre-/ observations are much less sensitive and are ignored. Table 5a gives results for 32 very young (mostly Class 0) protostars in a variety of star forming regions, including IC 1396N BIMA 2 discussed here. Tables 5b and 6 focus on well-characterized samples of the nearby Ophiuchus and Serpens cloud older (Class I) protostars. We list , the spectral index between m and m from studies, and band magnitude from NIR studies.
Figure 11 shows the X-ray detectability of Class I protostars in the Ophiuchus and Serpens clouds as a function of band luminosity (a surrogate for bolometric luminosity and mass) and infrared spectral index (a surrogate for disk mass and extinction and thus for evolutionary stage, André et al., 2000). Here, the band magnitudes for Serpens stars are adjusted to match the distance of the Ophiuchus cloud. The diagram shows that twelve out of 34 Class I protostars have been detected in X-rays (symbols with boxes). Detections are preferentially protostars with higher stellar mass and later evolutionary stage.
Figure 11 displays X-ray detections in a plot with three different discriminants between Class 0 and Class I systems. The blue red symbols show the classification in the published literature (Table 5). The dashed line shows the ratio in M⊙/L⊙ units, which is roughly equivalent to the criterion of André et al. (2000). The dotted line marks the locus where half of the mass of the initial pre-stellar condensations have been accreted in the evolutionary models of André et al. (2000).
This diagram does not show the clear link between X-rays and bolometric luminosity seen in Figure 11, but does show the association with evolutionary stage. Most of the X-ray detections have low Menv and lie clearly in the Class I regime. Four X-ray detected stars lie along the poorly-defined Class 0/I boundary: IRS 3A in Lynds 1448 (Tsujimoto et al., 2005), SMM 1B (= IRS 7B) in R Corona Australis (R CrA, Hamaguchi et al., 2005), TC 4 in the Trifid Nebula (Rho et al., 2004), and BIMA 2 (= IRAS 21391+5802) in the IC 1396N globule discussed here777We omit here the early report of Class 0 X-ray source slightly displaced from a binary system of Class I protostars in the OMC 2/3 region (Tsuboi et al., 2001; Tsujimoto et al., 2002b). NIR and MIR photometry indicate these stars have Class I SEDs with mag (Nielbock et al., 2003; Tsujimoto et al., 2004). The X-ray source lies ″ from one component along an ionized jet, and thus may arise from strong shocks in the outflow (Tsujimoto et al. 2004). There is no evidence for a Class 0 source at the location of the X-ray source, although this possibility is not firmly excluded..
Only one of the three previous reports appears reliable. The X-ray source attributed to TC 4 lies at the edge of the ACIS field were point spread function is degraded, and its reported position is from the millimeter dust continuum source TC 4 and could also be associated with more evolved 2MASS sources (Lefloch & Cernicharo, 2000; Rho et al., 2004). The X-ray source associated with the very young low-mass Class I protostar IRS 3A in L 1448 has only three photons, although they arrived during first 5 hours of the 19 hour exposure suggesting a flare (Ciardi et al., 2003; Tsujimoto et al., 2005). The detection of a Class 0/I protostar in R CrA appears reliable. The X-ray source has dozens of photons and a thousand photons (Hamaguchi et al., 2005, also see footnote to Table 5). The X-ray position precisely coincides the deeply embedded radio source VLA 10B (Feigelson et al., 1998) which Nutter et al. (2005) identifies with the submillimeter source SMM 1B. There are no other nearby NIR or MIR sources, and the SED clearly denotes a Class 0 protostar.
In this context, our report of 8 X-ray photons from BIMA 2 in the IC 1396N globule represents the second excellent case for X-rays from a Class 0/I star. Its borderline Class 0/I status is based on its SED and outflow characteristics, as argued in detail by Beltrán et al. (2002). The ultra-hard X-ray spectrum guarantees that the events are not from instrumental background or un-embedded star. The positions at millimeter, radio, MIR, FIR and X-ray wavebands agree to better than an arcsecond. As discussed in §4.2, the X-ray absorption is attributed to the local infalling envelope of high mass . The high X-ray luminosity reasonably scales with its high mass, given the correlation between stellar mass and X-ray emission seen in Class I/II/III systems (Figures 9 and 11). We can reasonably guess that the underlying star has mass M⊙, which is consistent with erg s-1. The X-ray source would not have been detected in our short exposure has the protostar had a more typical mass M⊙ and X-ray luminosity erg s-1.
6 Implications for Triggered Star Formation
The results of this study constitute strong endorsement for models of triggered star formation in CGs embedded in giant HII regions. Our basic findings are summarized in the maps of the IC 1396N globule: Figure 3 shows the 25 X-ray stars with respect to the infrared dust emission and Figure 6 adds the red NIR stars of Nisini et al. (2001). The stellar members are not uniformly distributed across the globule, but rather are concentrated in an elongated pattern pc long and pc wide oriented towards the ionizing star HD 206267. This spatial distribution immediately suggests a physical relationship between star formation and the ionization front in the globule.
The stellar grouping shows a distinct age gradient. Two of the three Class III stars (yellow triangles in the maps) lie nearly 0.5 pc outside the current globule boundary towards the ionizing star. Most of the Class II stars (red circles) are superposed on the bright rim, again in front of the molecular globule. The Class 0/I protostars (blue squares) lie in a tight concentration of pc2 embedded in the molecular material. The Nisini et al. (2001) stars lie furthest from the ionization front but, as discussed in § 3.4, many of these stars may not be members of the cluster. This age gradient directly supports a causal relationship between the progressive evaporation of the globule by the ionization front and star formation.
These two phenomena – an elongated spatial distribution and an age gradient oriented towards the exciting star – have been found in other irradiated bright-rimmed CGs by Sugitani and colleagues. They established catalogs of several dozen bright-rimmed globules with embedded sources or T Tauri stars (Sugitani et al., 1991; Sugitani & Ogura, 1994; Sugitani et al., 2000). These include other globules in the giant IC 1396 HII region (Nakano et al., 1989; Sugitani et al., 1997). Age gradients, with the youngest stars deeply embedded and older stars aligned towards the ionizing star as we see in IC 1396N, were reported in a number of cases including the well-known Eagle Nebula, M 16 (Sugitani et al., 1995, 2002; Matsuyanagi et al., 2006). They frequently find ”a small cluster of red stars that is elongated along the axis of the clouds, toward the tip of the BRC [bright rimmed cloud] and extending farther out”, arising from a process they call ”small-scale sequential star formation” (Ogura et al., 2002). This is supported by the spatial distribution of young stars in the L 1616 cloud near the Orion complex (Stanke et al., 2002) and distribution of H2O masers in several irradiated clouds (Healy et al., 2004). Our findings have an advantage in that older disk-free PMS stars can be sampled, and many younger highly obscured protostars can be discovered. Previous studies were largely restricted to very young often spatially unresolved systems with millimeter and infrared excesses from dusty disks and accreting T Tauri stars with strong optical emission lines.
Based on the triggered star formation concept, we can make a some simple model-independent estimates of the triggering process. If we assume that the T-Tauri population (Class II and Class III stars), lying pc from the embedded population (Figure 3), have ages Myr, and the embedded Class 0/I protostars have typical ages Myr, we find that the triggering shock propagated at a velocity pc/1 Myr or 0.6 km s-1. At this rate, the globule should be completely shocked in another Myr. The star formation efficiency for the T-Tauri population can be roughly estimated to be % with M⊙ in stars (§4.3) and M⊙ in molecular gas (§1). Considering that the original globule was substantially larger and more massive than it appears today, the efficiency is probably below 4%, perhaps %. This suggests that the total population of second-generation triggered stars is unlikely to exceed the population of the first-generation cluster which produced the HII region.
A remarkable aspect of the IC 1396N findings is the discovery of 6 X-ray emitting protostars in an observation times less sensitive than the observations of Ophiuchus and Serpens protostar clouds discussed in §5.3. Number of X-ray detected protostars in IC 1396N (6 protostars) is comparable with that of Ophiuchus (8) and Serpens (4) observations, but their intrinsic X-ray luminosities on average are above those in Ophiuchus and Serpens protostar, implying higher mass objects, despite that the estimated total population of previous generation of stars (T-Tauri population) in IC 1396N is only , several times smaller than the clusters found in the Ophiuchus and Serpens clouds. Two explanations suggest themselves. First, a population of still-unidentified lower luminosity protostars may be present, implying an extremely high ratio of Class 0/I Class II/III systems compared to most embedded stellar clusters. Within the assumption of a similar IMF shape for both protostellar and T-Tauri populations, the former would actually outnumber the latter resulting in an increase of the star formation efficiency in the globule over time. Second, the process that triggered IC 1396N globule may produce a non-standard IMF, preferentially intermediate-mass stars rather than lower mass stars. Sugitani et al. (1991) suggested this would be a natural consequence of radiation-driven implosion mechanism in CGs. In this case we can estimate only a lower limit on the total mass of the detected protostellar population of M⊙, which would yield a star formation efficiency of % or higher. Either of these explanations indicates that IC 1396N, and possibly other CGs, have unusual protostellar populations.
The relatively high number of X-ray protostars found in IC 1396N indicates an early evolutionary stage of the globule. Analytic theory of the radiation driven implosion (RDI) model for triggered star formation by HII regions shows that the process occurs in two stages: the early collapse phase during which star formation is induced, followed by a stationary regime when a globule has developed the characteristic cometary structure (Bertoldi, 1989; Bertoldi & McKee, 1990). Two-dimensional hydrodynamical simulations show that the collapse stage occurs rapidly in Myr ( of the cloud’s lifetime) with the first compression triggering early star formation (Lefloch & Lazareff, 1994). Three-dimensional calculations indicate that the initial burst of star formation may be delayed by Myr after the first compression (Kessel-Deynet & Burkert, 2003; Miao et al., 2006).
The calculated geometry of the RDI compressed cloud closely resembles the spatial distribution of stars in IC 1396N. The initial passage of the ionization front is followed by several expansions and re-compressions producing double-peaked molecular line profiles. The second, cometary phase with the globule in a quasi-hydrostatic equilibrium, has no conspicuous spectroscopic signatures, and lasts longer (from a few yr to a few Myr, of the cloud’s lifetime). CO maps of the southern part of the IC 1396N globule show blue- and red-shifted emission suggesting that IC 1396N is in the transient early phase of expansions and re-compressions (Codella et al., 2001).
The collect-and-collapse model for triggered star formation has been less well-studied. In the hydrodynamical calculation of a dense CG in the vicinity of an O star, the shock front generally moves a bit faster than the ionization front. The density spikes between the fronts, and gravitational collapse can proceed in this travelling thin shell (Hosokawa & Inutsuka, 2006). This would produce a spatial gradient in star ages similar to what we find in IC 1396N. However, the calculated velocity of the front propagation into the globule is typically several km s-1, which is an order of magnitude faster than our estimate of km s-1 above.
7 Conclusions
We report results from a 30 ks study of the stellar population in the cometary globule IC 1396N, previously recognized as a site of star formation triggered by an HII region expanding into an inhomogeneous molecular cloud. Of the 117 X-ray sources in the field, 25 appear associated with young stars formed in the globule. Although relatively bright ( mag), most of these were previously unidentified due to confusion with unrelated Galactic stars. X-ray selection is very effective in isolating PMS members from old field stars, and the extragalactic contaminants can be removed with some reliability. About of the other sources in the X-ray field are likely members of the 3 Myr old open cluster Trumpler 37 that is dispersed throughout the large IC 1396 HII region.
2MASS NIR and MIR photometry permit evaluation of the disk properties of the 25 X-ray stars. Using the standard PMS evolutionary classification, we find: 1 transitional Class 0/I protostar, 5 Class I protostars, 1 transitional Class I/II star, 15 Class II classical T Tauri stars, and 3 Class III weak-lined T Tauri stars. This is clearly a younger population than many X-ray-studied stellar clusters in nearby molecular clouds (e.g., Orion Nebula, Ophiuchus, Chamaeleon) where the Class III population outnumbers the younger systems.
From NIR photometry, the T-Tauri (lightly obscured) X-ray population in the globule have estimated masses between 0.2 and 2 M⊙ and typical absorptions of visual magnitudes. Intrinsic X-ray luminosities range from to erg s-1 in the hard keV band with spectral and variability characteristics typical of low-mass PMS stars. Using the established relationship between X-ray luminosity and mass to evaluate the population falling below our X-ray detection limit, we estimate that the total T-Tauri population of the globule is stars with an integrated mass M⊙. This yields a star formation efficiency of depending on the original mass of the globule.
A spatial gradient in stellar ages is discovered with the protostars deeply embedded in the IC 1396N globule, the Class II systems congregating in the bright ionized rim, and the older Class III in the outer rim. The stars lie in a line pointing towards the ionizing O star HD 206267. This independently supports linear gradients of PMS stars found by Sugitani and colleagues in several other cometary globules, and confirms the basic hypothesis of triggering by passage of HII region shocks into the molecular globule. Our estimated velocity of shock front proceeding into the globule of km s-1 is an order of magnitude smaller than a typical value of several km s-1 used in “collect-and-collapse” models for triggered star formation.
The discovery of relatively high numbers of quite massive, X-ray luminous protostars in IC 1396N globule from a short exposure suggests that either a population of still-unidentified lower mass protostars is present, implying an unusually high ratio of Class I/0 Class II/III systems, or the triggering process produces a non-standard IMF biased towards higher mass stars. The X-ray protostellar population reveals the very young age ( Myr) of the globule, which agrees with the gas dynamics inferred from CO line shapes. This all supports the RDI model of triggered star formation in IC 1396N.
We establish source #66 (CXOU J214041.81581612.3) as one of the youngest objects ever detected in the X-ray band. It lies within 0.5″ of the luminous far-infrared/millimeter source IRAS 21391+5802 = BIMA 2, classified as a Class 0-I borderline protostar. In a novel comparison of X-ray absorption with MIR colors, we demonstrate that the X-ray absorption of protostellar objects should be attributed to the local molecular gas in their infalling envelopes, rather than from ambient molecular cloud material.
References
- Allen et al. (2004) Allen, L. E., et al. 2004, ApJS, 154, 363
- André et al. (1993) André, P., Ward-Thompson, D., & Barsony, M. 1993, ApJ, 406, 122
- André & Montmerle (1994) André, P., & Montmerle, T. 1994, ApJ, 420, 837
- André et al. (2000) André, P., Ward-Thompson, D., & Barsony, M. 2000, Protostars and Planets IV, 59
- Baraffe et al. (1998) Baraffe, I., Chabrier, G., Allard, F., & Hauschildt, P. H. 1998, A&A, 337, 403
- Beltrán et al. (2002) Beltrán, M. T., Girart, J. M., Estalella, R., Ho, P. T. P., & Palau, A. 2002, ApJ, 573, 246
- Bertoldi (1989) Bertoldi, F. 1989, ApJ, 346, 735
- Bertoldi & McKee (1990) Bertoldi, F., & McKee, C. F. 1990, ApJ, 354, 529
- Bontemps et al. (1996) Bontemps, S., Andre, P., Terebey, S., & Cabrit, S. 1996, A&A, 311, 858
- Bontemps et al. (2001) Bontemps, S., et al. 2001, A&A, 372, 173
- Brown (1987) Brown, A. 1987, ApJ, 322, L31
- Ciardi et al. (2003) Ciardi, D. R., Telesco, C. M., Williams, J. P., Fisher, R. S., Packham, C., Piña, R., & Radomski, J. 2003, ApJ, 585, 392
- Codella et al. (2001) Codella, C., Bachiller, R., Nisini, B., Saraceno, P., & Testi, L. 2001, A&A, 376, 271
- Cox (2000) Cox A. N. 2000, Astrophysical Quantities, Publisher: Springer (4rd edition), 2000
- D’Alessio et al. (2000) D’Alessio, F., et al. 2000, ESA SP-445: Star Formation from the Small to the Large Scale, 355
- Deharveng et al. (2005) Deharveng, L., Zavagno, A., & Caplan, J. 2005, A&A, 433, 565
- de Zeeuw et al. (1999) de Zeeuw, P. T., Hoogerwerf, R., de Bruijne, J. H. J., Brown, A. G. A., & Blaauw, A. 1999, AJ, 117, 354
- Duchêne et al. (2004) Duchêne, G., Bouvier, J., Bontemps, S., André, P., & Motte, F. 2004, A&A, 427, 651
- Eislöffel et al. (2003) Eislöffel, J., Froebrich, D., Stanke, T., & McCaughrean, M. J. 2003, ApJ, 595, 259
- Elmegreen & Lada (1977) Elmegreen, B. G., & Lada, C. J. 1977, ApJ, 214, 725
- Elmegreen (1998) Elmegreen, B. G. 1998, ASP Conf. Ser. 148: Origins, 148, 150
- Elmegreen (2002) Elmegreen, B. G. 2002, IAU Symposium, 207, 390
- Fazio et al. (2004) Fazio, G. G., et al. 2004, ApJS, 154, 10
- Feigelson et al. (1998) Feigelson, E. D., Carkner, L., & Wilking, B. A. 1998, ApJ, 494, L215
- Feigelson & Montmerle (1999) Feigelson, E. D., & Montmerle, T. 1999, ARA&A, 37, 363
- Feigelson et al. (2002) Feigelson, E. D., Broos, P., Gaffney, J. A., Garmire, G., Hillenbrand, L. A., Pravdo, S. H., Townsley, L., & Tsuboi, Y. 2002a, ApJ, 574, 258
- Feigelson et al. (2005) Feigelson, E. D., et al. 2005, ApJS, 160, 379
- Feigelson et al. (2006) Feigelson, E., Townsley, L., Güdel, M. & Stassun, K. 2006, in Protostars and Planets V (B. Reipurth et al., eds.), Univ. Arizona Press, in press
- Ferro-Fontán & de Castro (2003) Ferro-Fontán, C., & de Castro, A. I. G. 2003, MNRAS, 342, 427
- Froebrich et al. (2005) Froebrich, D., Scholz, A., Eislöffel, J., & Murphy, G. C. 2005, A&A, 432, 575
- Froebrich (2005) Froebrich, D. 2005, ApJS, 156, 169
- Fukuda et al. (2002) Fukuda, N., Hanawa, T., & Sugitani, K. 2002, ApJ, 568, L127
- Gagné et al. (2004) Gagné, M., Skinner, S. L., & Daniel, K. J. 2004, ApJ, 613, 393
- Garmire et al. (2003) Garmire, G. P., Bautz, M. W., Ford, P. G., Nousek, J. A., & Ricker, G. R. 2003, Proc. SPIE, 4851, 28
- Gehrels (1986) Gehrels, N. 1986, ApJ, 303, 336
- Getman et al. (2002) Getman, K. V., Feigelson, E. D., Townsley, L., Bally, J., Lada, C. J., & Reipurth, B. 2002, ApJ, 575, 354
- Getman et al. (2005a) Getman, K. V., et al. 2005a, ApJS, 160, 319
- Getman et al. (2005b) Getman, K. V., Feigelson, E. D., Grosso, N., McCaughrean, M. J., Micela, G., Broos, P., Garmire, G., & Townsley, L. 2005b, ApJS, 160, 353
- Getman et al. (2006) Getman, K. V., Feigelson, E. D., Townsley, L., Broos, P., Garmire, G., & Tsujimoto, M. 2006, ApJS, 163, 306
- Gorti & Hollenbach (2002) Gorti, U., & Hollenbach, D. 2002, ApJ, 573, 215
- Grosso et al. (2005) Grosso, N., et al. 2005, ApJS, 160, 530
- Habing & Israel (1979) Habing, H. J., & Israel, F. P. 1979, ARA&A, 17, 345
- Hamaguchi et al. (2005) Hamaguchi, K., Corcoran, M. F., Petre, R., White, N. E., Stelzer, B., Nedachi, K., Kobayashi, N., & Tokunaga, A. T. 2005, ApJ, 623, 291
- Hartmann et al. (2005) Hartmann, L., Megeath, S. T., Allen, L., Luhman, K., Calvet, N., D’Alessio, P., Franco-Hernandez, R., & Fazio, G. 2005, ApJ, 629, 881
- Hartquist & Dyson (1997) Hartquist, T. W., & Dyson, J. E. 1997, IAU Symp. 182: Herbig-Haro Flows and the Birth of Stars, 182, 537
- Healy et al. (2004) Healy, K. R., Hester, J. J., & Claussen, M. J. 2004, ApJ, 610, 835
- Henney (2006) Henney, W. J. 2006, in Diffuse Matter from Star Forming Regions to Active Galaxies (T. W. Hartquist et al., eds.), astro-ph/0602626
- Hosokawa & Inutsuka (2005) Hosokawa, T., & Inutsuka, S.-i. 2005, ApJ, 623, 917
- Hosokawa & Inutsuka (2006) Hosokawa, T., & Inutsuka, S.-i. 2006, ApJ, in press, astro-ph/0511165
- Imanishi et al. (2001) Imanishi, K., Koyama, K., & Tsuboi, Y. 2001, ApJ, 557, 747
- Jiang et al. (2002) Jiang, Z., et al. 2002, ApJ, 577, 245
- Kaas et al. (2004) Kaas, A. A., et al. 2004, A&A, 421, 623
- Karr & Martin (2003) Karr, J. L., & Martin, P. G. 2003, ApJ, 595, 900
- Kastner et al. (2005) Kastner, J. H., Franz, G., Grosso, N., Bally, J., McCaughrean, M. J., Getman, K., Feigelson, E. D., & Schulz, N. S. 2005, ApJS, 160, 511
- Kenyon & Hartmann (1995) Kenyon, S. J., & Hartmann, L. 1995, ApJS, 101, 117
- Kessel-Deynet & Burkert (2003) Kessel-Deynet, O., & Burkert, A. 2003, MNRAS, 338, 545
- Kim et al. (2005) Kim, J. S., Walter, F. M., & Wolk, S. J. 2005, AJ, 129, 1564
- Klein et al. (1980) Klein, R. I., Sandford, M. T., & Whitaker, R. W. 1980, Space Science Reviews, 27, 275
- Lee et al. (2005) Lee, H.-T., Chen, W. P., Zhang, Z.-W., & Hu, J.-Y. 2005, ApJ, 624, 808
- Lefloch & Lazareff (1994) Lefloch, B., & Lazareff, B. 1994, A&A, 289, 559
- Lefloch & Cernicharo (2000) Lefloch, B., & Cernicharo, J. 2000, ApJ, 545, 340
- Loren & Wootten (1978) Loren, R. B., & Wootten, H. A. 1978, ApJ, 225, L81
- Lyons (1991) Lyons, L. 1991, A Practical Guide to Data Analysis for Physical Science Students (Cambridge: Cambridge Univ. Press)
- Matsuyanagi et al. (2006) Matsuyanagi, I., Itoh, Y., Sugitani, K., Oasa, Y., Mukai, T., & Tamura, M. 2006, PASJ, in press (astro-ph/0605579)
- Matthews (1979) Matthews, H. I. 1979, A&A, 75, 345
- Miao et al. (2006) Miao, J., White, G. J., Nelson, R., Thompson, M., & Morgan, L. 2006, MNRAS, 369, 143
- Moffat et al. (2002) Moffat, A. F. J., et al. 2002, ApJ, 573, 191
- Nakano et al. (1989) Nakano, M., Tomita, Y., Ohtani, H., Ogura, K., & Sofue, Y. 1989, PASJ, 41, 1073
- Nielbock et al. (2003) Nielbock, M., Chini, R., Muller, S. A. H. 2003, A&A, 408, 245
- Nisini et al. (2001) Nisini, B., et al. 2001, A&A, 376, 553
- Noriega-Crespo et al. (2004) Noriega-Crespo, A., Moro-Martin, A., Carey, S., Morris, P. W., Padgett, D. L., Latter, W. B., & Muzerolle, J. 2004, ApJS, 154, 402
- Nutter et al. (2005) Nutter, D. J., Ward-Thompson, D., & André, P. 2005, MNRAS, 357, 975
- Ogura et al. (2002) Ogura, K., Sugitani, K., & Pickles, A. 2002, AJ, 123, 2597
- Pravdo et al. (2001) Pravdo, S. H., Feigelson, E. D., Garmire, G., Maeda, Y., Tsuboi, Y., & Bally, J. 2001, Nature, 413, 708
- Preibisch (2003) Preibisch, T. 2003, A&A, 401, 543
- Preibisch (2004a) Preibisch, T. 2004a, A&A, 428, 569
- Preibisch & Zinnecker (2004b) Preibisch, T., & Zinnecker, H. 2004b, A&A, 422, 1001
- Preibisch & Feigelson (2005) Preibisch, T., & Feigelson, E. D. 2005, ApJS, 160, 390
- Preibisch et al. (2005b) Preibisch, T., et al. 2005b, ApJS, 160, 401
- Reach et al. (2005) Reach, W. T., et al. 2005, PASP, 117, 978
- Reipurth (1983) Reipurth, B. 1983, A&A, 117, 183
- Reipurth et al. (2003) Reipurth, B., Armond, T., Raga, A., & Bally, J. 2003, ApJ, 593, L47
- Rho et al. (2004) Rho, J., Ramírez, S. V., Corcoran, M. F., Hamaguchi, K., & Lefloch, B. 2004, ApJ, 607, 904
- Rieke et al. (2004) Rieke, G. H., et al. 2004, ApJS, 154, 25
- Ryter (1996) Ryter, C. E. 1996, Ap&SS, 236, 285
- Saraceno et al. (1996a) Saraceno, P., Andre, P., Ceccarelli, C., Griffin, M., & Molinari, S. 1996, A&A, 309, 827
- Saraceno et al. (1996b) Saraceno, P., et al. 1996, A&A, 315, L293
- Schulz et al. (1997) Schulz, N. S., Berghoefer, T. W., & Zinnecker, H. 1997, A&A, 325, 1001
- Schwartz et al. (1991) Schwartz, R. D., Wilking, B. A., & Giulbudagian, A. L. 1991, ApJ, 370, 263
- Serabyn et al. (1993) Serabyn, E., Guesten, R., & Mundy, L. 1993, ApJ, 404, 247
- Shang et al. (2002) Shang, H., Glassgold, A. E., Shu, F. H., & Lizano, S. 2002, ApJ, 564, 853
- Shang et al. (2004) Shang, H., Lizano, S., Glassgold, A., & Shu, F. 2004, ApJ, 612, L69
- Siess et al. (2000) Siess, L., Dufour, E., & Forestini, M. 2000, A&A, 358, 593
- Simon et al. (2004) Simon, T., Andrews, S. M., Rayner, J. T., & Drake, S. A. 2004, ApJ, 611, 940
- Simonson (1968) Simonson, S. C. I. 1968, ApJ, 154, 923
- Skinner et al. (2003) Skinner, S., Gagné, M., & Belzer, E. 2003, ApJ, 598, 375
- Slysh et al. (1999) Slysh, V. I., Val’tts, I. E., Migenes, V., Fomalont, E., Hirabayashi, H., Inoue, M., & Umemoto, T. 1999, ApJ, 526, 236
- Smith et al. (2000) Smith, N., Egan, M. P., Carey, S., Price, S. D., Morse, J. A., & Price, P. A. 2000, ApJ, 532, L145
- Stanke et al. (2002) Stanke, T., Smith, M. D., Gredel, R., & Szokoly, G. 2002, A&A, 393, 251
- Sugitani et al. (1989) Sugitani, K., Fukui, Y., Mizuni, A., & Ohashi, N. 1989, ApJ, 342, L87
- Sugitani et al. (1991) Sugitani, K., Fukui, Y., & Ogura, K. 1991, ApJS, 77, 59
- Sugitani & Ogura (1994) Sugitani, K., & Ogura, K. 1994, ApJS, 92, 163
- Sugitani et al. (1995) Sugitani, K., Tamura, M., & Ogura, K. 1995, ApJ, 455, L39
- Sugitani et al. (1997) Sugitani, K., Morita, K.-I., Nakano, M., Tamura, M., & Ogura, K. 1997, ApJ, 486, L141
- Sugitani et al. (2000) Sugitani, K., Matsuo, H., Nakano, M., Tamura, M., & Ogura, K. 2000, AJ, 119, 323
- Sugitani et al. (2002) Sugitani, K., et al. 2002, ApJ, 565, L25
- Tofani et al. (1995) Tofani, G., Felli, M., Taylor, G. B., & Hunter, T. R. 1995, A&AS, 112, 299
- Townsley et al. (2002) Townsley, L. K., Broos, P. S., Nousek, J. A., & Garmire, G. P. 2002, Nuclear Instruments and Methods in Physics Research A, 486, 751
- Townsley et al. (2003) Townsley, L. K., Feigelson, E. D., Montmerle, T., Broos, P. S., Chu, Y.-H., & Garmire, G. P. 2003, ApJ, 593, 874
- Townsley et al. (2006) Townsley, L. K., Broos, P. S., Feigelson, E. D., Garmire, G. P., & Getman, K. V. 2006, AJ, 131, 2164
- Tsuboi et al. (2001) Tsuboi, Y., Koyama, K., Hamaguchi, K., Tatematsu, K., Sekimoto, Y., Bally, J., & Reipurth, B. 2001, ApJ, 554, 734
- Tsujimoto et al. (2002a) Tsujimoto, M., Koyama, K., Tsuboi, Y., Goto, M., & Kobayashi, N. 2002, ApJ, 566, 974
- Tsujimoto et al. (2002b) Tsujimoto, M., Koyama, K., Tsuboi, Y., Chartas, G., Goto, M., Kobayashi, N., Terada, H., & Tokunaga, A. T. 2002, ApJ, 573, 270
- Tsujimoto et al. (2004) Tsujimoto, M., Koyama, K., Kobayashi, N., Saito, M., Tsuboi, Y., & Chandler, C. J. 2004, PASJ, 56, 341
- Tsujimoto et al. (2005) Tsujimoto, M., Kobayashi, N., & Tsuboi, Y. 2005, AJ, 130, 2212
- Walborn & Panek (1984) Walborn, N. R., & Panek, R. J. 1984, ApJ, 286, 718
- Walborn et al. (2002) Walborn, N. R., Maíz-Apellániz, J., & Barbá, R. H. 2002, AJ, 124, 1601
- Weikard et al. (1996) Weikard, H., Wouterloot, J. G. A., Castets, A., Winnewisser, G., & Sugitani, K. 1996, A&A, 309, 581
- Weisskopf et al. (2002) Weisskopf, M. C., Brinkman, B., Canizares, C., Garmire, G., Murray, S., & Van Speybroeck, L. P. 2002, PASP, 114, 1
- Werner et al. (2004) Werner, M. W., et al. 2004, ApJS, 154, 1
- Whitney et al. (2004) Whitney, B. A., et al. 2004, ApJS, 154, 315
- Wilking et al. (1993) Wilking, B., Mundy, L., McMullin, J., Hezel, T., & Keene, J. 1993, AJ, 106, 250
- Wolk et al. (2005) Wolk, S. J., Harnden, F. R., Flaccomio, E., Micela, G., Favata, F., Shang, H., & Feigelson, E. D. 2005, ApJS, 160, 423
- Zavagno et al. (2006) Zavagno, A., Deharveng, L., Comerón, F., Brand, J., Massi, F., Caplan, J., & Russeil, D. 2006, A&A, 446, 171
| Source | Position | Extracted Counts | Characteristics | ||||||||||||||||
|---|---|---|---|---|---|---|---|---|---|---|---|---|---|---|---|---|---|---|---|
| Seq | CXOU J | Net | Net | Bkgd | Net | PSF | Signif | Anomaa Source anomalies: g = fractional time that source was on a detector (FRACEXPO from mkarf) is ; e = source on field edge; p = source piled up; s = source on readout streak. | Varbb Source variability: a = no evidence for variability; b = possibly variable; c = definitely variable. No test is performed for sources with fewer than 4 total full-band counts. No value is reported for sources in chip gaps or on field edges. | EffExp | Med E | 2MASS | |||||||
| # | (deg) | (deg) | (′) | Full | Full | Full | Hard | Frac | (ks) | (keV) | |||||||||
| (1) | (2) | (3) | (4) | (5) | (6) | (7) | (8) | (9) | (10) | (11) | (12) | (13) | (14) | (15) | (16) | ||||
| 1 | 213926.70581240.2 | 324.861261 | 58.211189 | 10.30 | 93.6 | 10.6 | 8.4 | 18.1 | 0.91 | 8.4 | g… | 19.7 | 1.34 | 213926675812405 | |||||
| 2 | 213936.78581827.1 | 324.903254 | 58.307541 | 8.78 | 21.4 | 5.9 | 7.6 | 6.6 | 0.90 | 3.3 | …. | a | 22.5 | 1.47 | 213936805818272 | ||||
| 3 | 213940.32581319.2 | 324.918020 | 58.222026 | 8.39 | 23.4 | 5.9 | 5.6 | 14.1 | 0.90 | 3.6 | …. | a | 23.1 | 2.28 | |||||
| 4 | 213940.82581816.8 | 324.920110 | 58.304670 | 8.22 | 61.1 | 8.7 | 4.9 | 28.1 | 0.90 | 6.7 | g… | 22.0 | 1.92 | ||||||
| 5 | 213943.92581326.0 | 324.933015 | 58.223893 | 7.91 | 8.4 | 4.2 | 4.6 | 10.0 | 0.90 | 1.8 | …. | a | 23.5 | 4.52 | |||||
| 6 | 213944.54581443.9 | 324.935613 | 58.245555 | 7.51 | 55.3 | 8.1 | 1.7 | 11.9 | 0.78 | 6.4 | …. | a | 24.2 | 1.28 | 213944435814438 | ||||
| 7 | 213945.07581450.5 | 324.937818 | 58.247380 | 7.42 | 501.1 | 23.0 | 2.9 | 138.1 | 0.89 | 21.3 | …. | a | 24.3 | 1.53 | 213945045814504 | ||||
| 8 | 213945.63581616.8 | 324.940141 | 58.271361 | 7.27 | 9.1 | 4.0 | 2.9 | 2.0 | 0.89 | 2.0 | …. | b | 24.2 | 1.74 | 213945555816172 | ||||
| 9 | 213948.64582030.3 | 324.952706 | 58.341754 | 8.22 | 7.7 | 4.0 | 4.3 | 4.6 | 0.90 | 1.7 | …. | a | 23.8 | 2.26 | |||||
| 10 | 213949.34581616.5 | 324.955584 | 58.271271 | 6.78 | 17.6 | 5.0 | 2.4 | 11.2 | 0.89 | 3.2 | …. | a | 25.1 | 2.34 | |||||
| 11 | 213950.12581149.9 | 324.958850 | 58.197203 | 7.86 | 30.2 | 6.4 | 3.8 | 9.7 | 0.90 | 4.4 | …. | c | 22.1 | 1.48 | 213950015811503 | ||||
| 12 | 213951.69581112.5 | 324.965407 | 58.186833 | 8.04 | 17.4 | 5.1 | 3.6 | 0.0 | 0.89 | 3.1 | …. | a | 23.1 | 1.38 | |||||
| 13 | 213952.85582003.6 | 324.970226 | 58.334339 | 7.51 | 12.1 | 4.5 | 3.9 | 7.5 | 0.90 | 2.4 | …. | a | 24.7 | 2.46 | 213952685820047 | ||||
| 14 | 213953.43582031.6 | 324.972640 | 58.342138 | 7.72 | 10.5 | 4.3 | 3.5 | 7.6 | 0.90 | 2.2 | …. | a | 24.4 | 2.83 | 213953245820323 | ||||
| 15 | 213953.81581240.6 | 324.974214 | 58.211304 | 7.01 | 15.8 | 4.8 | 2.2 | 7.7 | 0.89 | 3.0 | …. | a | 22.9 | 2.50 | |||||
| 16 | 213954.64581618.5 | 324.977675 | 58.271818 | 6.09 | 171.3 | 13.7 | 1.7 | 27.9 | 0.90 | 12.1 | …. | a | 25.8 | 1.32 | 213954595816185 | ||||
| 17 | 213954.84581200.6 | 324.978520 | 58.200188 | 7.24 | 13.1 | 4.5 | 2.9 | 2.2 | 0.90 | 2.6 | …. | a | 24.2 | 1.28 | 213954805812009 | ||||
| 18 | 213956.40581347.4 | 324.985029 | 58.229838 | 6.24 | 207.4 | 15.0 | 1.6 | 61.9 | 0.90 | 13.4 | …. | a | 24.0 | 1.61 | 213956355813475 | ||||
| 19 | 213956.55581113.3 | 324.985637 | 58.187052 | 7.52 | 105.2 | 10.9 | 2.8 | 27.0 | 0.90 | 9.2 | …. | a | 23.7 | 1.50 | 213956515811136 | ||||
| 20 | 213958.46581214.8 | 324.993605 | 58.204115 | 6.71 | 76.9 | 9.4 | 2.1 | 21.5 | 0.89 | 7.7 | …. | a | 24.8 | 1.53 | 213958445812147 | ||||
| 21 | 214002.10581116.1 | 325.008751 | 58.187825 | 6.94 | 19.0 | 5.1 | 2.0 | 3.4 | 0.90 | 3.3 | …. | a | 23.4 | 1.29 | 214002175811164 | ||||
| 22 | 214002.44581224.3 | 325.010206 | 58.206756 | 6.19 | 10.3 | 4.0 | 1.7 | 0.7 | 0.90 | 2.2 | …. | a | 25.2 | 0.96 | 214002445812237 | ||||
| 23 | 214002.62581035.7 | 325.010947 | 58.176585 | 7.37 | 6.6 | 3.5 | 2.4 | 4.4 | 0.89 | 1.6 | …. | b | 23.7 | 2.18 | |||||
| 24 | 214002.93581509.7 | 325.012247 | 58.252722 | 5.05 | 5.5 | 3.0 | 0.5 | 0.6 | 0.89 | 1.5 | …. | a | 24.6 | 1.06 | 214002985815097 | ||||
| 25 | 214003.75581149.0 | 325.015636 | 58.196964 | 6.41 | 5.6 | 3.2 | 1.4 | 2.0 | 0.90 | 1.5 | …. | a | 24.0 | 1.30 | 214003565811478 | ||||
| 26 | 214004.12581456.6 | 325.017202 | 58.249077 | 4.94 | 5.4 | 3.0 | 0.6 | 4.6 | 0.90 | 1.5 | …. | a | 26.9 | 5.82 | |||||
| 27 | 214006.06581757.1 | 325.025262 | 58.299214 | 4.98 | 5.5 | 3.0 | 0.5 | 2.7 | 0.90 | 1.5 | g… | 18.8 | 3.07 | ||||||
| 28 | 214006.31581823.4 | 325.026314 | 58.306511 | 5.14 | 9.2 | 3.7 | 0.8 | 2.5 | 0.89 | 2.2 | …. | a | 24.6 | 1.55 | 214006335818233 | ||||
| 29 | 214009.00581409.6 | 325.037513 | 58.236007 | 4.57 | 5.4 | 3.0 | 0.6 | 0.0 | 0.89 | 1.5 | …. | a | 27.1 | 1.06 | 214009095814094 | ||||
| 30 | 214010.19581640.7 | 325.042494 | 58.277992 | 4.09 | 25.5 | 5.6 | 0.5 | 5.7 | 0.90 | 4.1 | …. | a | 27.8 | 1.31 | 214010125816406 | ||||
| 31 | 214010.32580900.1 | 325.043019 | 58.150038 | 8.05 | 37.5 | 6.8 | 2.5 | 10.3 | 0.89 | 5.1 | g… | 17.3 | 1.51 | 214010315809002 | |||||
| 32 | 214010.46581701.9 | 325.043596 | 58.283865 | 4.13 | 31.6 | 6.2 | 0.4 | 23.7 | 0.90 | 4.7 | …. | a | 27.8 | 3.69 | |||||
| 33 | 214010.52580926.9 | 325.043838 | 58.157480 | 7.65 | 48.1 | 7.7 | 2.9 | 7.0 | 0.90 | 5.9 | …. | a | 22.6 | 1.35 | 214010565809270 | ||||
| 34 | 214012.27581349.2 | 325.051148 | 58.230345 | 4.33 | 3.5 | 2.5 | 0.5 | 0.7 | 0.89 | 1.1 | …. | a | 27.2 | 1.70 | 214012255813495 | ||||
| 35 | 214015.29582156.5 | 325.063726 | 58.365707 | 6.85 | 10.1 | 4.0 | 1.9 | 9.7 | 0.89 | 2.2 | …. | a | 23.3 | 3.45 | |||||
| 36 | 214016.08581522.2 | 325.067002 | 58.256174 | 3.31 | 11.7 | 4.0 | 0.3 | 8.8 | 0.90 | 2.6 | …. | a | 26.9 | 3.28 | |||||
| 37 | 214016.24581208.0 | 325.067700 | 58.202240 | 5.02 | 5.2 | 3.0 | 0.8 | 0.4 | 0.89 | 1.4 | …. | a | 26.1 | 1.47 | |||||
| 38 | 214017.35581321.7 | 325.072300 | 58.222706 | 4.05 | 12.6 | 4.1 | 0.4 | 0.8 | 0.89 | 2.7 | …. | a | 27.2 | 1.12 | 214017285813217 | ||||
| 39 | 214020.37581323.5 | 325.084890 | 58.223211 | 3.73 | 5.7 | 3.0 | 0.3 | 1.8 | 0.89 | 1.6 | …. | c | 27.5 | 1.25 | 214020345813235 | ||||
| 40 | 214026.88582230.1 | 325.112009 | 58.375036 | 6.78 | 8.2 | 3.7 | 1.8 | 2.6 | 0.89 | 1.9 | …. | a | 25.1 | 1.32 | |||||
| 41 | 214027.31581421.1 | 325.113817 | 58.239215 | 2.41 | 10.8 | 3.8 | 0.2 | 3.9 | 0.90 | 2.4 | …. | a | 28.4 | 1.47 | 214027325814212 | ||||
| 42 | 214028.19581905.7 | 325.117497 | 58.318272 | 3.54 | 4.7 | 2.8 | 0.3 | 3.8 | 0.89 | 1.4 | …. | a | 27.1 | 3.35 | |||||
| 43 | 214028.65582255.6 | 325.119388 | 58.382120 | 7.14 | 5.8 | 3.4 | 2.2 | 0.0 | 0.90 | 1.5 | …. | a | 24.6 | 1.07 | 214028565822556 | ||||
| 44 | 214028.66582157.2 | 325.119440 | 58.365905 | 6.19 | 26.8 | 5.8 | 1.2 | 7.1 | 0.90 | 4.2 | g… | 23.9 | 1.09 | 214028655821574 | |||||
| 45 | 214028.71582011.6 | 325.119664 | 58.336568 | 4.51 | 45.6 | 7.3 | 0.4 | 10.7 | 0.89 | 5.8 | …. | a | 25.8 | 1.44 | 214028715820115 | ||||
| 46 | 214028.80581754.6 | 325.120028 | 58.298506 | 2.50 | 5.8 | 3.0 | 0.2 | 5.8 | 0.89 | 1.6 | …. | a | 29.2 | 4.84 | |||||
| 47 | 214029.69581645.9 | 325.123746 | 58.279437 | 1.67 | 5.9 | 3.0 | 0.1 | 4.9 | 0.89 | 1.6 | …. | a | 29.3 | 3.10 | |||||
| 48 | 214030.21580935.5 | 325.125915 | 58.159880 | 6.53 | 292.4 | 17.7 | 1.6 | 73.0 | 0.89 | 16.1 | …. | a | 24.8 | 1.45 | 214030175809353 | ||||
| 49 | 214031.58581755.2 | 325.131589 | 58.298668 | 2.30 | 26.8 | 5.7 | 0.2 | 6.8 | 0.89 | 4.3 | …. | a | 29.3 | 1.61 | 214031595817551 | ||||
| 50 | 214032.87581744.2 | 325.136960 | 58.295635 | 2.05 | 21.8 | 5.2 | 0.2 | 16.9 | 0.89 | 3.8 | …. | a | 29.4 | 3.34 | |||||
| 51 | 214035.42581230.9 | 325.147607 | 58.208591 | 3.53 | 75.8 | 9.2 | 0.2 | 17.8 | 0.89 | 7.8 | …. | a | 25.1 | 1.50 | 214035385812308 | ||||
| 52 | 214035.64582435.4 | 325.148519 | 58.409857 | 8.65 | 17.3 | 5.1 | 3.7 | 8.4 | 0.90 | 3.1 | g… | 21.7 | 1.89 | ||||||
| 53 | 214036.57581345.8 | 325.152388 | 58.229404 | 2.28 | 28.8 | 5.9 | 0.2 | 8.9 | 0.90 | 4.5 | …. | a | 28.7 | 1.45 | 214036555813458 | ||||
| 54 | 214036.59581133.0 | 325.152461 | 58.192524 | 4.46 | 36.4 | 6.6 | 0.6 | 11.6 | 0.89 | 5.1 | …. | a | 27.0 | 1.45 | 214036595811330 | ||||
| 55 | 214036.90581437.9 | 325.153771 | 58.243884 | 1.44 | 10.8 | 3.8 | 0.2 | 1.9 | 0.90 | 2.4 | …. | a | 29.4 | 1.41 | 214036915814378 | ||||
| 56 | 214038.36580726.9 | 325.159836 | 58.124158 | 8.53 | 25.9 | 5.9 | 3.1 | 3.9 | 0.90 | 4.0 | …. | a | 20.7 | 1.42 | 214038275807266 | ||||
| 57 | 214038.86581922.4 | 325.161934 | 58.322913 | 3.41 | 4.7 | 2.8 | 0.3 | 4.8 | 0.90 | 1.4 | …. | a | 28.0 | 3.04 | |||||
| 58 | 214038.98581413.9 | 325.162446 | 58.237204 | 1.76 | 19.9 | 5.0 | 0.1 | 17.9 | 0.90 | 3.6 | g… | 23.4 | 3.48 | ||||||
| 59 | 214039.17580815.6 | 325.163241 | 58.137689 | 7.72 | 15.3 | 4.8 | 2.7 | 10.0 | 0.90 | 2.9 | g… | 21.9 | 3.47 | ||||||
| 60 | 214039.62581609.3 | 325.165107 | 58.269272 | 0.24 | 26.9 | 5.7 | 0.1 | 26.9 | 0.90 | 4.3 | …. | a | 29.5 | 4.62 | |||||
| 61 | 214039.87581834.8 | 325.166135 | 58.309685 | 2.61 | 113.9 | 11.2 | 0.1 | 94.9 | 0.89 | 9.7 | …. | c | 26.6 | 3.54 | 214039885818349 | ||||
| 62 | 214041.12581359.0 | 325.171337 | 58.233060 | 1.99 | 71.8 | 9.0 | 0.2 | 14.9 | 0.90 | 7.5 | …. | a | 27.4 | 1.45 | 214041105813588 | ||||
| 63 | 214041.16581511.2 | 325.171534 | 58.253134 | 0.79 | 46.9 | 7.4 | 0.1 | 29.9 | 0.90 | 5.9 | …. | a | 29.4 | 2.42 | 214041165815112 | ||||
| 64 | 214041.18581201.4 | 325.171594 | 58.200406 | 3.95 | 6.6 | 3.2 | 0.4 | 0.0 | 0.89 | 1.7 | …. | a | 26.3 | 1.03 | 214041155812013 | ||||
| 65 | 214041.56581425.5 | 325.173203 | 58.240442 | 1.55 | 8.9 | 3.5 | 0.1 | 2.9 | 0.90 | 2.2 | g… | 21.6 | 1.76 | 214041565814255 | |||||
| 66 | 214041.81581612.3 | 325.174232 | 58.270097 | 0.26 | 7.9 | 3.4 | 0.1 | 7.9 | 0.90 | 2.0 | …. | a | 29.4 | 5.99 | |||||
| 67 | 214041.91581523.1 | 325.174664 | 58.256436 | 0.60 | 14.9 | 4.4 | 0.1 | 7.9 | 0.90 | 3.0 | …. | a | 26.7 | 2.28 | 214041915815230 | ||||
| 68 | 214042.89581601.0 | 325.178727 | 58.266953 | 0.27 | 4.9 | 2.8 | 0.1 | 3.9 | 0.90 | 1.4 | …. | a | 29.3 | 5.61 | |||||
| 69 | 214043.47581227.2 | 325.181136 | 58.207582 | 3.54 | 3.7 | 2.5 | 0.3 | 3.8 | 0.90 | 1.2 | …. | a | 26.7 | 5.10 | |||||
| 70 | 214043.47581559.7 | 325.181139 | 58.266605 | 0.34 | 25.9 | 5.6 | 0.1 | 22.9 | 0.90 | 4.2 | …. | c | 29.3 | 3.28 | |||||
| 71 | 214043.64581618.9 | 325.181852 | 58.271932 | 0.50 | 8.9 | 3.5 | 0.1 | 6.9 | 0.90 | 2.1 | …. | a | 29.3 | 3.85 | 214043655816190 | ||||
| 72 | 214044.34581513.3 | 325.184770 | 58.253699 | 0.88 | 3.9 | 2.5 | 0.1 | 1.9 | 0.90 | 1.2 | g… | 21.8 | 1.39 | 214044335815133 | |||||
| 73 | 214044.84581605.1 | 325.186858 | 58.268109 | 0.54 | 15.9 | 4.5 | 0.1 | 9.9 | 0.90 | 3.1 | …. | a | 29.3 | 2.20 | 214044855816050 | ||||
| 74 | 214044.85581503.4 | 325.186883 | 58.250963 | 1.06 | 39.9 | 6.8 | 0.1 | 11.9 | 0.90 | 5.4 | …. | a | 27.5 | 1.61 | 214044855815033 | ||||
| 75 | 214045.15581950.5 | 325.188148 | 58.330706 | 3.91 | 32.7 | 6.3 | 0.3 | 21.8 | 0.90 | 4.8 | …. | a | 25.9 | 2.45 | 214045175819506 | ||||
| 76 | 214045.18581559.8 | 325.188264 | 58.266616 | 0.57 | 52.9 | 7.8 | 0.1 | 52.9 | 0.90 | 6.3 | …. | c | 29.2 | 4.23 | |||||
| 77 | 214045.51581511.4 | 325.189651 | 58.253167 | 0.99 | 6.9 | 3.2 | 0.1 | 1.9 | 0.90 | 1.8 | g… | 22.9 | 1.74 | 214045515815115 | |||||
| 78 | 214045.53581602.9 | 325.189715 | 58.267478 | 0.62 | 9.9 | 3.7 | 0.1 | 4.9 | 0.90 | 2.3 | …. | a | 29.2 | 1.91 | 214045535816027 | ||||
| 79 | 214045.55580846.9 | 325.189810 | 58.146366 | 7.22 | 3.5 | 3.0 | 2.5 | 2.2 | 0.90 | 1.0 | …. | a | 23.5 | 5.13 | |||||
| 80 | 214045.79581549.0 | 325.190799 | 58.263625 | 0.67 | 10.9 | 3.8 | 0.1 | 9.9 | 0.90 | 2.5 | …. | a | 29.2 | 4.33 | |||||
| 81 | 214046.49581523.2 | 325.193746 | 58.256468 | 0.94 | 11.9 | 4.0 | 0.1 | 4.0 | 0.90 | 2.6 | g… | 11.9 | 1.57 | 214046495815230 | |||||
| 82 | 214046.89581533.3 | 325.195375 | 58.259270 | 0.90 | 3.9 | 2.5 | 0.1 | 0.0 | 0.90 | 1.2 | g… | 22.0 | 1.42 | 214046885815334 | |||||
| 83 | 214047.34582025.5 | 325.197279 | 58.340424 | 4.53 | 5.4 | 3.0 | 0.6 | 4.6 | 0.90 | 1.5 | …. | a | 25.2 | 5.18 | |||||
| 84 | 214047.63581132.7 | 325.198482 | 58.192424 | 4.52 | 209.5 | 15.0 | 0.5 | 158.7 | 0.89 | 13.5 | …. | b | 26.8 | 2.85 | 214047625811328 | ||||
| 85 | 214048.03581537.9 | 325.200164 | 58.260540 | 1.00 | 25.9 | 5.6 | 0.1 | 10.9 | 0.90 | 4.2 | …. | a | 29.0 | 1.34 | 214048035815376 | ||||
| 86 | 214048.20581746.0 | 325.200840 | 58.296123 | 2.04 | 29.9 | 6.0 | 0.1 | 28.9 | 0.89 | 4.6 | …. | a | 28.9 | 4.10 | |||||
| 87 | 214049.09581709.3 | 325.204549 | 58.285934 | 1.60 | 17.9 | 4.8 | 0.1 | 8.9 | 0.89 | 3.4 | …. | a | 28.9 | 1.93 | 214049085817093 | ||||
| 88 | 214049.28582055.3 | 325.205362 | 58.348701 | 5.07 | 4.3 | 2.8 | 0.7 | 1.5 | 0.89 | 1.3 | …. | a | 24.2 | 1.89 | |||||
| 89 | 214050.33580809.6 | 325.209729 | 58.136021 | 7.91 | 10.1 | 4.1 | 2.9 | 4.8 | 0.90 | 2.1 | …. | a | 21.1 | 2.29 | |||||
| 90 | 214054.64581204.7 | 325.227680 | 58.201322 | 4.30 | 12.5 | 4.1 | 0.5 | 8.7 | 0.89 | 2.7 | …. | b | 26.7 | 2.31 | |||||
| 91 | 214055.43582051.7 | 325.230998 | 58.347704 | 5.25 | 62.1 | 8.4 | 0.9 | 45.4 | 0.90 | 6.9 | …. | b | 26.3 | 3.01 | |||||
| 92 | 214056.46580604.2 | 325.235256 | 58.101172 | 10.11 | 7.5 | 4.6 | 8.5 | 0.2 | 0.90 | 1.4 | g… | 19.1 | 1.55 | 214056435806037 | |||||
| 93 | 214057.24582149.6 | 325.238504 | 58.363801 | 6.24 | 9.1 | 3.7 | 0.9 | 4.4 | 0.90 | 2.1 | g… | 15.4 | 1.98 | ||||||
| 94 | 214059.72581954.7 | 325.248856 | 58.331876 | 4.65 | 7.4 | 3.4 | 0.6 | 4.6 | 0.91 | 1.9 | …. | a | 26.7 | 3.53 | |||||
| 95 | 214104.27581130.7 | 325.267823 | 58.191885 | 5.42 | 6.1 | 3.2 | 0.9 | 4.4 | 0.91 | 1.6 | …. | a | 25.5 | 3.22 | |||||
| 96 | 214104.85582025.2 | 325.270247 | 58.340351 | 5.45 | 43.0 | 7.1 | 1.0 | 27.3 | 0.90 | 5.6 | …. | a | 25.9 | 2.33 | |||||
| 97 | 214105.61581049.2 | 325.273405 | 58.180335 | 6.10 | 60.9 | 8.4 | 1.1 | 47.2 | 0.90 | 6.8 | g… | 20.7 | 3.51 | ||||||
| 98 | 214106.39581630.3 | 325.276634 | 58.275103 | 3.40 | 8.7 | 3.5 | 0.3 | 1.8 | 0.90 | 2.1 | …. | a | 27.3 | 1.82 | 214106365816305 | ||||
| 99 | 214106.76580646.9 | 325.278188 | 58.113054 | 9.80 | 50.1 | 8.0 | 5.9 | 8.9 | 0.90 | 5.9 | …. | a | 20.0 | 1.44 | 214106695806459 | ||||
| 100 | 214108.44581635.6 | 325.285194 | 58.276570 | 3.68 | 5.7 | 3.0 | 0.3 | 0.0 | 0.90 | 1.6 | …. | a | 27.1 | 1.45 | 214108405816356 | ||||
| 101 | 214109.10581049.9 | 325.287955 | 58.180543 | 6.35 | 136.5 | 12.3 | 1.5 | 35.9 | 0.90 | 10.7 | …. | c | 24.4 | 1.63 | 214109095810495 | ||||
| 102 | 214110.96581622.9 | 325.295679 | 58.273051 | 3.98 | 9.6 | 3.7 | 0.4 | 8.7 | 0.90 | 2.2 | …. | a | 26.8 | 3.00 | 214111145816240 | ||||
| 103 | 214113.93582002.0 | 325.308067 | 58.333905 | 5.95 | 10.9 | 4.0 | 1.1 | 10.1 | 0.90 | 2.4 | …. | a | 25.2 | 3.72 | |||||
| 104 | 214114.63581503.0 | 325.310980 | 58.250850 | 4.54 | 30.5 | 6.1 | 0.5 | 13.6 | 0.89 | 4.6 | …. | a | 26.1 | 1.69 | |||||
| 105 | 214115.06580652.0 | 325.312787 | 58.114467 | 10.16 | 9.7 | 4.3 | 4.3 | 2.0 | 0.93 | 2.0 | g… | 9.5 | 1.22 | 214115145806520 | |||||
| 106 | 214115.64581933.5 | 325.315208 | 58.325980 | 5.81 | 16.9 | 4.8 | 1.1 | 10.2 | 0.90 | 3.2 | …. | a | 25.3 | 2.34 | |||||
| 107 | 214115.87581453.6 | 325.316126 | 58.248235 | 4.73 | 32.4 | 6.3 | 0.6 | 1.6 | 0.89 | 4.8 | …. | a | 25.9 | 1.01 | 214115865814537 | ||||
| 108 | 214116.28581546.2 | 325.317836 | 58.262855 | 4.66 | 11.5 | 4.0 | 0.5 | 2.6 | 0.89 | 2.5 | …. | c | 26.0 | 1.28 | |||||
| 109 | 214117.17581743.4 | 325.321560 | 58.295408 | 5.08 | 8.3 | 3.5 | 0.7 | 4.5 | 0.90 | 2.0 | …. | a | 24.7 | 3.41 | |||||
| 110 | 214120.48581641.2 | 325.335352 | 58.278119 | 5.26 | 8.9 | 3.7 | 1.1 | 3.2 | 0.90 | 2.1 | …. | a | 25.5 | 1.73 | |||||
| 111 | 214122.22581823.9 | 325.342617 | 58.306641 | 5.95 | 466.9 | 22.1 | 1.1 | 162.2 | 0.90 | 20.6 | g… | 20.9 | 1.61 | 214122205818238 | |||||
| 112 | 214123.52581536.6 | 325.348041 | 58.260183 | 5.62 | 42.0 | 7.1 | 1.0 | 7.3 | 0.90 | 5.5 | …. | a | 25.0 | 1.42 | 214123525815371 | ||||
| 113 | 214132.38581303.5 | 325.384949 | 58.217662 | 7.38 | 27.3 | 6.1 | 3.7 | 16.2 | 0.90 | 4.1 | …. | a | 22.8 | 2.47 | |||||
| 114 | 214135.79581920.5 | 325.399130 | 58.322373 | 7.97 | 5.4 | 3.6 | 3.6 | 0.7 | 0.89 | 1.3 | …. | a | 22.5 | 1.64 | 214135605819193 | ||||
| 115 | 214135.81581826.3 | 325.399239 | 58.307314 | 7.63 | 9.8 | 4.1 | 3.2 | 4.9 | 0.90 | 2.1 | …. | a | 22.8 | 2.15 | |||||
| 116 | 214138.03581759.5 | 325.408471 | 58.299869 | 7.78 | 14.8 | 4.8 | 3.2 | 1.8 | 0.89 | 2.8 | …. | a | 22.6 | 1.25 | 214138125817599 | ||||
| 117 | 214148.52581915.6 | 325.452181 | 58.321006 | 9.48 | 10.5 | 4.8 | 7.5 | 4.8 | 0.89 | 1.9 | …. | a | 20.5 | 1.89 | |||||
Note. — Column 1: X-ray source number. Column 2: IAU designation. Columns 3-4: Right ascension and declination for epoch J2000.0 in degrees. Column 5: Off-axis angle. Columns 6-7: Estimated net counts from extracted area in total energy band keV and their 1 errors. Column 8: Estimated background counts from extracted area in total energy band. Column 9: Estimated net counts from extracted area in hard energy band keV. Column 10: Fraction of the PSF at the fiducial energy of 1.497 keV enclosed within the extracted area. Note that a reduced PSF fraction (significantly below 90%) may indicate that the source is in a crowded region or on the edge of the field. Column 11: Source significance in sigma. Column 12. Source anomalies described by a set of flags, see the text notea below for details. Column 13: Variability characterization based on K-S statistics, see the text noteb below for details. Column 14: Source effective exposure in ks. Column 15: The background-corrected median photon energy in the total keV energy band. Column 16: 2MASS counterpart.
| Source | NIR | MIR | ||||||||||||||
|---|---|---|---|---|---|---|---|---|---|---|---|---|---|---|---|---|
| Seq | CXOU J | 2MASS | Offset | Flag | Nisini | Offset | [3.6] | [4.5] | [5.8] | Class | ||||||
| # | mag | mag | mag | # | mag | mag | mag | mag | ||||||||
| (1) | (2) | (3) | (4) | (5) | (6) | (7) | (8) | (9) | (10) | (11) | (12) | (13) | (14) | (15) | ||
| 41 | 214027.31+581421.1 | 21402732+5814212 | 0.07 | 14.30 | 13.30 | 12.88 | AAA000 | 0.53 | 11.62 | 11.09 | 10.74 | II | ||||
| 49 | 214031.58+581755.2 | 21403159+5817551 | 0.13 | 14.03 | 12.89 | 12.39 | AAA000 | 0.26 | 11.51 | 11.16 | 10.23 | II | ||||
| 53 | 214036.57+581345.8 | 21403655+5813458 | 0.13 | 13.51 | 12.58 | 12.24 | AAA000 | 0.67 | 12.13 | 11.94 | 12.01 | III | ||||
| 55 | 214036.90+581437.9 | 21403691+5814378 | 0.14 | 11.90 | 10.89 | 10.23 | AAA000 | 0.56 | 9.38 | 9.10 | 8.76 | II | ||||
| 60 | 214039.62+581609.3 | 2 | 15.14 | 0.78 | 11.29 | 9.42 | 8.31 | IaaThe X-ray source #60 is offset by 3.2 to the north of the radio continuum source VLA 1, and by 5.0 to the northwest of the millimeter source BIMA 1 of Beltrán et al. (2002). | ||||||||
| 61 | 214039.87+581834.8 | 21403988+5818349 | 0.13 | 15.30 | 13.36 | UBA000 | 3 | 13.19 | 0.77 | 11.63 | 10.95 | 10.21 | II | |||
| 62 | 214041.12+581359.0 | 21404110+5813588 | 0.20 | 12.96 | 12.08 | 11.77 | AAA000 | 0.51 | 11.61 | 11.72 | 11.49 | III | ||||
| 63 | 214041.16+581511.2 | 21404116+5815112 | 0.06 | 12.97 | 11.61 | 10.68 | AAA000 | 0.42 | 9.15 | 8.61 | 8.05 | II | ||||
| 65 | 214041.56+581425.5 | 21404156+5814255 | 0.05 | 13.65 | 12.62 | 12.17 | AAA000 | 0.69 | 11.40 | 11.20 | 10.68 | II | ||||
| 66 | 214041.81+581612.3 | 1.11 | 11.30 | 8.90 | 7.50 | 0/IbbThe X-ray source #66 is within 0.5 of the radio continuum source VLA 2 and millimeter source BIMA 2 of Beltrán et al. (2002). This is also millimeter source A of Codella et al. (2001). | ||||||||||
| 67 | 214041.91+581523.1 | 21404191+5815230 | 0.15 | 15.68 | 14.30 | 13.65 | AAA000 | 0.19 | 12.69 | 12.49 | II | |||||
| 68 | 214042.89+581601.0 | 0.63 | 10.60 | 8.78 | 7.60 | IccThe X-ray source #68 is within 1.0 of the radio continuum source VLA 3 and millimeter source BIMA 3 of Beltrán et al. (2002). This is also millimeter source B of Codella et al. (2001). | ||||||||||
| 70 | 214043.47+581559.7 | 1.01 | 12.89 | 11.95 | I/II | |||||||||||
| 71 | 214043.64+581618.9 | 21404365+5816190 | 0.11 | 17.89 | 16.09 | 13.51 | UUA000 | 10 | 13.36 | 0.67 | 9.97 | 8.72 | 8.00 | I | ||
| 72 | 214044.34+581513.3 | 21404433+5815133 | 0.09 | 16.05 | 14.59 | 13.60 | AAA000 | 0.56 | 12.42 | 11.64 | 10.60 | II | ||||
| 73 | 214044.84+581605.1 | 21404485+5816050 | 0.19 | 15.85 | 14.28 | 12.89 | UAA000 | 11 | 12.77 | 0.27 | 11.73 | 11.15 | 10.68 | II | ||
| 74 | 214044.85+581503.4 | 21404485+5815033 | 0.13 | 14.62 | 13.35 | 12.66 | AAA000 | 0.56 | 12.29 | 11.40 | 10.96 | II | ||||
| 76 | 214045.18+581559.8 | 0.71 | 11.95 | 10.82 | 10.03 | I | ||||||||||
| 77 | 214045.51+581511.4 | 21404551+5815115 | 0.16 | 14.65 | 13.71 | 13.11 | AAA000 | 0.58 | 12.54 | 12.21 | 11.82 | II | ||||
| 78 | 214045.53+581602.9 | 21404553+5816027 | 0.19 | 15.68 | 13.73 | 12.85 | AAA000 | 1.09 | 12.23 | 11.84 | II | |||||
| 80 | 214045.79+581549.0 | 0.51 | 12.59 | 11.19 | 10.04 | I | ||||||||||
| 81 | 214046.49+581523.2 | 21404649+5815230 | 0.21 | 12.81 | 11.95 | 11.65 | AAA000 | 0.81 | 11.37 | 11.33 | 11.39 | III | ||||
| 82 | 214046.89+581533.3 | 21404688+5815334 | 0.07 | 15.30 | 13.55 | 12.63 | AAA000 | 0.53 | 11.97 | 11.80 | 11.15 | II | ||||
| 85 | 214048.03+581537.9 | 21404803+5815376 | 0.25 | 13.89 | 12.95 | 12.67 | AAA000 | 0.78 | 12.08 | 11.91 | 10.77 | II | ||||
| 87 | 214049.09+581709.3 | 21404908+5817093 | 0.04 | 14.14 | 12.86 | 12.13 | AAA000 | 0.42 | 10.77 | 10.19 | 9.69 | II | ||||
Note. — Column 1: X-ray source number. Column 2: IAU designation. Columns 3: 2MASS name. Column 4: 2MASS positional offset. Columns 5-7: 2MASS magnitudes. Column 8: 2MASS photometry quality and confusion-contamination flag. Column 9-10: NIR identifier and band magnitude from Nisini et al. (2001). Column 11: positional offset. Columns 12-14: [3.6], [4.5], and [5.8] magnitudes and their formal statistical errors. Column 15: Suggested PMS class based on a presence of NIR counterpart and positions on color-color NIR-MIR diagrams (Figure 4).
| NIR Nisini01 | ||||||||||||||
|---|---|---|---|---|---|---|---|---|---|---|---|---|---|---|
| Seq | Seq | Flag | [3.6] | [4.5] | ||||||||||
| #NIR | deg | deg | mag | # | mag | mag | mag | mag | mag | |||||
| (1) | (2) | (3) | (4) | (5) | (6) | (7) | (8) | (9) | (10) | (11) | (12) | |||
| 1 | 325.162790 | 58.293791 | 15.81 | 14.62 | 14.63 | |||||||||
| 2 | 325.165100 | 58.269072 | 15.14 | 60 | 11.29 | 9.42 | ||||||||
| 3 | 325.166183 | 58.309711 | 13.19 | 61 | 21403988+5818349 | 18.29 | 15.30 | 13.36 | UBA000 | 11.63 | 10.95 | |||
| 4 | 325.168090 | 58.279117 | 15.88 | 15.20 | 13.99 | |||||||||
| 5 | 325.168616 | 58.307255 | 13.59 | 21404046+5818261 | 18.28 | 15.64 | 13.85 | UCA000 | 12.81 | 12.55 | ||||
| 6 | 325.170881 | 58.281258 | 13.87 | 21404101+5816525 | 17.93 | 15.34 | 13.93 | UBA000 | 13.30 | 13.20 | ||||
| 7 | 325.170842 | 58.270039 | 13.02 | 21404100+5816121 | 17.55 | 15.89 | 13.59 | UUA000 | 11.11 | 9.89 | ||||
| 8 | 325.172657 | 58.277168 | 12.28 | 21404143+5816378 | 18.30 | 15.60 | 12.78 | UBA000 | 9.56 | 8.28 | ||||
| 9 | 325.180710 | 58.287924 | 15.31 | 13.13 | 12.51 | |||||||||
| 10 | 325.181875 | 58.271961 | 13.36 | 71 | 21404365+5816190 | 17.89 | 16.09 | 13.51 | UUA000 | 9.97 | 8.72 | |||
| 11 | 325.186903 | 58.268063 | 12.77 | 73 | 21404485+5816050 | 15.85 | 14.28 | 12.89 | UAA000 | 11.73 | 11.15 | |||
| 12 | 325.190370 | 58.274338 | 14.61 | 21404737+5816372 | 17.07 | 16.13 | 14.63 | UDB000 | 13.80 | 12.99 | ||||
| 13 | 325.190970 | 58.261361 | 15.36 | 14.76 | 13.89 | |||||||||
| 14 | 325.196290 | 58.261592 | 15.04 | 14.14 | 13.99 | |||||||||
| 15 | 325.197120 | 58.283615 | 15.28 | 14.13 | 14.13 | |||||||||
| 16 | 325.197381 | 58.277023 | 14.50 | 21404737+5816372 | 17.08 | 16.13 | 14.63 | UDB000 | 13.67 | 13.32 | ||||
| 17 | 325.202541 | 58.266933 | 11.72 | 21404860+5816009 | 15.88 | 13.45 | 11.88 | AAA000 | 10.09 | 9.35 | ||||
| 18 | 325.230180 | 58.275707 | 15.81 | 15.10 | 15.26 | |||||||||
| 19 | 325.238759 | 58.278313 | 14.38 | 21405730+5816419 | 16.64 | 15.41 | 14.55 | UUB000 | 13.64 | 12.65 | ||||
| 20 | 325.116689 | 58.277267 | 14.92 | 21402800+5816381 | 15.89 | 15.03 | 12.35 | BCUcc0 | 12.32 | 12.52 | ||||
Note. — Column 1: Nisini et al. (2001) NIR source number. Columns 2-3: Right ascension and declination for epoch J2000.0 in degrees. Column 4: band magnitude from Nisini et al. (2001). Column 5: source number. Column 6: source. Columns 7-9: magnitudes. Column 10: photometry quality and confusion and contamination flag. Columns 11-12: [3.6], [4.5] magnitudes and their formal statistical errors.
| Source | X-ray Photometry | X-ray Spectra and Luminosities | ||||||||||||||||
|---|---|---|---|---|---|---|---|---|---|---|---|---|---|---|---|---|---|---|
| Seq | CXOU J | NetFull | NetFull | EffExp | PKS | MedE bbFor plotting purposes only, some quantities are reported to two decimal places. | ||||||||||||
| # | cnts | cnts | ks | keV | cm-2 | keV | erg s-1 | erg s-1 | erg s-1 | erg s-1 | erg s-1 | erg s-1 | erg s-1 | erg s-1 | ||||
| (1) | (2) | (3) | (4) | (5) | (6) | (7) | (8) | (9) | (10) | (11) | (12) | (13) | (14) | (15) | (16) | (17) | ||
| 41 | 214027.31+581421.1 | 10.8 | 3.8 | 28.4 | 0.895 | 1.47 | 21.61 | 1.74 | 29.16 | 0.19 | 28.86 | 0.34 | 29.39 | 0.28 | 28.89 | 0.36 | ||
| 49 | 214031.58+581755.2 | 26.8 | 5.7 | 29.3 | 0.207 | 1.61 | 21.74 | 1.67 | 29.51 | 0.13 | 29.24 | 0.20 | 29.80 | 0.20 | 29.28 | 0.20 | ||
| 53 | 214036.57+581345.8 | 28.8 | 5.9 | 28.7 | 0.440 | 1.45 | 21.31 | 2.24 | 29.41 | 0.12 | 29.12 | 0.19 | 29.53 | 0.15 | 29.13 | 0.19 | ||
| 55 | 214036.90+581437.9 | 10.8 | 3.8 | 29.4 | 0.076 | 1.41 | 21.84 | 1.00 | 29.19 | 0.19 | 28.71 | 0.35 | 29.71 | 0.29 | 28.77 | 0.35 | ||
| 60 | 214039.62+581609.3 | 26.9 | 5.7 | 29.5 | 0.728 | 4.62 | 22.87 | 4.60 | 30.01 | 0.13 | 30.01 | 0.20 | 30.52 | 0.58 | 30.27 | 0.29 | ||
| 61 | 214039.87+581834.8 | 113.9 | 11.2 | 26.6 | 0.000 | 3.54 | 22.41 | 30.62 | 0.07 | 30.60 | 0.09 | 30.86 | 0.24 | 30.69 | 0.11 | |||
| 62 | 214041.12+581359.0 | 71.8 | 9.0 | 27.4 | 0.362 | 1.45 | 21.33 | 2.16 | 30.12 | 0.09 | 29.82 | 0.14 | 30.25 | 0.12 | 29.84 | 0.14 | ||
| 63 | 214041.16+581511.2 | 46.9 | 7.4 | 29.4 | 0.854 | 2.42 | 22.38 | 1.95 | 30.18 | 0.08 | 30.11 | 0.10 | 30.72 | 0.32 | 30.27 | 0.21 | ||
| 65 | 214041.56+581425.5 | 8.9 | 3.5 | 21.6 | 0.716 | 1.76 | 21.54 | 4.33 | 29.36 | 0.21 | 29.22 | 0.42 | 29.49 | 0.37 | 29.23 | 0.42 | ||
| 66 | 214041.81+581612.3 | 7.9 | 3.4 | 29.4 | 0.122 | 5.99 | 23.98 | 2.39 | 29.84 | 0.29 | 29.84 | 0.30 | 31.69 | 0.72 | 31.31 | 0.43 | ||
| 67 | 214041.91+581523.1 | 14.9 | 4.4 | 26.7 | 0.629 | 2.28 | 22.05 | 2.34 | 29.33 | 0.15 | 29.21 | 0.16 | 29.66 | 0.44 | 29.27 | 0.24 | ||
| 68 | 214042.89+581601.0 | 4.9 | 2.8 | 29.3 | 0.567 | 5.61 | 23.93 | 2.46 | 29.61 | 0.33 | 29.61 | 0.34 | 31.35 | 0.81 | 30.98 | 0.48 | ||
| 70 | 214043.47+581559.7 | 25.9 | 5.6 | 29.3 | 0.003 | 3.28 | 22.80 | 2.32 | 29.89 | 0.16 | 29.88 | 0.17 | 30.58 | 0.53 | 30.19 | 0.31 | ||
| 71 | 214043.64+581618.9 | 8.9 | 3.5 | 29.3 | 0.885 | 3.85 | 22.69 | 2.50 | 29.53 | 0.27 | 29.51 | 0.28 | 30.13 | 0.68 | 29.76 | 0.40 | ||
| 72 | 214044.34+581513.3 | 3.9 | 2.5 | 21.8 | 0.849 | 1.39 | 22.10 | 0.84 | 28.85 | 0.28 | 28.45 | 0.57 | 29.70 | 0.41 | 28.57 | 0.57 | ||
| 73 | 214044.84+581605.1 | 15.9 | 4.5 | 29.3 | 0.266 | 2.20 | 22.28 | 1.93 | 29.54 | 0.16 | 29.45 | 0.18 | 30.03 | 0.45 | 29.58 | 0.25 | ||
| 74 | 214044.85+581503.4 | 39.9 | 6.8 | 27.5 | 0.336 | 1.61 | 21.90 | 1.95 | 29.89 | 0.11 | 29.70 | 0.16 | 30.21 | 0.18 | 29.76 | 0.17 | ||
| 76 | 214045.18+581559.8 | 52.9 | 7.8 | 29.2 | 0.001 | 4.23 | 23.19 | 2.55 | 30.46 | 0.11 | 30.46 | 0.16 | 31.36 | 0.54 | 30.99 | 0.27 | ||
| 77 | 214045.51+581511.4 | 6.9 | 3.2 | 22.9 | 0.795 | 1.74 | 21.56 | 0.55 | 28.82 | 0.24 | 27.62 | 0.48 | 29.30 | 0.42 | 27.66 | 0.48 | ||
| 78 | 214045.53+581602.9 | 9.9 | 3.7 | 29.2 | 0.875 | 1.91 | 22.28 | 1.19 | 28.92 | 0.27 | 28.75 | 0.58 | 29.67 | 0.39 | 28.91 | 0.58 | ||
| 80 | 214045.79+581549.0 | 10.9 | 3.8 | 29.2 | 0.547 | 4.33 | 22.69 | 2.26 | 29.34 | 0.19 | 29.33 | 0.29 | 29.99 | 0.72 | 29.59 | 0.36 | ||
| 81 | 214046.49+581523.2 | 11.9 | 4.0 | 11.9 | aaSource #81 lies on a chip gap. | 1.57 | 20.74 | 5.70 | 29.69 | 0.18 | 29.49 | 0.38 | 29.72 | 0.26 | 29.50 | 0.38 | ||
| 82 | 214046.89+581533.3 | 3.9 | 2.5 | 22.0 | 0.337 | 1.42 | 22.19 | 0.41 | 28.80 | 0.28 | 28.08 | 0.62 | 30.29 | 0.45 | 28.26 | 0.63 | ||
| 85 | 214048.03+581537.9 | 25.9 | 5.6 | 29.0 | 0.494 | 1.34 | 21.43 | 0.76 | 29.18 | 0.12 | 28.23 | 0.19 | 29.49 | 0.21 | 28.26 | 0.19 | ||
| 87 | 214049.09+581709.3 | 17.9 | 4.8 | 28.9 | 0.672 | 1.93 | 21.87 | 0.99 | 29.03 | 0.14 | 28.56 | 0.25 | 29.57 | 0.31 | 28.63 | 0.25 | ||
Note. — Column 1: X-ray source number. Column 2: IAU designation. Columns 3-4: Estimated net counts from extracted area in total energy band (0.5-8.0) keV and their 1 errors. Column 5: Source’s effective exposure. Column 6: Probability of accepting the null hypothesis of a constant source from the nonparametric one-sample Kolmogorov-Smirnov test. Column 7: The background-corrected median photon energy in the total energy band. Column 8: Estimated column density. Italic font indicates that a column density parameter was fixed at the value corresponding to a visual absorption, derived from NIR color-magnitude diagram, and the relationship (Ryter, 1996) was applied. Column 9: Estimated plasma temperature. Columns 10-17: Observed and corrected for absorption X-ray luminosities, obtained from our spectral analysis, and their errors estimated from simulations. hard band keV, total band keV, corrected for absorption.
| IR/Submm | X-ray | |||||||||
|---|---|---|---|---|---|---|---|---|---|---|
| Name | Class | Ref | Obs | Exp | Det? | Ref | ||||
| (pc) | () | () | ks | |||||||
| (1) | (2) | (3) | (4) | (5) | (6) | (7) | 8) | (9) | (10) | |
| (a) Very Young Protostars Observed in X-rays | ||||||||||
| L1448 NW | 300 | 1.2 | 0 | 1 | CXO | 68 | N | 13 | ||
| IRS 3B | 300 | 0.5 | 0/1 | 2 | CXO | 68 | N | 13 | ||
| IRS 3A | 300 | 0.15 | 1 | 2 | CXO | 68 | Y? | 13 | ||
| L1448 C | 300 | 8.3 | 1.1 | 0 | 1 | CXO | 68 | N | 13 | |
| IRAS 03256+3055 | 320 | 1 | 0.34 | 0 | 1 | XMM | 235 | N | 14 | |
| NGC 1333 I2 | 320 | 43 | 1.5 | 0 | 1 | CXO | 38 | N | 15 | |
| XMM | 235 | N | 14 | |||||||
| NGC 1333 I4 A | 320 | 18 | 5.8 | 0 | 1 | CXO | 38 | N | 15 | |
| XMM | 235 | N | 14 | |||||||
| NGC 1333 I4 B | 320 | 17 | 3.1 | 0 | 1 | CXO | 38 | N | 15 | |
| XMM | 235 | N | 14 | |||||||
| IC 348 HH211-MM | 310 | 3.6 | 0.8 | 0 | 1 | XMM | 207 | N | 16 | |
| IC 348 MMS | 310 | 8 | 1.1 | 0 | 3 | XMM | 207 | N | 16 | |
| IRAM 04191 | 140 | 0.12 | 0.48 | 0 | 1 | CXO | 20 | N? | 17 | |
| L 1527 | 140 | 1.9 | 0.8 | 0/1 | 1 | CXO | 20 | N? | 17 | |
| OMC 3-MM 6 | 450 | 6.1 | 0 | 1 | CXO | 89 | N | 18 | ||
| OMC 3-MM 9 | 450 | 1.9 | 1 | 1 | CXO | 89 | N | 18 | ||
| L 1641-VLA 1 | 460 | 1.6 | 0? | 1 | CXO | 20 | N | 19 | ||
| NGC 2024-FIR 5 | 450 | 15 | 0 | 4 | CXO | 77 | N | 20 | ||
| NGC 2024-FIR 6 | 450 | 6 | 0 | 4 | CXO | 77 | N | 20 | ||
| HH 25 MMS | 450 | 7.2 | 1.2 | 0 | 1 | CXO | 63 | N | 21 | |
| HH 24 MMS | 450 | 2.7 | 0 | 1 | CXO | 63 | N | 21 | ||
| LBS17-H | 450 | 1.5 | 2.8 | 0 | 1 | CXO | 63 | N | 21 | |
| VLA 1623 | 160 | 0.8 | 0 | 1 | CXO | 96 | N | 22 | ||
| IRAS 16293-2422 | 160 | 21 | 4.6 | 0 | 5 | CXO | 30 | N? | 17 | |
| Trifid-TC3 | 1680 | 1000 | 60 | 0? | 4 | CXO | 58 | N | 23 | |
| Trifid-TC4 | 1680 | 520-2400 | 60 | 0? | 6 | CXO | 58 | Y? | 23 | |
| Serp-S68 N | 310 | 4.4 | 1.1 | 0 | 5 | XMM | 250 | N | 24 | |
| Serp-FIRS 1 | 310 | 45 | 3.6 | 0/1 | 5 | XMM | 250 | N | 24 | |
| Serp-SMM 5 | 310 | 3.6 | 1.4 | 1 | 5 | XMM | 250 | N | 24 | |
| Serp-SMM 4 | 310 | 5.2 | 1.5 | 0 | 5 | XMM | 250 | N | 24 | |
| Serp-SMM 3 | 310 | 4.9 | 1 | 0 | 5 | XMM | 250 | N | 24 | |
| Serp-SMM 2 | 310 | 4 | 0.36 | 0 | 5 | XMM | 250 | N | 24 | |
| IRS 7B | 170 | 0.2 | 0 | 28,7 | XMM | 195 | Y | 25 | ||
| CXO | 77aaHamaguchi et al. (2005) reports X-ray counts from the source in two observations of the R CrA with 57 ks exposure. From visual inspection, we confirm that another counts are seen from the source during the third exposure of ks. | Y | 25 | |||||||
| IC 1396N-BIMA 2 | 750 | 150 | 5.1 | 1/0 | 8 | CXO | 30 | Y | 26 | |
| (b) Ophiuchus and Serpens Protostars Observed in X-rays | ||||||||||
| CRBR 12 | 160 | 1 | 9 | CXO | 96 | N | 22 | |||
| GSS 30 IRS-1 | 160 | 26 | 0.06 | 1 | 10 | CXO | 96 | N | 22 | |
| GSS 30 IRS-3 | 160 | 0.5 | 0.11 | 1 | 11 | CXO | 96 | N | 22 | |
| GY 91 | 160 | 1 | 9 | CXO | 96 | Y | 22 | |||
| WL 12 | 160 | 4.1 | 0.03 | 1 | 10 | CXO | 100 | Y | 27 | |
| LFAM 26 | 160 | 1 | 9 | CXO | 100 | N | 27 | |||
| EL 29 | 160 | 41 | 0.09 | 1 | 10 | CXO | 100 | Y | 27 | |
| WL 6 | 160 | 2 | 1 | 11 | CXO | 100 | Y | 27 | ||
| CRBR 85 | 160 | 1 | 9 | CXO | 100 | N | 27 | |||
| IRS 43 | 160 | 10.1 | 0.05 | 1 | 10 | CXO | 100 | Y | 27 | |
| IRS 44 | 160 | 13 | 0.05 | 1 | 10 | CXO | 100 | Y | 27 | |
| IRS 46 | 160 | 0.6 | 0.02 | 1 | 11 | CXO | 100 | Y | 27 | |
| IRS 48 | 160 | 11.1 | 0.06 | 1 | 11 | CXO | 100 | N | 27 | |
| IRS 51 | 160 | 1.3 | 0.06 | 1 | 9 | CXO | 100 | Y | 27 | |
| IRS 54 | 160 | 11.0 | 1 | 10 | CXO | 100 | N | 27 | ||
| ISO 241 | 310 | 1 | 12 | XMM | 250 | N | 24 | |||
| ISO 249 | 310 | 1 | 12 | XMM | 250 | N | 24 | |||
| ISO 250 | 310 | 1 | 12 | XMM | 250 | N | 24 | |||
| ISO 253 | 310 | 1 | 12 | XMM | 250 | N | 24 | |||
| ISO 254 | 310 | 1 | 12 | XMM | 250 | N | 24 | |||
| ISO 258a | 310 | 1 | 12 | XMM | 250 | N | 24 | |||
| ISO 260 | 310 | 1 | 12 | XMM | 250 | N | 24 | |||
| ISO 265 | 310 | 1 | 12 | XMM | 250 | Y | 24 | |||
| ISO 270 | 310 | 1 | 12 | XMM | 250 | N | 24 | |||
| ISO 276 | 310 | 1 | 12 | XMM | 250 | N | 24 | |||
| ISO 277 | 310 | 1 | 12 | XMM | 250 | N | 24 | |||
| ISO 306 | 310 | 1 | 12 | XMM | 250 | Y | 24 | |||
| ISO 308 | 310 | 1 | 12 | XMM | 250 | N | 24 | |||
| ISO 312 | 310 | 1 | 12 | XMM | 250 | Y | 24 | |||
| ISO 313 | 310 | 1 | 12 | XMM | 250 | N | 24 | |||
| ISO 326 | 310 | 1 | 12 | XMM | 250 | N | 24 | |||
| ISO 327 | 310 | 1 | 12 | XMM | 250 | N | 24 | |||
| ISO 330 | 310 | 1 | 12 | XMM | 250 | Y | 24 | |||
| ISO 331 | 310 | 1 | 12 | XMM | 250 | N | 24 | |||
Note. — Column 1: Name of protostellar object. Column 2: Approximate distance. Column 3: Bolometric luminosity. Column 4: Envelope mass. Column 5: Evolutionary classification. Column 6: Reference for columns 2-5. Column 7: X-ray observatory. Column 8: X-ray exposure time. Column 9: X-ray detection flag (Y = detected, N = non-detected). Column: Reference for columns 7-9.
Note. — References: 1 = Froebrich (2005), 2 = Ciardi et al. (2003), 3 = Eislöffel et al. (2003), 4 = André et al. (2000), 5 = Froebrich et al. (2005), 6 = Lefloch & Cernicharo (2000), 7 = Nutter et al. (2005), 8 = Beltrán et al. (2002), 9 = Bontemps et al. (2001), 10 = André & Montmerle (1994), 11 = Bontemps et al. (1996), 12 = Kaas et al. (2004), 13 = Tsujimoto et al. (2005), 14 = Preibisch (2003), 15 = Getman et al. (2002), 16 = Preibisch & Zinnecker (2004b), 17 = unpublished (image examined by us), 18 = Tsujimoto et al. (2002a), 19 = Pravdo et al. (2001), 20 = Skinner et al. (2003), 21 = Simon et al. (2004), 22 = Gagné et al. (2004), 23 = Rho et al. (2004), 24 = Preibisch (2004a), 25 = Hamaguchi et al. (2005), 26 = This work, 27 = Imanishi et al. (2001), 28 = Saraceno et al. (1996a)
| Name | Ref. | ||
|---|---|---|---|
| mag | |||
| (1) | (2) | (3) | (4) |
| CRBR 12 | 0.91 | 12.04 | 1,2 |
| GSS 30 IRS-1 | 1.2 | 12.85 | 1,2 |
| GSS 30 IRS-3LFAM 1 | 1.08 | 13.59 | 1,2 |
| GY 91CRBR 42 | 0.7 | 12.51 | 1,2 |
| WL 12 | 1.04 | 10.18 | 1,2 |
| LFAM 26GY 197 | 1.25 | 14.63 | 1,2 |
| EL 29 | 0.98 | 7.54 | 1,2 |
| WL 6 | 0.59 | 10.04 | 1,2 |
| CRBR 85 | 1.48 | 13.21 | 1,2 |
| IRS 43GY 265 | 0.98 | 9.46 | 1,2 |
| IRS 44GY 269 | 1.57 | 9.65 | 1,2 |
| IRS 46GY 274 | 0.94 | 11.46 | 1,2 |
| IRS 48GY 304 | 0.18 | 7.42 | 1,2 |
| IRS 51GY 315 | -0.04 | 8.93 | 1,2 |
| IRS 54GY 378 | 1.76 | 10.87 | 1,2 |
| ISO 241 | 1.74 | 16.11 | 3 |
| ISO 249EC 37 | 1.98 | 13.62 | 3 |
| ISO 250DEOS | 2.06 | 11.67 | 3 |
| ISO 253EC 40 | 1.23 | 14.90 | 3 |
| ISO 254EC 38 | 0.82 | 12.46 | 3 |
| ISO 258aEC 41 | 0.96 | 14.80 | 3 |
| ISO 260 | 16.76 | 3 | |
| ISO 265EC 53 | 0.98 | 11.32 | 3 |
| ISO 270 | 2.56 | 17.70 | 3 |
| ISO 276GCNM 53 | 2.02 | 14.80 | 3 |
| ISO 277EC 63 | 14.88 | 3 | |
| ISO 306EC 80 | 0.44 | 13.75 | 3 |
| ISO 308HCE 170 | 16.62 | 3 | |
| ISO 312EC 89 | 0.85 | 11.24 | 3 |
| ISO 313 | 13.46 | 3 | |
| ISO 326EC 103 | 0.62 | 11.56 | 3 |
| ISO 327HCE 175 | 0.53 | 15.41 | 3 |
| ISO 330HB 1 | 2.35 | 14.37 | 3 |
| ISO 331 | 2.51 | 15.37 | 3 |
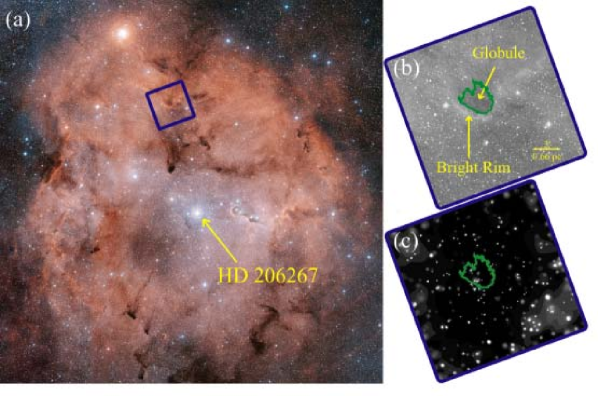
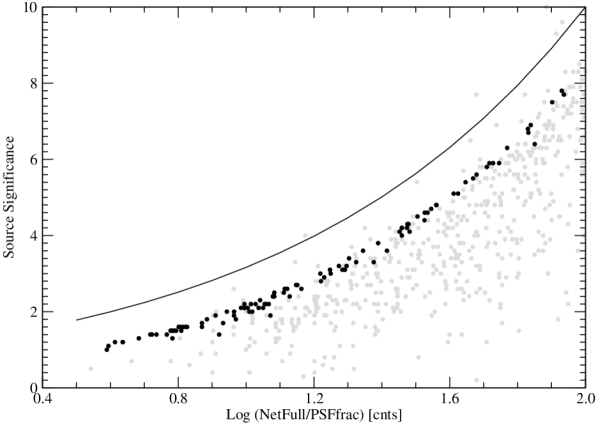
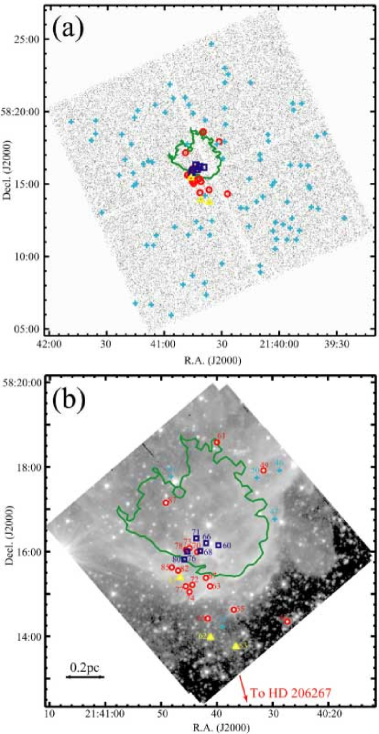
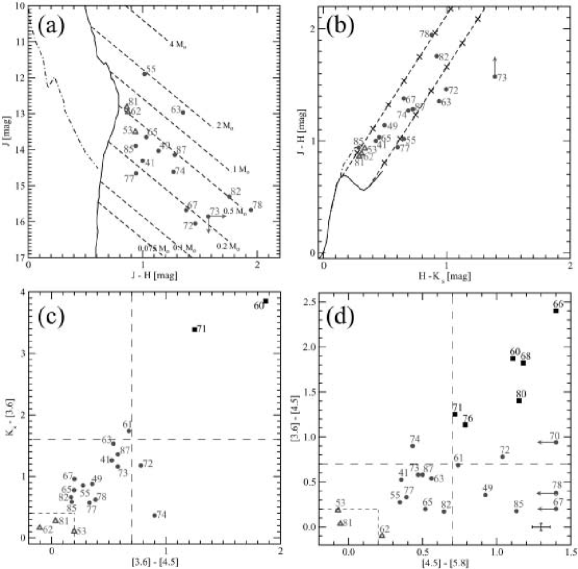
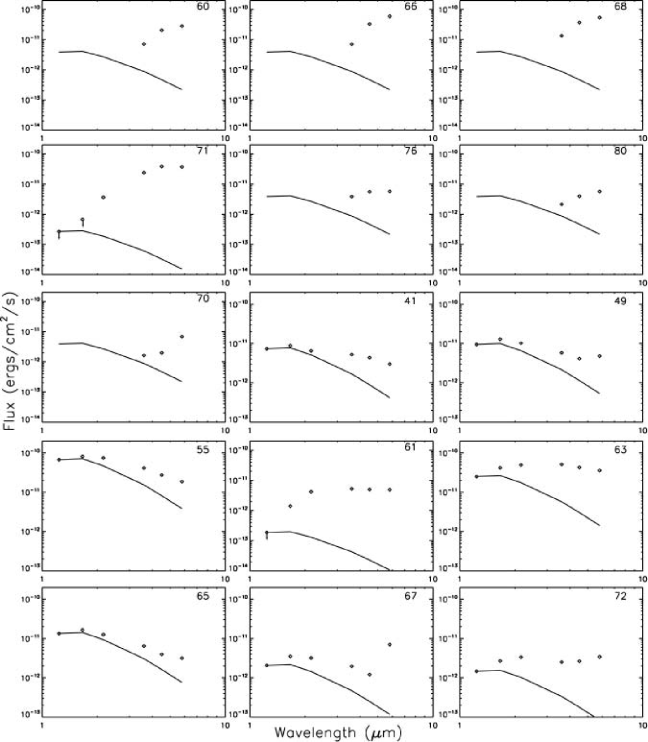
![[Uncaptioned image]](/html/astro-ph/0607006/assets/x6.png)