When Do Internal Shocks End and External Shocks Begin? Early-Time Broadband Modelling of GRB 051111
Abstract
Even with the renaissance in gamma-ray burst (GRB) research fostered by the Swift satellite, few bursts have both contemporaneous observations at long wavelengths and exquisite observations at later times across the electromagnetic spectrum. We present here contemporaneous imaging with the KAIT robotic optical telescope, dense optical sampling with Lulin, and supplemented with infrared data from PAIRITEL and radio to gamma-ray data from the literature. For the first time, we can test the constancy of microphysical parameters in the internal-external shock paradigm and carefully trace the flow of energy from the GRB to the surrounding medium. KAIT data taken minute after the start of GRB 051111 and coinciding with the fading gamma-ray tail of the prompt emission indicate a smooth re-injection of energy into the shock. No color change is apparent in observations beginning minutes after the GRB and lasting for the first hour after the burst. There are achromatic flux modulations about the best-fit model at late ( s) times, possibly due to variations in the external density. We find that the host-galaxy extinction is well fit by a curve similar to that of the Small Magellanic Cloud. Low visual extinction, mag, combined with high column densities determined from the X-ray and optical spectroscopy ( cm-2), indicate a low dust-to-metals ratio and a possible over-abundance of the light metals. An apparent small ratio of total to selective extinction () argues against dust destruction by the GRB. Time constancy of both the IR/optical/UV spectral energy distribution and the soft X-ray absorption suggests that the absorbing material is not local to the GRB.
1 Introduction
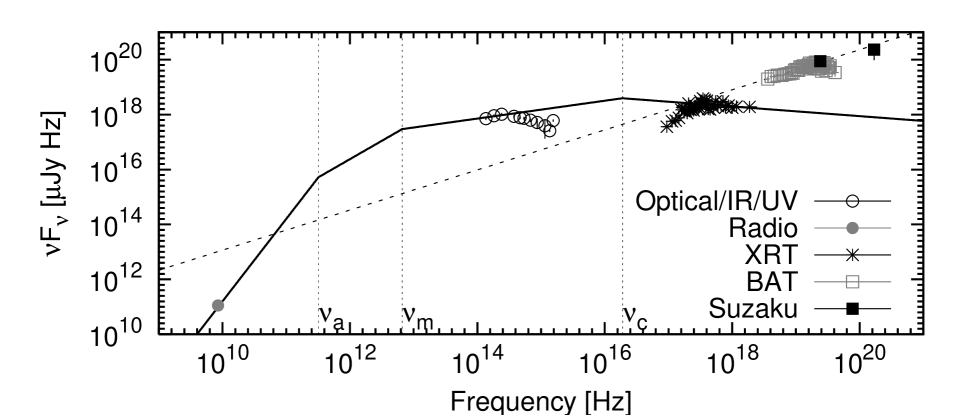
The Swift gamma-ray burst (GRB) satellite (Gehrels et al., 2004) continues to unleash a torrent of finely time- and energy-sampled photons arising from the bursts and their impact on the surrounding medium (i.e., the GRB afterglows). The X-ray Telescope (XRT) provides detailed light curves for 1-2 bursts and burst afterglows per week, allowing us to routinely view the practically uncharted first 100s to day in the life of a GRB. In the X-ray data, we see complex phenomena: unexpected rapid decays, also sometimes temporally flat and apparently re-energized afterglows, and massive X-ray flares (see, e.g., Nousek et al., 2006). Unfortunately, it has proven very challenging to complement these data with an early and rapid-cadence data set at longer wavelengths. Because studies of GRB afterglows prior to Swift rely primarily on observations in the optical and longer wavelengths, and mostly at later times, contemporaneous observations are critical for connecting new-found insights to the large body of previous work. Correlated, broadband observations of events which exhibit extremely energetic broadband emission from the radio to the gamma-rays (e.g., Figure 3) allow us to study and potentially understand the new phenomenology and to pose answers to numerous open questions.
Optical observation of GRBs in the prompt phase and shortly there after are extremely rare. Of optical afterglows detected prior to Swift, only one (GRB 990123, Akerlof et al., 1999) was detected during the prompt phase and only a handful were detected in the first 10 min of the afterglow: GRB 021004 (Fox et al., 2003a), GRB 021211 (Fox et al., 2003b; Li et al., 2003b; Vestrand et al., 2004), and GRB 030418 (Rykoff et al., 2004). In the Swift era, the rate of early detections has jumped dramatically, thanks to rapidly communicated and tight GRB localizations from Swift and also due to the maturing system of ground-based robotic telescopes (e.g., 15 early detections by ROTSE111http://www.rotse.net alone). The UV Optical Telescope (UVOT) on Swift has the potential to match this performance, particularly with a recent prioritization of early unfiltered observations of the very red afterglows. Perhaps most impressive, the RAPTOR experiment has detected two GRBs during the prompt phase: GRB 041219 (Vestrand et al., 2005) and GRB 050820A, (Vestrand et al., 2006). The prompt and contemporaneous long wavelength emission of GRB 041219A was actually discovered at IR wavelengths (Blake et al., 2005) with the Peters Automated Infrared Imaging Telescope (Bloom et al., 2006). Even though the Galactic extinction toward the GRB was large, GRB 041219A is the only prior burst with prompt, long-wavelength observations at multiple frequencies.
Here we present observations of GRB 051111 conducted with the robotic 0.76-m Katzman Automatic Imaging Telescope (KAIT; Filippenko et al., 2001; Li et al., 2003a, b), beginning with an unfiltered exposure 43.7 s after the GRB trigger from the Burst Alert Telescope (BAT) on Swift and just catching the tail of the prompt emission. We obtained color information in the form of and -band observations beginning just 73.7 s after the trigger. Supplemented with , , , and -band observations with the Lulin One-meter Telescope and , , and -band observations with PAIRITEL taken hours after the burst and with other observations reported in the literature, we present an unrivaled and impressive broadband view of this afterglow and its early evolution.
The study of the early emission during and following a GRB is a critical step toward understanding the origin of the emission and the nature of the surrounding medium. It is widely accepted that GRBs are produced by a self-interacting relativistic outflow (“internal shocks,” e.g., Fenimore, Madras, & Nayakshin, 1996) which heats and shocks the surrounding medium (“external shocks”) to form a long-lasting afterglow at longer wavelengths (Mészáros & Rees, 1997; Sari & Piran, 1999). Transient emission from a “reverse shock,” which propagates backward toward the central engine in the shock frame, can also be produced. Despite an early indication to the contrary from GRB 990123 (e.g., Akerlof et al., 1999), the reverse shock does not appear to be a common feature in the early optical data (see, also, McMahon, Kumar, & Piran, 2006). Primarily due to the larger physical size, the external shocks are expected to generate smoother light curves, and the % of GRBs with smooth time histories may require only external shocks (e.g., McMahon, Kumar, & Panaitescu, 2004).
However, the growing sample of early afterglow observations militates against such a simple interpretation. As mentioned above, the X-ray data (and also some optical data, e.g., Fox et al., 2003a; Wozniak et al., 2005) evidence shock refreshment (Rees & Mészáros, 1998; Sari & Mészáros, 2000; Ramirez-Ruiz, Merloni, & Rees, 2001) or continued central engine activity (Rees & Mészáros, 2000; MacFadyen et al., 2001; Ramirez-Ruiz, 2004; Lee & Ramirez-Ruiz, 2002), which can persist for several hundreds of seconds or longer (e.g., Nousek et al., 2006). While its physical size is still small compared to the timescale for synchrotron cooling, the external shock can cool rapidly. Energy can be efficiently radiated from the shock at this stage (e.g., Sari, Piran, & Narayan, 1998), prior to the onset of an adiabatic evolution. Depending on the breadth of the shock shell, which depends on the duration of the period of internal shocks generation, the internal shock emission can overlap with the external shock emission. Below, we use the exquisitely sampled data for GRB 051111 to disentangle the early-time emission components and also to study the dust and gas properties of the host galaxy.
2 Observations and Data Reduction
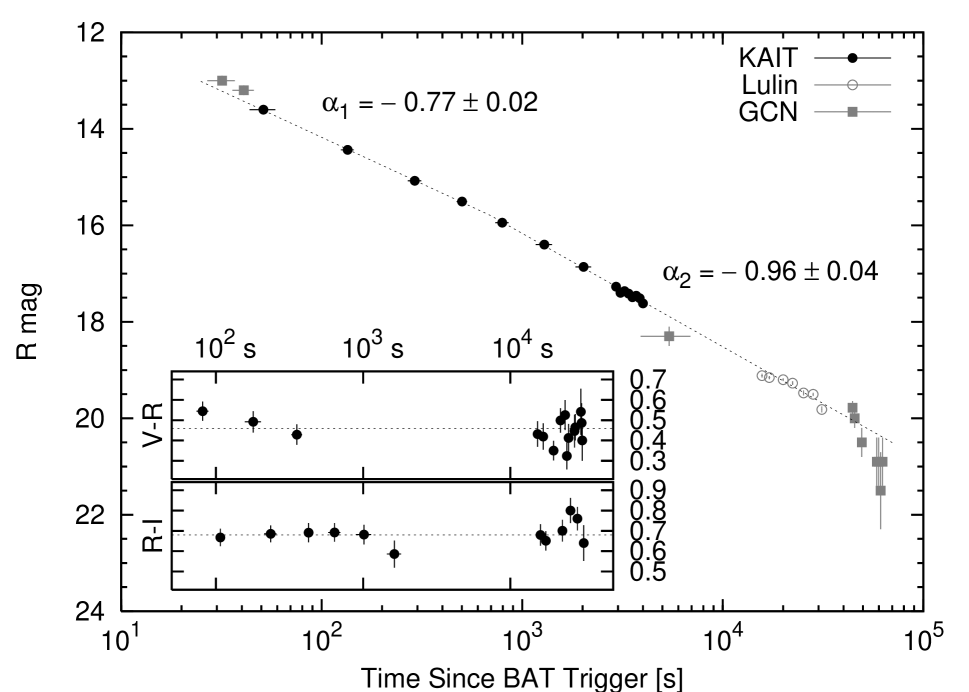
At 05:59:41.4 UT, Swift BAT triggered and localized GRB 051111 (Sakamoto et al., 2005). The 3′ radius error region from BAT enabled the rapid detection of a new optical source only 26.9s after the trigger (Rujopakarn et al., 2005), while the burst was still in progress. A barrage of detections in the optical, ultraviolet (UV), infrared (IR), radio, and X-ray bands followed. Figure 1 shows a snapshot of the full data set, interpolated via the modelling below to s.
2.1 Gamma- and X-ray
We downloaded the Swift BAT gamma-ray data from the Swift Archive222ftp://legacy.gsfc.nasa.gov/swift/data. The energy scale and mask weighting were established by running the bateconvert and batmaskwtevt tasks from HEAsoft 6.0.4. Spectra and light curves were extracted with the batbinevt task, and response matrices were produced by running batdrmgen. We apply the systematic error corrections to the low-energy BAT spectral data as suggested by the BAT Digest website333http://swift.gsfc.nasa.gov/docs/swift/analysis/bat_digest.html, and fit the data using ISIS444http://space.mit.edu/CXC/ISIS/.
The Swift XRT X-ray data from 5 follow-up observations of the GRB 051111 field were downloaded from the Swift Archive and reduced by running version 0.10.3 of the xrtpipeline reduction script from the HEAsoft 6.0.6555http://heasarc.gsfc.nasa.gov/docs/software/lheasoft/ software release. From there, we bin the data in time, exclude pileup chip regions for each time interval, account for lost flux due to bad pixels, and produce spectra using custom IDL scripts (e.g., Butler, 2006). The data cover the time range from 5.56 ksec until 405.29 ksec after the burst, with a total exposure (livetime) of 51.98 ksec. Spectral response files are generated using the xrtmkarf task and the latest calibration database (CALDB) files (version 8, 2006-04-27). The spectra are modelled using ISIS. For each spectral bin, we require a signal-to-noise ratio (S/N) of 3.5. We define S/N as the background-subtracted number of counts divided by the square root of the sum of the signal counts and the variance in the background. We define the background region as that where the number of counts in an aperture the size of the source extraction region is within of the median background over the chip in that aperture for one contiguous follow-up observation. For the Photon Count (PC) mode data, the source aperture is a circle of radius 16 pixels.
2.2 Optical
The robotic 0.76-m Katzman Automatic Imaging Telescope (Filippenko et al., 2001; Li et al., 2003a, b, KAIT;). at Lick Observatory observed GRB 051111 in a series of images automatically obtained starting at 05:60:25.2 UT (43.7 s after the BAT trigger; Li et al., 2005). The sequence includes a combination of images taken with the and filters, as well as some that are unfiltered (Table 1). The optical transient first identified by Rujopakarn et al. (2005) at , (J2000.0) was clearly detected in each exposure. We began , , , and band imaging (Huang et al., 2005) of the GRB 051111 afterglow using the Lulin One-meter Telescope (LOT; Huang et al., 2005b; Urata et al., 2005) at 10:07 UT. We detected the optical afterglow clearly in each band until observations ceased at 14:42:06 UT (Table 2).
We find that the combination of the KAIT optics and the quantum efficiency of the Apogee CCD camera makes the KAIT unfiltered observations mostly mimic the band. We determine a small color correction (Li et al., 2003a, b; Riess et al., 1999) between the unfiltered and band photometry of mag using the and color information from the Lulin observations.
We use point spread function (PSF) fitting through the IDL DAOPHOT666http://idlastro.gsfc.nasa.gov package to reduce our data. Only unsaturated and spherically symmetric sources within a given CCD exposure are used to model the stellar PSF for that exposure. The absolute photometric calibration for KAIT is determined using more than 10 Landolt (1992) fields observed on Nov. 24 UT at a range of airmasses. The Lulin photometry is calibrated using Landolt (1992) fields PG0231+051, SA92, and SA97, and also cross-checked using the KAIT standard star observations.
2.3 Near-IR and UV
After initially poor transmission conditions (i.e., clouds) at Mt. Hopkins, we obtained a total imaging exposure of 188 s on the field of GRB 051111 before hitting a telescope limit. In simultaneous observations with PAIRITEL (Bloom et al., 2006) we measure magnitudes of the Rujopakarn et al. (2005) transient of , , and (Bloom et al., 2005), relative to 2MASS (Two Micron All Sky Survey). The data were taken from 07:23:29 to 07:28:26 UT, centered 1.44 hrs after the BAT trigger.
We refine the Swift UVOT photometry (Poole et al., 2005) in the , , and bands by employing a tight extraction region in order to maximize the S/N (see Li et al., 2006). We find ( s post BAT trigger), ( s post BAT trigger), and ( s post BAT trigger). These numbers are consistent with those of Poole et al. (2005), but with considerably smaller error bars. We extrapolate the Galactic extinction curve (Schlegel, Finkbeiner, & Davis, 1998) into the UV in order to perform the fitting for the UVW1, UVM2, and UVW2 bands below.
3 Fits to the Data
3.1 Optical Light Curve and Lack of Color Change
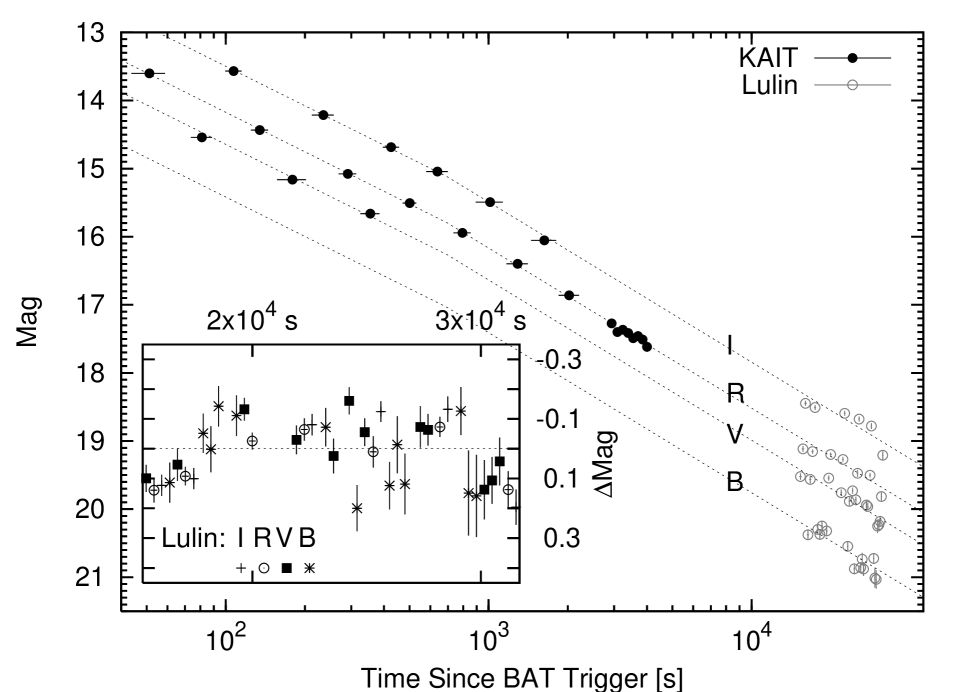
As shown in Figure 1, the KAIT band data are well fit by a broken powerlaw with s (). The best-fit flux decay indices are shown in Figure 1. The fit is statistically unacceptable without the break (, ). Including the Lulin band data in the fit, the model parameters do not change, but the fit quality degrades (). Similar fit qualities are found for the data in the , , and bands by applying magnitude offsets to the best-fit band model (, , and , respectively). From the fits, we derive the following afterglow colors: , , and mag, corrected for Galactic extinction (Schlegel, Finkbeiner, & Davis, 1998).
The and colors, without the Galactic extinction correction, are plotted in the sub-panel of Figure 1, and the multi-band data are plotted in Figure 2, along with the fits. The KAIT and Lulin data are consistent with no color evolution, and the light-curve break is most likely achromatic. From the colors before and after the break, we derive a change in the spectral index (). Figure 2 displays another interesting characteristic of the data: there are strong residuals in the Lulin data with relative to the broken powerlaw fit, and these are correlated across spectral bands.
As we discuss further below, the PAIRITEL data, as well as the available data from the GCN in the optical and UV, are consistent with the broken powerlaw decay, modified by dust absorption.
3.2 Gamma- and X-ray
The BAT gamma-ray light curve exhibits a characteristic FRED-like (“fast rise exponential decline”) time decay, with duration s. From a wavelet analysis, we determine the start of the burst as 7.17 s prior to the BAT trigger (Figure 6). From this point onward, we use this time as the beginning of the burst. This has the effect of increasing the initial optical decay index from 0.77 to 0.81 (Figure 1), but does not affect any of the other results above. The 15–150 keV spectrum from the beginning of the burst to 40 s later is adequately fit by a powerlaw with photon index (). The model fluence in the 15–100 keV band is erg cm-2. The fits are consistent with those reported by Sakamoto et al. (2005) and Krimm et al. (2005), where a modestly longer burst time extraction region is applied.
There is a significant amount of spectral evolution, comparing the time prior to burst peak to the time post peak. For the burst rise from 0 s to 10 s, we find and mJy (). For the burst decline from 10 s to 40 s, we find and mJy (). The photon index for 20 s to 40 s (, ) is consistent with the 10 s to 40 s value, indicating that this value provides a reasonable characterization for the full decline phase. The burst was also observed by the Suzaku Wideband All-sky Monitor (WAM; Yamaoka et al., 2006) and found to have a similar time profile as from Swift and also a consistent time integrated spectral slope () and a fluence in the 100–700 keV band of erg cm-2 (Yamaoka et al., 2005). Combining the fluence determinations from Swift and Suzaku, we find a 15–700 keV fluence of erg cm-2. Because the peak energy for this burst has not been measured, the bolometric fluence could be substantially larger than the 15–700 keV fluence. Assuming that all the prompt photons have been accounted for, a lower limit on the isotropic equivalent energy emitted in the host frame at (Hill et al., 2005) is erg. Here and throughout, we assume a cosmology with (, , ) (0.71, 0.3, 0.7).
The X-ray light curve in the 0.3–10.0 keV band is reasonably well fit () by a powerlaw model with . The spectrum in the same band contains 573 counts and is well-fit () by an absorbed powerlaw with photon index , absorbing column cm-2, and unabsorbed flux erg cm-2 s-1, for the time period 5.56 to 405.29 ksec after the GRB. We use the corresponding average spectral flux at 1 keV, Jy, to translate the XRT count rate to Jy below. The absorption is greater than the inferred Galactic value in the source direction ( cm-2, Dickey & Lockman, 1990) at significance (, for 1 additional degree of freedom). At redshift (Hill et al., 2005), the excess column is cm-2, allowing for a 20% uncertainty in the Galactic column. We find no evidence for significant emission lines in the spectrum. These fits are consistent with the preliminary fits reported by La Parola et al. (2005).
4 Discussion
4.1 Late-Time Broadband Afterglow Modelling
After s, the broadband afterglow data are well described by the external shock synchrotron model (Paczyński & Rhoads, 1993; Katz, 1994; Waxman, 1997; Wijers, Rees, & Mészáros, 1998). We do not attempt to model the slowly decaying early optical light curve or the achromatic (or nearly so) optical break discussed above, nor do we fit for the BAT data or the apparent fluctuations in the optical at s (Figure 2) at this stage. These features are discussed below. Due to the fluctuations in the optical about the best fit model at s, we are also forced to add a 10% systematic uncertainty component in quadrature to the statistical uncertainty of each data point, in order to obtain an acceptable fit (, s). Figure 4 shows the best-fit model, plotted over the radio, optical, UV, IR, and X-ray data at s. In the next section, we describe the modelling of the host-frame extinction by dust, which has been taken into account (Figure 5) in the figure so that the data in the optical, UV, and IR appear on one common curve.
Because the optical time decay is shallow and the X-ray decay is steep, we expect and observe the data to be well fit by a uniform density, interstellar medium (ISM) model. A model with , describing the expected density contours for a progenitor star with a significant wind, would exhibit a synchrotron cooling break frequency which increases in frequency with time (Chevalier & Li, 2000). This leads to shallower decays at high versus low energy, opposite to the behavior of the ISM model. For the constant-density model, the optical and X-ray decay indices (, ) and the X-ray energy index () constrain the powerlaw index describing the energy distribution of synchrotron-emitting electrons: (e.g., Sari, Piran, & Narayan, 1998). In the best-fit model, the synchrotron cooling break lies between the optical and X-ray bands during the observation. The predicted value for the optical energy index is .
The model contains 4 additional free parameters (e.g., Sari, Piran, & Narayan, 1998): , , , and , the efficiency factor relating the shock energy to the energy released in gamma-rays, the fractions of equipartition energy going into the electrons and magnetic field , and the density . These are constrained by the three observed radio, optical, and X-ray fluxes and by the equation describing the time evolution of the synchrotron spectral peak frequency . If we assume that the peak in the synchrotron spectrum passes through the optical band at the same time the light curve breaks ( s), as might be expected if the early optical light curve is dominated by the internal shocks, then we derive the parameters listed in Table 3. As we describe below, the pre-break optical light curve may also be due to external shocks, in which case we only have an upper limit on the passage time for the synchrotron peak through the optical bands. Aside from , the model parameters are sensitive to (and roughly linearly proportional to) (Table 3).
4.2 Optical/IR/UV Spectral Energy Distribution
A tight constraint can be placed on the optical absorption considering only the observed optical/X-ray spectral flux ratio , at s in the observer frame. Here, the X-ray flux is corrected for absorption. Allowing for the possibility that the synchrotron cooling break () is between observer frame band, , and 1 keV in the observer frame, , the observed optical to X-ray flux is (e.g., Galama & Wijers, 2001)
| (1) |
where is the absorption at band in the observer frame. The constraint on derived above for the constant-density model leads to mag. For the wind density medium, there cannot be a spectral break due to the rapid X-ray versus optical light curve decline, and we have . This relation can only be satisfied with positive absorption if . This is just possible in the wind scenario for , implying (Chevalier & Li, 2000) and mag. The rest-frame extinction in the band (i.e., 5556 Å), , will be a factor of a few times smaller than this, depending on the extinction law.
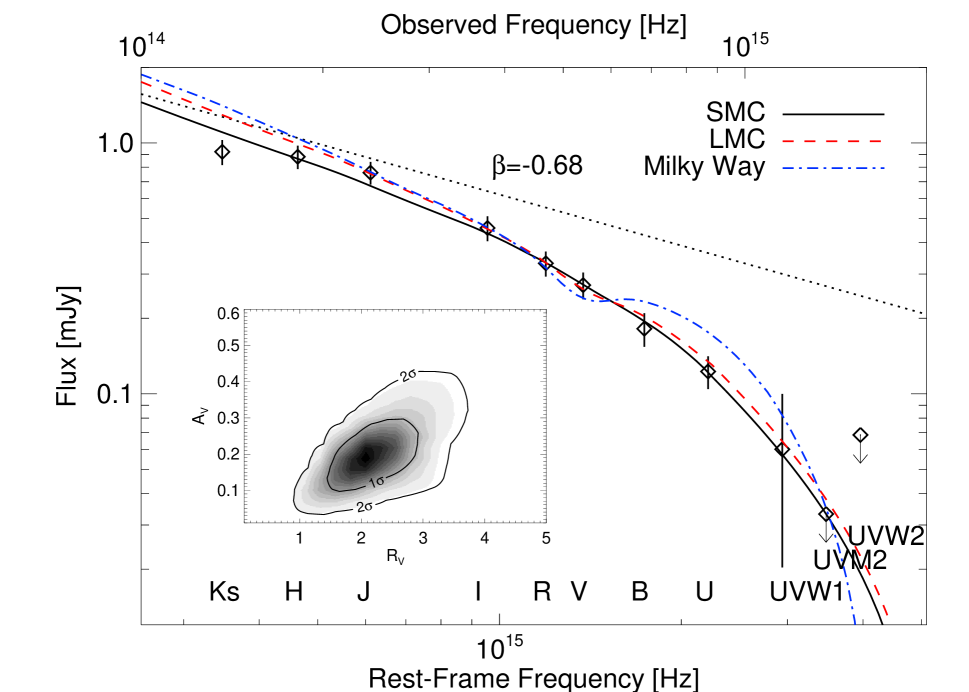
Figure 5a displays extinction-law fits to the optical/IR/UV spectral energy distribution (SED) interpolated to s. We interpolate all data using the broken powerlaw fit determined for the unfiltered KAIT and band Lulin data (Figure 1). We choose 5200 s so that little interpolation is required for the IR or UV data. Because there is a prominent departure in the IR, optical, and UV light curve data from the fit curve in the time interval s in Figure 4 (see, also, Figure 1)—which can be modelled with a single magnitude offset of mag from the powerlaw curve —we must include a variable offset in the SED fitting to describe the flux offset in this time interval. (Explanations for this behavior are discussed below.) Also, we use the constraint derived above for the (unabsorbed) optical energy index .
We begin by fitting the empirical Milky Way, Large Magellanic Cloud (LMC), and Small Magellanic Cloud (SMC) extinction curves of Pei (1992). The fits (Figure 5a) yield rest-frame band extinction values of (), (), and () mag, respectively. The excellent fit of the SMC model and the poor fit of the Galactic extinction model point toward a weak 2175 Å dust “bump” and an increased level of far-UV extinction relative to that found in the Galaxy. Additionally, we fit the data using the general, 8-parameter family of models from Fitzpatrick (1999), focusing on variations in and the ratio of total to selective extinction, . In order to fold in prior knowledge of physically realistic values for while not suppressing possible variations in the other parameters describing the extinction curve (e.g., the magnitude of the dust bump, which we marginalize over), we exploit the Reichart (2001) prior. The best-fit extinction curve has mag, in agreement with the SMC value determined above, and (). The model extinction at band in the observer frame is mag, consistent with the value derived above from the optical/X-ray flux ratio alone. Finally, we note that the extinction curve of Calzetti et al. (2000) provides a poor fit (, with best-fit mag, ).
Standard Galactic dust has (Sneden et al., 1978), and the low inferred (see also, e.g., Krisciunas et al., 2000, for the appearance of such values in the SEDs of supernovae) implies a dust-grain distribution skewed toward fine grain sizes. The posterior probability contours in Figure 5b show mag (2). Larger values of mag are possible if we relax the constraint on and allow positive values, however, these models are inconsistent with the temporal decay observed in the light curve and cannot produce the observed optical/X-ray flux ratio. For the wind-density medium, which is excluded by the rapid X-ray versus slow optical flux decay unless the early X-ray light curve is actually dominated by low-level flaring, the spectral slope can be as shallow as ( above the X-ray band, in conflict with the constraint derived above from the optical/X-ray flux ratio). But this has little effect on the inferred , and we find mag ().
Both the SED fits and the optical/X-ray flux ratio demand a considerably smaller dust column than we infer from the soft X-ray absorption (Section 3.2) or from detailed modelling of the GRB 051111 optical spectrum. The Galactic relation (Predehl & Schmitt, 1995) and the observed X-ray column imply mag. (One caveat here is that XRT low energy calibration efforts are ongoing777http://swift.gsfc.nasa.gov/docs/swift/analysis/xrt_digest.html.) This indicates that the ISM exhibits a low dust-to-gas ratio, similar to the SMC which is times smaller than Galactic (Bouchet et al., 1985; Pei, 1992). Another contributing factor could be an overabundance of the light metals (which dominate the opacity at soft X-ray wavelengths; Morrison & McCammon, 1983), as also suggested by optical spectroscopy in the case of GRB 050401 (Watson et al., 2006). Similar to GRB 050401, the Keck/HIRES spectrum of GRB 051111 (Prochaska et al., 2005; Penprase et al., 2006; Prochaska, 2006) exhibits strong absorption lines in the trace element Zn (implying , for solar metalicity), which combines with the inferred light metal column from the X-ray data to imply a factor of overabundance in the multiple- elements relative to the Fe-group elements. Because of the saturation of the Zn absorption in the Watson et al. (2006) GRB 050401 spectrum and because Zn is only a trace element and does not contribute directly to the opacity (e.g., at X-ray wavelengths), this possibility should be approached cautiously.
In a separate paper, we plan to study in more detail the X-ray absorption in this burst relative to the absorption properties determined from the optical spectroscopy. From the metal abundances inferred from the GRB 051111 Keck spectrum (e.g., Si/Fe or Zn/Fe), we find evidence that the gas is highly depleted by dust. There is also marginal evidence that the light metal column (in gas form, , from ) may be a factor smaller than that inferred from the X-ray data. It is not clear how these column densities are to be reconciled with the constraints imposed by the optical and X-ray SED and the soft X-ray absorption. The Keck spectrum shows, for example, , which argues against an explanation in terms of a significant ionization of the column. The large X-ray column is probably not significantly due to intervening systems (a MgII absorber in the optical spectrum at only contributes ).
4.3 External Shock Origin for the Early Optical Light Curve and GRB?
From the optical colors, we derive above a stringent constraint on the change in the spectral slope across the break at s, which excludes an explanation based on a passage through the spectral bands of the synchrotron cooling break (yielding ; e.g., Sari, Piran, & Narayan, 1998). The most commonly invoked cause of achromatic breaks—flux decrements due to finally viewing the edge of the sideways expanding GRB jet (e.g., Rhoads, 1999)— is ruled out here by the mildness of the break () and by the extremely slow optical fade after the break. Another possible explanation, which grafts directly onto the s solution discussed above, is that the density prior to the break is increasing with radius. A decreasing density, as for a wind medium (e.g., Rykoff et al., 2004), does not work because the flux increase due to the decreasing optical absorption is over-compensated by the decrease in synchrotron flux with radius. We would also expect to see a strong color change due to the changing absorbing column. For the increasing density model, the absorbing matter close to the burst is unimportant, and there is little expected evolution in the absorption with time.
The pre-break decay is shallower by , for a density rising as and . This is because the flux between the synchrotron peak frequency and the cooling break is proportional to the synchrotron peak frequency times the peak flux (e.g., Sari, Piran, & Narayan, 1998). The frequency is independent of , while (e.g., Chevalier & Li, 2000; Sari, Piran, & Narayan, 1998). The implied increase in density from s to s is a factor of 5. Such a picture could potentially describe the prompt emission via the same external shock that later generates the afterglow. An external shock explanation for the prompt emission is motivated superficially by the apparent smoothness of the GRB (see, e.g., McMahon, Kumar, & Panaitescu, 2004). Minimally, the model must be able to reproduce the extremely hard GRB spectrum, with extending to MeV. During the Blandford & McKee (1976) evolution stage when the fireball expands adiabatically, neither the synchrotron peak frequency () nor the synchrotron cooling frequency () can decrease more rapidly than and go from such a high value at s to the derived values above at s. However, prior to this, during the fireball deceleration phase when the Lorentz factor is expected to be roughly constant, the cooling frequency will decrease very rapidly, . Our fits of this model, however, with an initial Lorentz factor (e.g., Mészáros & Rees, 1997) for s (Figure 6), show that the external shocks which generate the optical flux underproduces gamma-rays by a factor . Synchrotron self-compton emission cannot help due to that mechanism’s inefficiency at small (Sari & Esin, 2001). A more careful calculation of the expected GRB flux from the Blandford & McKee (1976) solution (e.g., Granot, Piran, & Sari, 1999), with modifications to the standard synchrotron spectrum to possibly account for the harder GRB versus optical spectrum, is beyond the scope of this paper.
4.4 Energy Injection
Refreshed shocks offer a plausible and perhaps better-travelled explanation (e.g., Nousek et al., 2006) for the flat early light curve. Figure 6 shows the external shocks model discussed above, but with the addition of a changing shock energy for . For a slow-cooling, constant-density synchrotron model between and , the light curve drops as (Sari & Mészáros, 2000), where is the decay index without energy injection (e.g., Sari, Piran, & Narayan, 1998). We derive . Between 60 and 700 s, the shock energy increases by %. If the energy injection is due to a changing luminosity of the long-lasting central engine (Rees & Mészáros, 2000; MacFadyen et al., 2001; Ramirez-Ruiz, 2004; Lee & Ramirez-Ruiz, 2002), the luminosity goes as , which may be challenging for the progenitor models (e.g., MacFadyen et al., 2001). If instead the central engine generated a flow with a powerlaw distribution of Lorentz factors , with the slower shells of material gradually catching up to the shock, we find (Rees & Mészáros, 1998; Sari & Mészáros, 2000; Ramirez-Ruiz, Merloni, & Rees, 2001).
In the constant-density case, the optical flux is more sensitive to the energy injection than is the X-ray flux (by a factor ; e.g., Equation (2) in Nousek et al., 2006). If X-ray data were available for GRB 051111 during the energy injection episode, we could therefore verify and possibly better test the scenario. Long wavelength observations are particularly important for testing the claims of strong energy injection episodes (), inferred from the X-ray data alone (Nousek et al., 2006).
4.5 The Optical Flux as Reprocessed Prompt Emission
Similar to what was found above for the increasing density model, the GRB flux at 15 keV in the energy injection scenarios is times brighter than the expected flux from the external shock (solid line in Figure 6). There is a possible steepening of the light curve decay near s apparent from ROTSE (Rujopakarn et al., 2005), Super-LOTIS (Milne et al., 2005), and the first KAIT observation (Figure 1). This early flux decline is too steep, even assuming that energy injection has not yet begun to occur at this epoch. These three data points therefore suggest that the earliest optical flux is dominated by emission from the GRB.
The dotted curve in Figure 6 shows a powerlaw fit to the gamma-ray data overplotted on the optical. The implied broadband slope is , consistent with the afterglow spectral slope in the optical but marginally inconsistent with the prompt gamma-ray spectral slope (Section 3.2). If there is a time delay for the reprocessing of the gamma-ray photons as has recently been proposed (Vestrand et al., 2006), this is a coincidence and the broadband slope could easily be consistent with the gamma-ray spectral slope. In any case, for this and the rising density model discussed above, the synchrotron peak frequency passes through the optical quite early ( s), implying a very inefficient transfer of the shock energy to the synchrotron emitting electrons (Table 3), which may also be true for the prompt emission.
4.6 Light Curve Variability
The optical light curve at s (subpanel of Figure 2; Section 3.1) and the optical/IR/UV light curve in the range s show evidence for residual variability at the % level, with . There is little evidence for spectral change during the variability. Such variability may be common and has been seen previously for well sampled GRB afterglows. The light curve of GRB 021004 (Shirasaki et al., 2002) displayed several prominent bumps (Bersier et al., 2003; Mirabal et al., 2003; Fox et al., 2003a). The exquisitely sampled light curve of GRB 030329 (Lipkin et al., 2004; Vanderspek et al., 2003) displayed prominent departures from a broken powerlaw fade, even when the underlying supernova emission was subtracted away (Bersier et al., 2003).
Nakar, Piran, & Granot (2003) explore several possible explanations for the variability in GRB 021004 and find that an explanation in terms of in terms of refreshed shocks, a non-uniform (or “patchy”) GRB jet, or variations in the external density (see, also, Wang & Loeb, 2000; Dai & Lu, 2000; Lazzati et al., 2004) are all possible. Granot, Nakar, & Piran (2003) carry out a similar analysis for GRB 030329 and suggest that density variations are unlikely to be responsible for the optical variability due to the apparent passage of the synchrotron cooling break through the passband (e.g., Bersier et al., 2003). Late-time variability after an apparent jet break also argues against the patchy jet model, although that model could still describe the variability observed at earlier times.
For GRB 051111, the variability occurs during the phase ( s) when the afterglow appears to be well described by external shocks. We believe that this favors an explanation in terms of density variation in the surrounding medium. Because the X-ray data are not expected to be affected by small variations in the density, this explanation is backed up by the quality of the X-ray fit with a single temporal powerlaw, although the X-ray error bars are %. Recently, Guidorzi et al. (2005) argue that density enhancements can explain an achromatic optical light curve bump in data taken 3 minutes after GRB 050502A. More finely sampled data, with broad spectral coverage, will be required to pin down the true source of this variability in GRB afterglows.
5 Conclusions
We have presented a thorough analysis of the rich broadband data available for Swift GRB 051111, with a focus on the early, multi-band optical data from KAIT and Lulin. The optical data prior to s show a very flat decline, with little or no evidence for a color change as compared to the data after s. The data at minute to several hours after the GRB are well fit using a simple, modified external shock model with absorption by gas and dust. The modelling entails energy injection or a rapidly increasing density profile with radius, prior to the break time. At later times there are large (%), possibly achromatic modulations in the optical, IR, and UV about the best-fit model. The modulations appear to be common in well-studied optical afterglows, yet their origin remains mysterious.
The increasing density model may allow for an external shock explanation of both the prompt gamma-ray and later emission. Such an increase in density might be expected if a supernova (SN) occurred prior to the GRB, as in the “supra-nova” model (Vietri & Stella, 1998). However, the simultaneity of GRB and SN in the nearby, well-studied cases (GRB 060218/SN 2006aj, GRB 980425/SN 1998bw, GRB 031203/SN 2003lw) argues against this possibility.
On the other hand, slowly declining light curves in the X-ray band are common and are thought to be due to shock refreshment (e.g., Nousek et al., 2006), and the GRB 051111 observations from KAIT show that this emission can also dominate the optical light curve at early times. In fact, the optical light curve for this event, which shows a rapid early decline, followed by a levelling off and then a moderate decline typical of those found in the past and modelled with external shocks, appears quite similar to the “canonical” behavior observed in the X-ray band and reported by Nousek et al. (2006). Perhaps there is a canonical optical afterglow behavior, too. (As a counter-point, the early optical behavior reported for GRBs 060206 (Monfardini et al., 2006; Stanek et al., 2006) and 060210 (Stanek et al., 2006) appears quite different from that here.)
An important feature of the GRB 051111 optical afterglow is the lack of a turnover in the optical decay rate at early times. We do not detect the peak in the synchrotron spectrum passing through the optical bands. Consonant with a lower than average X-ray flux at late times, this leads to a low value for the fraction (assuming constant equipartition) of shock kinetic energy winding up in the synchrotron-emitting electrons, %. Such a low value for is uncommon, but not unheard of, in GRBs (see, e.g., Panaitescu & Kumar, 2002). The very low value may indicate a wider diversity than previously suspected in the microphysical parameters from GRB to GRB (see, also, Berger, Kulkarni, & Frail, 2003). Aside from the low value, the derived external shocks parameters are comparable to those previously found.
It is important to stress that whether we find % or % depends on the deconvolution of the early data into prompt internal shock and afterglow external shock components. Our favored smaller arises if the synhrotron peak frequency has passed through the optical well before the break at s, in which case mild energy re-injection into the shock can explain the gradually decaying light curve. To get the larger value, the light curve prior to s must be dominated by the GRB and not by the external shocks which dominate after s. Otherwise, the early light curve would be rising rather than declining. In any case, reverberations of the prompt emission reprocessed into optical radiation (e.g., Vestrand et al., 2006) appear to be required to explain the earliest few optical data points for GRB 051111. It does not appear to be necessary to invoke reverse-shock emission (e.g., Akerlof et al., 1999; Li et al., 2003b), which is expected to produce time decays more rapid than those observed.
The absorption at IR, optical, and UV wavelengths in the observer frame is well fit by an SMC extinction curve. Little evidence for the 2175 Å dust “bump” and an excellent fit of the SMC extinction profile are common features in optical GRB afterglow spectra (e.g., Vreeswijk et al., 2004; Jakobsson et al., 2003; Savaglio & Fall, 2004; Watson et al., 2006). Combined with the soft X-ray absorption measurement, there is an implied low dust-to-gas ratio and a possible overabundance of the light-metals relative to the Fe-group metals. This has also been observed for GRB 050401 (Watson et al., 2006). The light metal overabundance works against a direct association with an SMC-like environment, because the SMC has a metalicity times solar (Pei, 1992).
The SED fitting also implies a low ratio of total to selective extinction, . This is a clue that the absorbing medium exhibits unusual dust properties. The work of Galama & Wijers (2001) establishing large typical values has led to suspicions that GRBs could destroy dust out to distances pc (see also, Waxmann & Draine, 2000; Fruchter et al., 2001; Draine & Hao, 2002; Perna & Lazzati, 2002; Perna et al., 2003). The small dust grains are preferentially destroyed, creating a flat (or “gray”) extinction curve (Galama & Wijers, 2001; Savaglio & Fall, 2004; Stratta et al., 2005). A small , however, suggests small dust grains are dominant, and our SED is very curved. These facts argue against the GRB playing a direct role in defining the extinction properties. The unchanging optical color implies that the absorbing column is not local to the GRB (i.e., pc) and may be associated with a nearby giant molecular cloud or the GRB host galaxy. Time-resolved spectroscopy in the optical and X-ray bands is of utmost importance for answering these questions.
For GRB 051111, as for a few other Swift events for which ground-based observers have been fortunate enough to capture early data, there is an emerging complicated interplay between the GRB and the subsequent shocking of the external medium. It is critical that more long-wavelength data be taken and published for other GRBs in order to facilitate modelling similar to that performed above. Only with such a disentangling of the competing emission processes can we hope to answer open questions regarding which shock components are truly the most important and what microphysical parameters define the shocks and characterize the transition from internal to external shocks.
References
- Akerlof et al. (1999) Akerlof, C., et al. 1999, Nature, 398, 400
- Berger, Kulkarni, & Frail (2003) Berger, E., Kulkarni, S. R., & Frail, D. A. 2003, ApJ, 590, 379
- Bersier et al. (2003) Bersier, D., et al. 2003, ApJ, 584, L43
- Blake et al. (2005) Blake, C. H., et al. 2005, Nature, 435, 181
- Blandford & McKee (1976) Blandford, R. D., & McKee, C. F. 1976, Phys. Fluids, 19, 1130
- Bloom et al. (2005) Bloom, J. S., et al. 2005, GCN #4256
- Bloom et al. (2006) Bloom, J. S., et al. 2006, astro-ph/0511842
- Bouchet et al. (1985) Bouchet, P., et al. 1985, A&A, 149, 330
- Butler (2006) Butler, N. 2006, astro-ph/0604083, Submitted to ApJ
- Calzetti et al. (2000) Calzetti, D., et al. 2000, ApJ, 533, 682
- Chevalier & Li (2000) Chevalier, R. A., & Li, Z.-Y. 2000, ApJ, 536, 195
- Dai & Lu (2000) Dai, Z. G., & Lu, T. 2000, ApJ, 565, L87
- Dickey & Lockman (1990) Dickey, J. M., & Lockman, F. J. 1990 ARAA, 28, 215
- Draine & Hao (2002) Draine, B. T., & Hao, L. 2002, ApJ, 569, 780
- Fenimore, Madras, & Nayakshin (1996) Fenimore, E. E., Madras, C. D., & Nayakshin, S. 1996, ApJ, 473, 998
- Filippenko et al. (2001) Filippenko, A. V., et al. 2001, in Small-Telescope Astronomy on Global Scales, eds. W. P. Chen, C. Lemme, & B. Pacyński (San Francisco: ASP), 121
- Fitzpatrick (1999) Fitzpatrick, E. L. 1999, PASP, 111, 63
- Fox et al. (2003a) Fox, D. W., et al. 2003a, Nature, 422, 284
- Fox et al. (2003b) Fox, D. W., et al. 2003b, ApJ, 586, L5
- Frail et al. (2005) Frail, D. A., et al. 2005, GCN 4270
- Fruchter et al. (2001) Fruchter, A. S., Krolik, J. H., & Rhoads, J. S. 2001, ApJ, 563, 597
- Galama & Wijers (2001) Galama, T. J., & Wijer, R. A. M. J. 2001, ApJ, 549, L209
- Garimella et al. (2005) Garimella, K., et al. 2005, GCN #4257
- Gehrels et al. (2004) Gehrels, N., et al. 2004, ApJ, 611, 1005
- Granot, Nakar, & Piran (2003) Granot, J., Nakar, E., & Piran, T. 2003, Nature, 426, 138
- Granot, Piran, & Sari (1999) Granot, J., Piran, T., & Sari, R. 1999, ApJ, 513, 679
- Guidorzi et al. (2005) Guidorzi, C., et al. 2005, ApJ, 630, L121
- Hill et al. (2005) Hill, G., et al. 2005, GCN #4255
- Huang et al. (2005) Huang, F. Y., et al. 2005, GCN #4258
- Huang et al. (2005b) Huang, K. Y., et al. 2005b, Il Nuovo Cimento, 28, 731
- Jakobsson et al. (2003) Jakobsson, P., et al. 2003, A&A, 408, 941
- Katz (1994) Katz, J. I. 1994, ApJ, 422, 248
- Krimm et al. (2005) Krimm, H., et al., GCN #4260
- Krisciunas et al. (2000) Krisciunas, K., et al. 2000, ApJ, 539, 658
- Landolt (1992) Landolt, A. U. 1992, AJ, 104, 340
- La Parola et al. (2005) La Parola, V., et al. 2005, GCN #4261
- Lazzati et al. (2004) Lazzati, D., et al. 2004, A&A, 396, L5
- Lee & Ramirez-Ruiz (2002) Lee, W. H., & Ramirez-Ruiz, E. 2002, ApJ, 577, L893
- Li et al. (2003a) Li, W., et al. 2003a, PASP, 115, L844
- Li et al. (2003b) Li, W., et al. 2003b, ApJ, 586, L9
- Li et al. (2005) Li, W., et al. 2005, GCN #4254
- Li et al. (2006) Li, W., et al. 2006, PASP, 118, 37
- Lipkin et al. (2004) Lipkin, Y. M., et al. 2004, ApJ, 606, 381
- MacFadyen et al. (2001) MacFadyen, A. I., et al. 2001, ApJ, 550, 410
- McMahon, Kumar, & Panaitescu (2004) McMahon, E., Kumar, P., & Panaitescu, A. 2004, MNRAS, 354, 915
- McMahon, Kumar, & Piran (2006) McMahon, E., Kumar, P., & Piran, T. 2006, MNRAS, 366, 575
- Mészáros & Rees (1997) Mészáros, P., & Rees, M. J. 1997, ApJ, 476, 232
- Milne et al. (2005) Milne, P., et al. 2005, GCN #4252
- Mirabal et al. (2003) Mirabal, N., et al. 2003, ApJ, 595, 935
- Morrison & McCammon (1983) Morrison, R., & McCammon, D. 1983, ApJ, 270, 119
- Monfardini et al. (2006) Monfardini, A., et al. 2006, astro-ph/0603181, Submitted to ApJ
- Nakar, Piran, & Granot (2003) Nakar, E., Piran, T., & Granot J. 2003, NewA, 8, 495
- Nanni et al. (2005) Nanni, D., et al. 2005, GCN 4298
- Nousek et al. (2006) Nousek, J. A., et al. 2006, ApJ, 642, 389
- Panaitescu & Kumar (2002) Panaitescu, A., & Kumar, P. 2002, ApJ, 571, 779
- Paczyński & Rhoads (1993) Paczyński, B., & Rhoads, J. 1993, ApJ, 418, L5
- Pei (1992) Pei, Y. C. 1992, ApJ, 395, 130
- Penprase et al. (2006) Penprase, B. E., et al. 2006, astro-ph/0512340, Submitted to ApJ
- Perna & Lazzati (2002) Perna, R., & Lazzati, D. 2002, ApJ, 580, 261
- Perna et al. (2003) Perna, R., et al. 2003, ApJ, 585, 775
- Poole et al. (2005) Poole, T. S., et al. 2005, GCN #4263
- Predehl & Schmitt (1995) Predehl, P., & Schmitt, J. H. M. M. 1995, A&AS, 293, 889
- Prochaska et al. (2005) Prochaska, J. X., et al. 2005, GCN #4271
- Prochaska (2006) Prochaska, J. X. 2006, ApJ, astro-ph/0606500, Accepted to ApJ
- Ramirez-Ruiz, Merloni, & Rees (2001) Ramirez-Ruiz, E., Merloni, A., & Rees, M. J. 2001, MNRAS, 324, 1137
- Ramirez-Ruiz (2004) Ramirez-Ruiz, E. 2004, MNRAS, 349 L38
- Rees & Mészáros (1998) Rees, M. J., & Mészáros, P. 1998, ApJ, 496, L1
- Rees & Mészáros (2000) Rees, M. J., & Mészáros, P. 2000, ApJ, 545, L73
- Reichart (2001) Reichart, D. E. 2001, ApJ, 553, 235
- Riess et al. (1999) Riess, A. G., et al. 1999, AJ, 118, 2675
- Rhoads (1999) Rhoads, J. 1999, ApJ, 525, 737
- Rujopakarn et al. (2005) Rujopakarn, W. et al. 2005, GCN #4247
- Rykoff et al. (2004) Rykoff, E. S., et al. 2004, ApJ, 601, 1013
- Rykoff et al. (2005) Rykoff, E. S. et al. 2005, GCN #4251
- Sakamoto et al. (2005) Sakamoto, T., et al., GCN #4248
- Sari & Mészáros (2000) Sari, R., & Mészáros, P. 2000, ApJ, 535, L33
- Sari & Piran (1999) Sari, R., & Piran, T. 1999, ApJ, 520, 641
- Sari, Piran, & Narayan (1998) Sari, R., Piran, T., & Narayan, R. 1998, ApJ, 497, L17
- Sari & Esin (2001) Sari, R., & Esin, A. A. 2001, ApJ, 548, 787
- Savaglio & Fall (2004) Savaglio, S., & Fall, S. M. 2004, ApJ, 614, 293
- Schlegel, Finkbeiner, & Davis (1998) Schlegel, D. J., Finkbeiner, D. P., & Davis, M. 1998, ApJ, 500, 525S
- Sharapov et al. (2005) Sharapov, D., et al. 2005, GCN #4307
- Shirasaki et al. (2002) Shirasaki, Y., et al. 2002, GCN #1565
- Smith et al. (2005) Smith, I. A., et al. 2005, GCN #4267
- Sneden et al. (1978) Sneden, C., et al. 1978, ApJ, 223, 168
- Stanek et al. (2006) Stanek, K. Z., et al. 2006, astro-ph/0602495, Submitted to ApJ
- Stratta et al. (2005) Stratta, G., et al. 2005, A&A, 441, 83
- Urata et al. (2005) Urata, Y., et al. 2005, Il Nuovo Cimento, 28, 775
- Vanderspek et al. (2003) Vanderspek, R., et al. 2003, GCN #1997
- Vestrand et al. (2004) Vestrand, W. T., et al. 2004, Astron. Nachr., 325, 549
- Vestrand et al. (2005) Vestrand, W. T., et al. 2005, Nature, 435, 178
- Vestrand et al. (2006) Vestrand, W. T., et al. 2006, astro-ph/0605472, Accepted to Nature
- Vietri & Stella (1998) Vietri, M., & Stella, L. 1998, ApJ, 507, L45
- Vreeswijk et al. (2004) Vreeswijk, P. M., et al. 2004, A&A, 419, 927
- Wang & Loeb (2000) Wang, X., & Loeb, A. 2000, ApJ, 535, 788
- Waxman (1997) Waxman, E. 1997, ApJ, 485, L5
- Waxmann & Draine (2000) Waxmann, E., & Draine, B. T. 2000, ApJ, 537, 796
- Watson et al. (2006) Watston, D., et al. 2006, astro-ph/0510368, Submitted to ApJ
- Wijers, Rees, & Mészáros (1998) Wijers, R. A. M., Rees, M. J., & Mészáros, P. 1998, AJ, 499, 301
- Wozniak et al. (2005) Wozniak, P. R., et al. 2005, ApJ, 627, L13
- Yamaoka et al. (2005) Yamaoka, K., et al. 2005, GCN #4299
- Yamaoka et al. (2006) Yamaoka, K., et al. 2006, Submitted to SPIE
| [s] | Exp. [s] | Mag. | Band | |
|---|---|---|---|---|
| 43.7 | 15 | 13.60 | 0.02 | R |
| 73.7 | 15 | 14.54 | 0.02 | V |
| 99.7 | 15 | 13.57 | 0.02 | I |
| 124.7 | 20 | 14.43 | 0.02 | R |
| 156.7 | 45 | 15.16 | 0.03 | V |
| 212.7 | 45 | 14.21 | 0.02 | I |
| 268.7 | 45 | 15.08 | 0.02 | R |
| 324.7 | 60 | 15.66 | 0.02 | V |
| 395.7 | 60 | 14.69 | 0.02 | I |
| 470.7 | 60 | 15.51 | 0.02 | R |
| 578.7 | 120 | 15.04 | 0.02 | I |
| 734.7 | 120 | 15.94 | 0.02 | R |
| 892.7 | 240 | 15.49 | 0.02 | I |
| 1167.7 | 240 | 16.40 | 0.03 | R |
| 1448.7 | 360 | 16.05 | 0.03 | I |
| 1843.7 | 360 | 16.86 | 0.03 | R |
| 2873.7 | 120 | 17.27 | 0.05 | R |
| 3026.7 | 120 | 17.40 | 0.06 | R |
| 3178.7 | 120 | 17.36 | 0.05 | R |
| 3330.7 | 120 | 17.41 | 0.06 | R |
| 3486.7 | 120 | 17.49 | 0.06 | R |
| 3639.7 | 120 | 17.46 | 0.07 | R |
| 3791.7 | 120 | 17.51 | 0.06 | R |
| 3944.7 | 120 | 17.62 | 0.07 | R |
Notes: band magnitudes determined for unfiltered observations (Section 2). We denote with the elapsed time since the BAT trigger.
| [hr] | Exp. [s] | Mag. | Band | |
|---|---|---|---|---|
| 4.2201 | 300 | 19.52 | 0.05 | V |
| 4.3154 | 300 | 19.12 | 0.04 | R |
| 4.4107 | 300 | 18.45 | 0.04 | I |
| 4.5071 | 300 | 20.38 | 0.07 | B |
| 4.6021 | 300 | 19.56 | 0.05 | V |
| 4.6974 | 300 | 19.15 | 0.03 | R |
| 4.8012 | 300 | 18.51 | 0.04 | I |
| 4.9154 | 300 | 20.30 | 0.07 | B |
| 5.0085 | 300 | 20.37 | 0.08 | B |
| 5.1018 | 300 | 20.25 | 0.07 | B |
| 5.3204 | 300 | 20.32 | 0.07 | B |
| 5.4157 | 300 | 19.54 | 0.04 | V |
| 5.5110 | 300 | 19.20 | 0.03 | R |
| 6.0479 | 300 | 19.76 | 0.05 | V |
| 6.1435 | 300 | 19.27 | 0.04 | R |
| 6.2387 | 300 | 18.59 | 0.04 | I |
| 6.4037 | 300 | 20.55 | 0.06 | B |
| 6.4990 | 300 | 19.89 | 0.06 | V |
| 6.6893 | 300 | 19.73 | 0.05 | V |
| 6.7846 | 300 | 20.88 | 0.08 | B |
| 6.8796 | 300 | 19.86 | 0.05 | V |
| 6.9813 | 300 | 19.47 | 0.05 | R |
| 7.0762 | 300 | 18.68 | 0.03 | I |
| 7.1799 | 300 | 20.86 | 0.08 | B |
| 7.2729 | 300 | 20.73 | 0.10 | B |
| 7.3662 | 300 | 20.88 | 0.10 | B |
| 7.5546 | 300 | 19.94 | 0.07 | V |
| 7.6479 | 300 | 19.96 | 0.05 | V |
| 7.7926 | 300 | 19.50 | 0.03 | R |
| 7.8879 | 300 | 18.78 | 0.04 | I |
| 8.0488 | 300 | 20.72 | 0.08 | B |
| 8.1421 | 300 | 21.01 | 0.14 | B |
| 8.2365 | 300 | 21.03 | 0.14 | B |
| 8.3318 | 300 | 20.25 | 0.10 | V |
| 8.4257 | 300 | 20.23 | 0.08 | V |
| 8.5193 | 300 | 20.18 | 0.08 | V |
| 8.6235 | 300 | 19.82 | 0.06 | R |
| 8.7190 | 300 | 19.21 | 0.06 | I |
Notes: We denote with the elapsed time since the BAT trigger.
| Paramater | Value |
|---|---|
| erg (fixed) | |
| cm (fixed) | |
| 1.55 (fixed) | |
| cm-3 |
Notes: The fit in Figure 4 uses s for the passage of the synchrotron peak frequency through the optical.