Neon Abundances in B-Stars of the Orion Association: Solving the Solar model Problem?
Abstract
We report on non-LTE Ne abundances for a sample of B-type stellar members of the Orion Association. The abundances were derived by means of non-LTE fully metal-blanketed model atmospheres and extensive model atoms with updated atomic data. We find that these young stars have a very homogeneous abundance of A(Ne) = 8.27 0.05. This abundance is higher by 0.4 dex than currently adopted solar value, A(Ne)=7.84, which is derived from lines produced in the corona and active regions. The general agreement between the abundances of C, N, and O derived for B stars with the solar abundances of these elements derived from 3-D hydrodynamical models atmospheres strongly suggests that the abundance patterns of the light elements in the Sun and B stars are broadly similar. If this hypothesis is true, then the Ne abundance derived here is the same within the uncertainties as the value required to reconcile solar models with helioseismological observations.
1 INTRODUCTION
One important recent result from studies of stellar atmospheres and chemical compositions in stars is the downward revision in the abundances of carbon, nitrogen and oxygen in the solar photosphere, which was obtained from the adoption of time-dependant, hydrodynamical and 3-Dimensional model atmosphere calculations (Asplund 2005). These more realistic model atmosphere calculations indicate that the solar abundances should be lower by roughly 0.2-0.3 dex when compared to abundances derived from hydrostatic 1-D calculations. It soon became apparent that the significantly lower abundances in the Sun resulted in severe inconsistencies between the solar models and measurements from helioseismology.
Different possibilities were investigated in order to try to reconcile the solar models with the seismological observations, such as updating opacities (Bahcall et al. 2004), changing diffusion rates (Guzik et al. 2005), or significantly changing the adopted solar abundances of key elements, such as neon. Allowing for a larger neon abundance, in particular, was justified because the neon abundance in the Sun can be considered to be more uncertain given that it is not measured from lines formed in the solar photosphere. Antia & Basu (2005) constructed envelope models of the Sun, allowed for different abundance mixtures and focused on the density profile, which is determined from helioseismology. More complete calculations were presented in Bahcall, Basu & Serenelli (2005) who constructed solar models, consisting of the atmospheres plus the interior, and concluded that an adopted neon abundance A(Ne)= 8.29 0.05, would suffice in order to bring the solar models and seismological observations into an acceptable agreement. Independently, measurements of neon abundances in a sample of chromospherically active cool stars by Drake & Testa (2005) indirectly supported high Ne abundances in solar type stars.
It has been a long standing puzzle that the C, N and O abundances obtained for B-stars, which are young, were typically lower than the at-the-time generally accepted solar abundances from Anders & Grevesse (1989). These were puzzling results because from our simplest understanding of how the Galaxy chemically evolves, it is not expected that young stars in the solar vicinity would be less enriched than the Sun, which is much older. Moreover, the abundances obtained from Galactic H II regions were also lower than the accepted solar and in rough agreement with the B-star results. These inconsistencies between the abundances of young stars and H II regions, on one hand, and the Sun on the other, are reconciled nowadays with the revised solar abundances from 3-D models. In this context, it is therefore important and timely to derive accurate neon abundances in the atmospheres of early-type stars. In this study, we report on non-LTE (NLTE) neon abundance calculations for a sample of B stars members of the Orion association. The Ne abundances in young stars can independently shed light on the issue related to the reference Ne abundance in the Galaxy.
2 OBSERVATIONS
The target stars are OB main-sequence members of the different stellar subgroups of the Orion association and drawn from the sample analyzed by Cunha & Lambert (1992, 1994). Eleven stars were observed with the 2.1m telescope at the McDonald Observatory at high resolution (R=55,000) using the Sandiford echelle. The spectra were obtained on Oct 27, 1994 and these have 26 echelle orders covering the total spectral range between 5390 and 6680 Å. The spectra were reduced with IRAF data package following standard procedures.
3 Non-LTE Abundance Calculations
The stellar parameters for the sample stars were derived in Cunha & Lambert (1992). Non-LTE model atmospheres were computed using the TLUSTY code (Hubeny 1988, Hubeny & Lanz 1995). The model calculations assumed a constant microturbulence of 2 km/s. Preliminary models for this study were taken from an extensive grid of NLTE line-blanketed model atmospheres of B stars (Lanz & Hubeny, in prep.). The final models were computed for the actual effective temperatures and surface gravities of our program stars, and adopting an extended Ne model atom. The BSTAR model grid is analogous to our OSTAR2002 grid (Lanz & Hubeny 2003), the only difference being the addition of lower ionization stages of the most important species. Concretely, the following ions were considered explicitly in the BSTAR grid models: H I–II, He I–III, C I–V, N I–VI, O I–VI, Ne I–V, Mg II–III, Al II–IV, Si II–V, S II–VI, and Fe II–VI.
The Ne model atom constructed consists of 79 levels of Ne I, 138 levels of Ne II, 38 levels of Ne III, 12 levels of Ne IV, plus ground state of Ne V. The energies of the levels were taken from the Opacity Project database TOPBASE (Cunto et al. 1993), updated by the more accurate experimental level energies from the Atomic and Spectroscopic Database at NIST (Martin et al. 1999) whenever available. The -values were taken from the same sources. However, since the -coupling, on which the Opacity Project calculations are based, is rather inaccurate for Ne I, we have used results and the procedure suggested by Seaton (1998) to transform the level energies (and designations) from -coupling to the more appropriate -coupling. Also, we used a model atom that treats explicitly the fine structure of multiplets. The photoionization cross-sections were taken from TOPBASE, and the collisional excitation rates were considered using the Van Regemorter formula, and for collisional ionization using the Seaton formula – for a synopsis of expressions, see Hubeny (1988).
The detailed synthetic spectra were computed using the Interactive Data Language (IDL) interface SYNPLOT (Hubeny, unpublished) to the spectrum synthesis program SYNSPEC (Hubeny, Lanz, & Jeffery 1995). The abundances were obtained from the best fits between observed and synthetic spectra of 8 Ne I transitions: 6506.5, 6402.2, 6383.0, 6334.5, 6266.5, 6163.5, 6143.1 and 6096.2 Å. We have computed NLTE line profiles (using NLTE atomic level populations of all atoms and ions computed by TLUSTY). When computing detailed synthetic spectra we found that the best fits to the observations were obtained for a microturbulent velocity around 5 km/s, although the abundance results were quite insensitive to the microturbulence parameter.
The nature of NLTE effects in Ne I line formation was already discussed by Auer & Mihalas (1973), Dworetsky & Budaj (2000), and, in particular, by Sigut (1999). Our models do not offer anything fundamentally different from these studies; only we are using significantly more extended model atoms, more recent atomic data, and fully blanketed model atmospheres. The nature of NLTE effects for above listed optical lines of Ne I was already explained in the earlier studies, namely since the lower levels of the optical lines are connected to the ground state of Ne I by resonance lines that are located in far UV, they are essentially in detailed balance with the ground state. The optical lines thus behave like classical lines in a two-level atom, that is the lower level is somewhat overpopulated, while the upper level is depopulated (because of an imbalance of the number of excitations compared to de-excitations caused by the photon escape through the boundary). The source function is thus lower than the Planck function, and the optical lines are consequently predicted stronger than in LTE. This in turn means that the deduced NLTE abundances are expected to be lower that the LTE ones.
Our results are in qualitative agreement with the earlier studies. We compared our calculations with the two previous studies (Sigut 1999 and Dworetsky & Budaj 2000). For one target star, HD35299, we measured equivalent widths for the Ne I lines and computed Ne abundances for an assumed microturbulence =5.0 km/s. A modest systematic difference was obtained for HD35299: Ne(This study - Sigut) = 0.1 dex, for an average of all lines (eqws computed by Sigut, priv. comm.) Dworetsky & Budaj (2000), as discussed in their paper, find good agreement with the results by Sigut (1999). Dworetsky & Budaj have also used TLUSTY for their study, and made their TLUSTY-compatible Ne I atomic data input available online. We tested their input data, and found that they inadvertently set up parameters for the collisional excitation rates in such a way that they were effectively set to 0 (which means they they in fact maximized possible NLTE effects). When we artificially modified our data by setting collisional excitation rates also to zero, we obtained an excellent agreement with Dworetsky & Budaj. This also demonstrates that the collisional excitation rates are not critical for basic features of Ne I NLTE line formation.
3.1 Ne Abundance Results and Previously Derived O Abundances
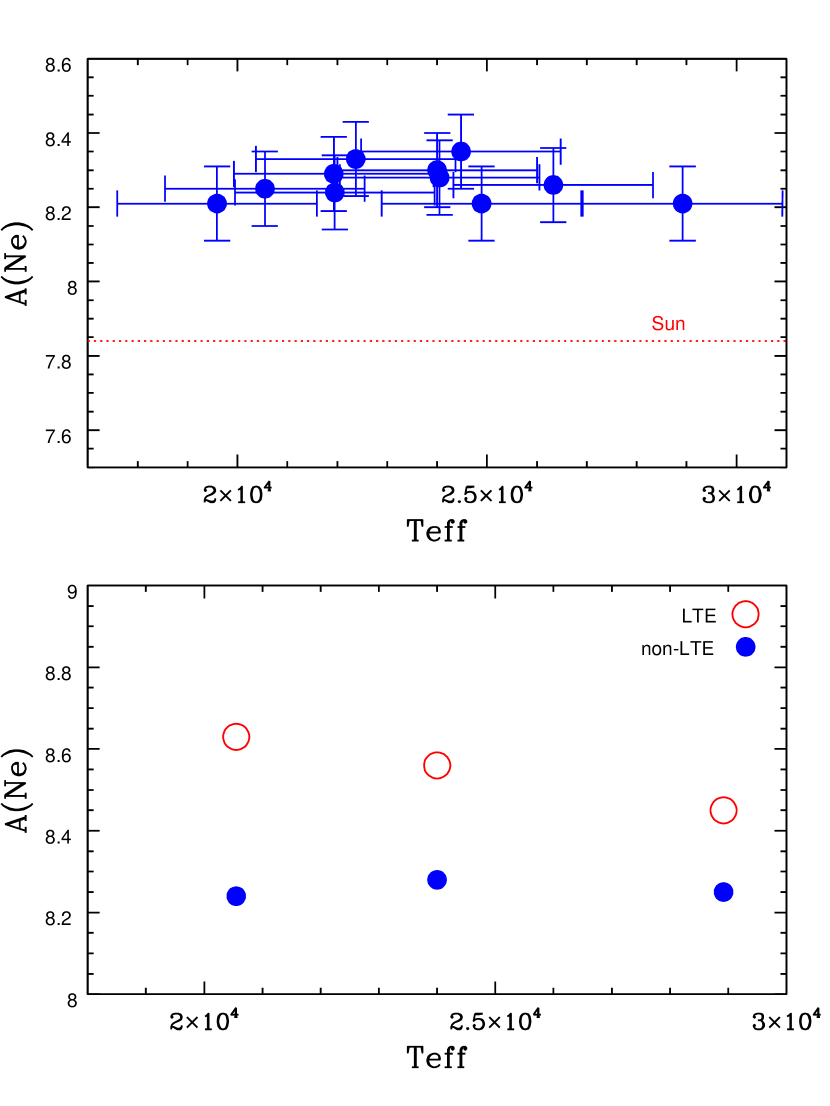
The studied Orion stars span a significant range in effective temperature, from 20000 K to 29000 K (Table 1). In Figure 1 (top panel) we show that there is no significant trend of the Ne abundances with the stars’ effective temperature, indicating the absence of important systematic errors in this study. A comparison between the LTE and NLTE abundance trend with is shown in the bottom panel of Figure 1. There is a trend of the derived LTE abundances with , which again demonstrates the inadequacy of LTE for abundance determinations, as already shown by earlier investigations. The LTE line profiles were obtained by setting the Ne level populations to their LTE values, while the atmospheric structure (temperature, electron density, etc.), as well as level population of other species, were kept at their NLTE values. We stress that such line profiles are different from truly LTE line profiles (computed for a consistent LTE structure and LTE level populations of all species), but our “LTE” line profiles best demonstrate NLTE effects in determining the Ne abundance. The fact that LTE abundances are larger than NLTE ones is in fact quite comforting in the context of Ne abundance determinations, because otherwise one may be worried whether the deduced high Ne abundance is an artifact of some spurious NLTE effect caused for instance by some inadequacy in atomic data. However, since the NLTE abundance is smaller, this potential worry can be ruled out.
The Ne abundances obtained for the targets (listed in Table 1) are quite homogeneous and show a small scatter that can be completely explained in terms of uncertainties in the abundance determinations. The average Ne abundance for all target stars is A(Ne)=8.27 0.05. The uncertainties in the Ne I abundances can be estimated from the sum in quadrature of the abundance uncertainties due to errors in the adopted stellar parameters, microturbulence, continuum location, as well as, atomic data. We estimate that our derived Ne abundances are accurate to within roughly 0.1 dex. The data available to us do not allow for Ne II abundances to be derived in this study as a consistency check. (We note that Kilian-Montenbruck et al. (1994) found high LTE Ne II abundances for OB stars.)
It is the Ne/O ratio, and not only neon, that is obtained from abundance measurements in the solar corona and this ratio constitutes an important ingredient in the construction of solar models. Before a comparison can be done with the Orion results for B stars, it is important to stress that the oxygen and neon abundances for the Orion targets were not derived homogeneously. The methodology presented in this study to derive neon abundances consisted of a full NLTE treatment, including NLTE line formation and the computation of fully-blanketed model atmospheres in NLTE. For oxygen, however, we adopt the previously published results from Cunha & Lambert (1994) which were derived in LTE and using Kurucz LTE model atmospheres, and finally corrected by means of the NLTE calculations by Becker & Butler (1988). It is important then to verify whether the previously derived oxygen abundances for Orion are consistent with results from the more sophisticated calculations presented here for neon.
As a consistency check on the published oxygen results, we re-derived the oxygen abundance for one of the Orion stars, HD35299, using TLUSTY/SYNSPEC. We adopted the same published equivalent widths for O II lines and same stellar parameters but used the TLUSTY NLTE model atmospheres calculated for the Ne analysis. We calculated O II abundances versus the microturbulence parameter and derived = 5 km/s and an oxygen abundance A(O)= 8.65 0.05. This abundance compares favorably with the oxygen abundance obtained in Cunha & Lambert (1992), within the uncertainties. Such agreement justifies the adoption of the published oxygen results in order to investigate Ne/O ratios.
4 DISCUSSION
Solar photospheric abundances can be readily compared to meteoritic C1 chondrite abundances and good agreement is found for most of the elements, or more specifically, for those elements that form rocks (see e.g. Lodders 2003). Noble gases, as well as carbon, nitrogen and oxygen are volatiles and their abundances are therefore significantly depleted in meteorites. For C,N, and O one can rely on abundances measured in the solar photospheres, available from both 1-D and 3-D model atmospheres calculations. For neon, however, the solar abundances are subject to further uncertainties due to the absence of photospheric lines because even the lower excited states of the Ne atom have very high energy. Alternatively, Ne abundances in the Sun are inferred from measurements of Ne/O in the solar coronal gas, solar wind and solar energetic particles. The most recent assessment of the Ne abundance in the Sun is obtained from measurements of Ne/O in the solar corona and from energetic particles is A(Ne)=7.84 (Asplund, Grevesse & Noels 2005). The solar value according to Lodders (2003) is just slightly higher (A(Ne)=7.87).
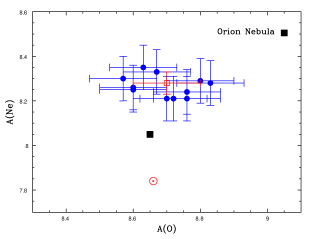
The neon abundances derived here for a sample of early-type stars in the Orion association are found to be quite homogeneous. The average neon abundance for the studied stars (A(Ne)=8.27 0.05) is higher than the quoted solar value by 0.4 dex. In Figure 2 we show our Ne results versus oxygen abundances. The average oxygen abundance for the sample Orion stars is: A(O)=8.70 0.09. which is entirely consistent with a single oxygen abundance and agrees with the solar abundance of A(O)=8.66 (Asplund et al. 2005).
Recent results from detailed calculations of oxygen abundances in a sample of 3 B0.5V stars in the Orion nebula indicate an average oxygen abundance of A(O)=8.63 0.03 (Simon-Diaz et al. 2006). The oxygen abundance data presented here is a subsample of the stars analyzed in Cunha & Lambert (1994). For the full sample with 18 stars this previous study obtained an oxygen abundance spread which was larger: A(O)= 8.72 0.13, but marginally within the abundance uncertainties. Our target stars in this study, however, span a tighter range in oxygen abundances (A(O)= 8.70 0.09) and are considered to represent a single oxygen abundance for all purposes. Therefore, the B stars in the Orion association can be represented by a Ne/O ratio of 0.38, which is much higher than the currently adopted solar value of 0.15 (Asplund et al. 2005).
The Orion Nebula has been the most extensively studied galactic H II region and is recognized as the standard reference for nebular abundance studies in the Galaxy. Recently, Esteban et al. (2004) conducted a careful emission line study of several elements in the Orion nebula and obtained A(O)=8.65 and A(Ne)=8.05 (or, Ne/O=0.25); these are gas abundances and corrections for any element trapped in grains have not been considered. This nebular result is lower than our average for the Orion stars but higher than the solar value (see Figure 2).
5 Conclusions
Measurements of neon abundances in a variety of objects that can help define the uncertain neon abundance in the Sun are potentially of great importance for solar physics. We find the Ne abundance in B stars members of the Orion association is significantly higher than the solar value by roughly 0.4 dex ( 2.5X). We argue that the Ne abundances measured in young OB stars should be a good representation of the solar chemical composition, as is indicated from the good agreement between the abundances in B stars and Sun for other elements such as C, N, and O. The high Ne abundances obtained here come to the rescue of the solar models that require, according to Bahcall, Basu & Serenelli (2005), an increase in the Ne abundance by 2.8 0.4.
References
- (1) Anders, E. & Grevesse, N. 1989, Geochimica et Cosmochimica Acta, vol. 53, p. 197
- (2) Antia, M., & Basu, S. 2005, ApJ, 621, L85
- (3) Asplund, M. 2005, Ann. Rev. Astron. Astrophys., 43, 481
- (4) Asplund, M., Grevesse, N., & Sauval, A. J.2005 In Cosmic Abundances as Records of Stellar Evolution and Nucleosynthesis, ed. F. N. Bash, & T. G. Barnes p. 25
- (5) Auer, L. H., & Mihalas, D. 1973, ApJ, 184, 151
- (6) Bahcall, J. N., Basu, S., & Serenelli, A. M. 2005, ApJ, 631, 1281
- (7) Bahcall, J. N., Serenelli, A. M., Basu, S. 2005b, ApJ, 621, L85
- (8) Becker, S. R. & Butler, K. 1988, A&A, 201, 232
- (9) Cunha, K. & Lambert, D.L. 1992, ApJ, 399, 586
- (10) Cunha, K. & Lambert, D.L. 1994, ApJ, 426, 170
- (11) Cunto, W., Mendoza, C., Ochsenbein, F., & Zeipen, C. J. 1993, A&A, 275, L5
- (12) Drake, J. J., & Testa, P. 2005, Nature, 43, 525
- (13) Dworetsky, M. M., & Budaj, J. 2000, MNRAS, 318, 1264
- (14) Guzik, J. A., Watson, L. W., & Cox, A. N. 2005, ApJ, 627, 1049
- (15) Grevesse, N., & Sauval, A. J. 1998, Space Sci. Rev. 107, 665
- (16) Hubeny, I. 1988, Comput. Phys. Commun., 52, 103
- (17) Hubeny, I., & Lanz, T. 1995, ApJ, 439, 875
- (18) Hubeny, I., Lanz, T., & Jeffery, C. S. 1994, SYNSPEC - A User’s Guide, in Newsletter on Analysis of Astronomical Spectra No 20, St. Andrews Univ.
- (19) Kilian-Montenbruck, J., Gehren, T., & Nissen, P. E. 1994, A&A, 291, 757
- (20) Lanz, T., & Hubeny, I. 2003, ApJS, 146, 417
- (21) Lester, J. B, Gray, R. O., & Kurucz, R. L. 1986, ApJS, 61, 509
- (22) Martin, W. C., Sugar, J., Musgrove, A., Wiese, W. L., & Fuhr, J. R. 1999, NIST Atomic Spectra Database
- (23) Nieva, M.F., & Przybilla, N. 2006, ApJ, 639, L39
- (24) Seaton, M. J. 1998, J. Phys. B, 31, 5315
- (25) Sigut, T. A. A. 1999, ApJ, 519, 313
- (26) Simon-Diaz, S., Herrero, A., Esteban, C., & Najarro, F. 2006, A&A, 351, 366
| Star | Teff | Log g | A(Ne) | A(O) |
|---|---|---|---|---|
| HD35039 | 20550 | 3.74 | 8.25 | 8.60 |
| HD35299 | 24000 | 4.25 | 8.30 | 8.57 |
| HD35912 | 19590 | 4.20 | 8.21 | 8.70 |
| HD36285 | 21930 | 4.40 | 8.29 | 8.80 |
| HD36351 | 21950 | 4.16 | 8.24 | 8.76 |
| HD37356 | 22370 | 4.13 | 8.33 | 8.67 |
| HD37209 | 24050 | 4.13 | 8.28 | 8.83 |
| HD37744 | 24480 | 4.40 | 8.35 | 8.63 |
| HD36959 | 24890 | 4.41 | 8.21 | 8.76 |
| HD36591a | 26330 | 4.21 | 8.26 | 8.60 |
| HD36960 | 28920 | 4.33 | 8.21 | 8.72 |
Note. — (a): Recent results from IUE flux, 2MASS and Johnson magnitudes (Nieva & Przybilla 2006) indicate quite good agreement with the adopted stellar parameters.