CCD Photometry of the globular cluster M2. RR Lyrae physical parameters and new variables††thanks: Based on observations collected at the Observatorio del Teide, Tenerife, Spain, and the Indian Astrophysical Observatory, Hanle, India.
Abstract
We report the results of CCD and photometry of the RR Lyrae stars in M2. The periodicities of most variables are revised and new ephemerides are calculated. Light curve decomposition of the RR Lyrae stars was carried out and the corresponding mean physical parameters [Fe/H]= , = 6276 K, log and from nine RRab and [Fe/H]= , , = 7215 K, log and from two RRc stars were calculated. A comparison of the radii obtained from the above luminosity and temperature with predicted radii from nonlinear convective models is discussed. The estimated mean distance to the cluster is kpc. These results place M2 correctly in the general globular cluster sequences Oosterhoff type, mass, luminosity and temperature, all as a function of the metallicity. Mean relationships for , log , and as a function of [Fe/H] for a family of globular clusters are offered. These trends are consistent with evolutionary and structural notions on the horizontal branch. Eight new variables are reported.
keywords:
Globular Clusters: M2 – Variable Stars: RR Lyrae, Blazhko effect1 Introduction
RR Lyrae stars are of particular importance in the age and distance determination to ancient stellar systems, such as globular clusters. Their usefulness is based in the fact that their light curves are easily distinguishable and their high intrinsic brightness allows their detection in systems of the Local Group. Their well defined absolute magnitude allows using them as standard candles in the cosmic distance scale (e.g. Alcock et al. 2004 for the LMC).
The RR Lyrae stars have been used in the determination of absolute ages of globular clusters, by measuring the magnitude difference between the main sequence turn off point and the horizontal branch (HB), on which the RR Lyrae stars reside. This is a useful reddening free parameter that helps in tracing the early stages of the formation of our Galaxy. This, however, requires a proper calibration of the absolute magnitude for the RR Lyraes.
The pulsational behaviour of RR Lyrae stars in globular clusters has been a subject of study for decades since it offers insight on stellar evolution in the HB stages. The mean periods of fundamental pulsators (type RRab) divide globular clusters into two groups, the Oosterhoff type I (OoI) with smaller than 0.6 days and the Oosterhoff type II (OoII) with larger than 0.6 days (Oosterhoff 1939). Recent light curve Fourier decomposition calculations have clearly shown that RR Lyrae stars in OoII clusters are, on average, more luminous, more massive and cooler than in OoI clusters, and that these quantities are closely correlated with the mean cluster metallicity. For example these stars have longer periods in metal poor clusters than in metal rich clusters (e.g. Simon & Clement 1993; Clement & Shelton 1997; Kaluzny et al. 2000; Arellano Ferro et al. 2004; Arellano Ferro et al. 2006 (see their Tables 8 and 9)).
On the other hand the period distribution of fundamental periods ( for RRab stars), and the fundamental periods calculated from the first overtone period and the period ratio ( for RRc stars), as well as the relative number of RRc and RRab stars, provide important insights relevant to the instability strip structure and HB structure and evolution (Castellani et al. 2003). Nevertheless, such studies are strongly limited by bona fide completeness of the sample of RR Lyrae pulsators in a cluster. It is evident from recent works that a substantial number of RR Lyrae stars can be discovered when new image-subtraction techniques (Alard 2000; Alard & Lupton 1998; Bond et al. 2001; Bramich et al. 2005) are applied to CCD images of globular clusters (e.g. Lee & Carney 1999a; Kaluzny et al. 2001; Clementini et al. 2004).
The latest CCD study of M2 (NGC 7089) was published by Lee & Carney (1999a) (hereinafter LC99). These authors reported 13 new RR Lyraes, for a total of 34 variables in the cluster, 30 of which are RR Lyrae stars. They calculated the ratio n(c)/n(ab+c) = 0.40, which approaches the mean typical value of 0.44 in OoII clusters. Hence, not many undiscovered RR Lyraes are expected. However, since these authors did not perform a light curve decomposition analysis, we decided to supplement their data with new observations and use the two data sets to refine the ephemerides, determine the mean physical parameters of the RR Lyrae stars from the Fourier decomposition technique, compare the results with those of other similarly studied OoI and OoII clusters and, in passing, search for new variables. The effort was not fruitless.
In Sect. 2 we describe the observations and data reductions. In Sect. 3 we calculate new ephemerides, new times of maximum, discuss individual objects and report new variables. In Sect. 4 we calculate the physical parameters using the light curve decomposition method. In Sect. 5 we discuss the results in the wider context of other globular clusters and in Sect. 6 we state our conclusions.
2 Observations and Reductions
The observations used in the present work, performed using the Johnson and filters, were obtained from June 6 to 19, 2002 with the 0.82 m telescope of the Observatorio del Teide, Tenerife, Spain. The seeing conditions were good, with an estimated arcsec. The detector was a Thompson CCD of 1024 1024 pixels of 19 square microns, these images are of approximately arcmin2. Exposure times were 900 sec and 500 sec in the and filters, respectively. A total of 60 images in and 60 in were obtained. Higher resolution images for proper star identification were acquired with the 2.0 m Himalayan Chandra Telescope (HCT) of the Indian Astrophysical Observatory (IAO).
Differential photometry by the image subtraction method, described in detail by Bond et al. (2001) and Bramich et al. (2005), was performed. This procedure involves the matching of a high quality reference image to each image in the time series, by solving for a spatially-varying convolution kernel and differential sky background function. Difference images are constructed via the subtraction of the convolved reference image from the time series images. Photometry on the difference images yields differential fluxes for each star relative to the flux from the reference image. Conversion of the light curves to magnitudes requires an accurate measurement of the reference flux.
We measured the stellar fluxes on the reference frame using DAOPhot (Stetson 1987). However, the point-spread function (PSF) on the images was highly non-gaussian and not fully modelled by the DAOPhot routine. The reason for the poor PSF seems to be related with some optical misaligment of the telescope at the time of our observations. Hence our reference fluxes contain systematic errors that may affect the amplitude of the variable star lightcurves. Fourier decomposition and the subsequent calculation of physical parameters is mainly light curve shape dependent, and we can use our light curves for that purpose.
The instrumental magnitudes were converted to the standard system by using 168 standard stars in the interval listed by Stetson (2005) in the M2 field. The transformation equation had a linear form , without the need of a quadratic term; moreover, the standard stars span a range from to and no significant colour term was found.
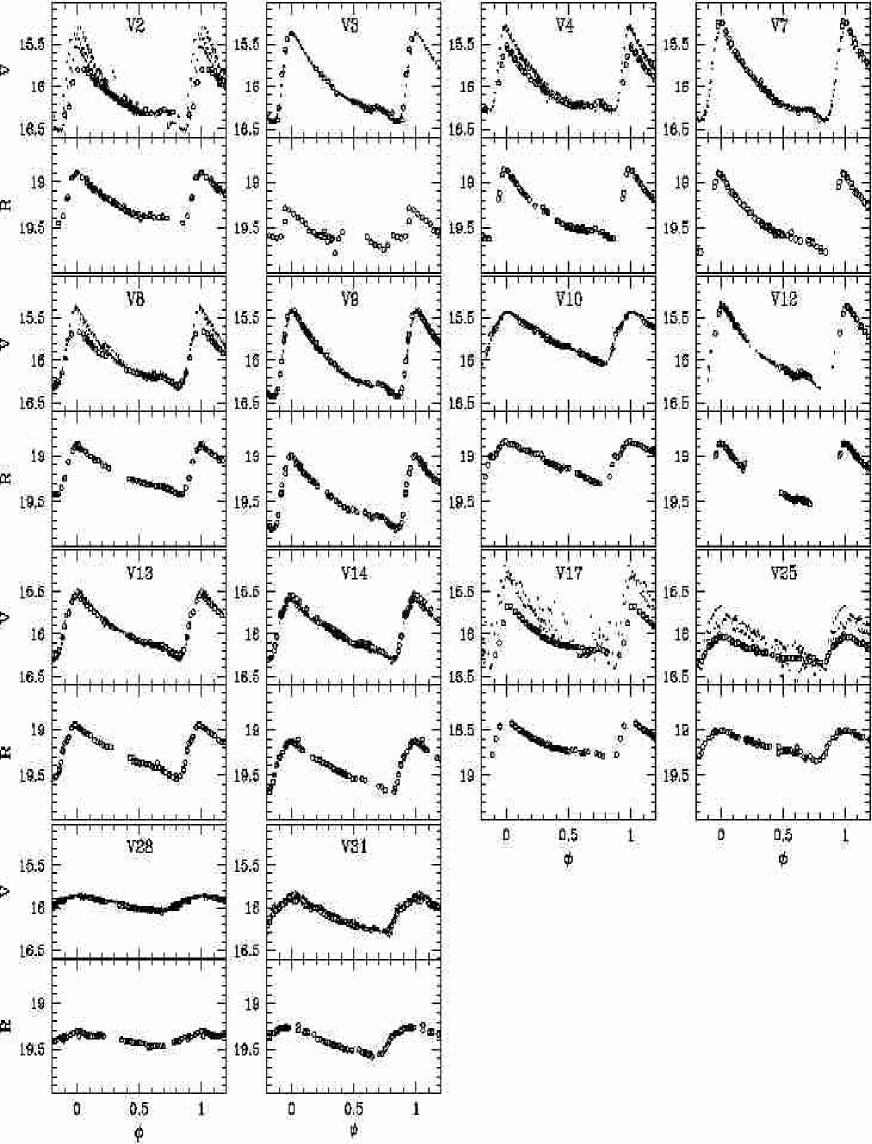
We noticed that the difference in magnitudes between our data and LC99 light curves changes from star to star, which is likely due to poor PSF quality. Then, we have shifted in magnitude each of our V light curves in order to match the LC99 photometry. Once the correct shift is applied, both data sets agree very well, as can be seen in Fig. 1. Once the vertical matching was accomplished we noticed a small dispersion along the time axis. Since our observations were gathered between 4 and 6 years after those of LC99, we decided to attempt a refinement of the periods, using both data sets. The string-length method, frequency analysis and Fourier fits were used to detect and refine period values. The complete set of periods used below for the Fourier decomposition are listed in Table 1, where the newly determined periods are presented alongside the periods from LC99. The differences in the periods are small but in several cases significant when phasing the light curves. The error on the refined values of the periods is d.
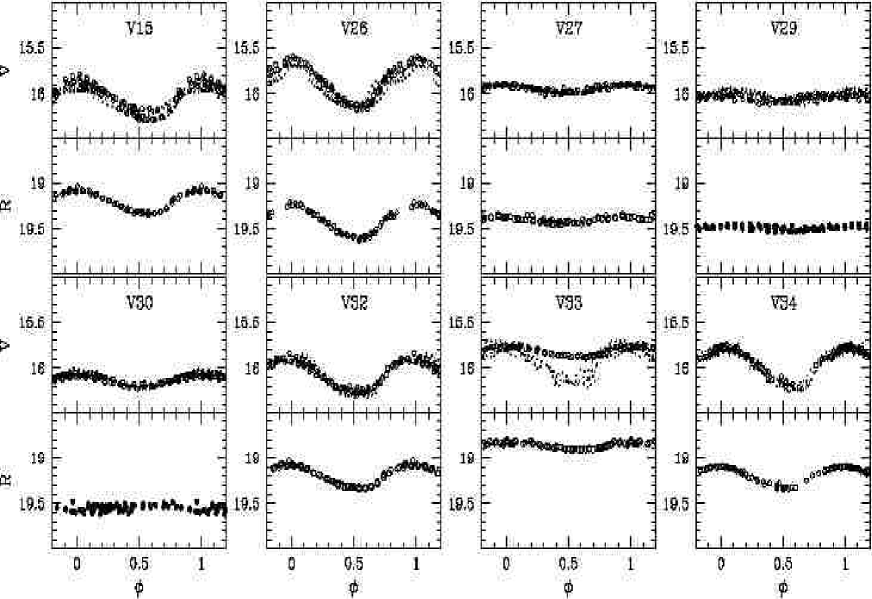
In Figs. 1 and 2 the light curves in and for the previously known RR Lyraes are displayed. Different symbols are used for the observations of LC99 and our own as described in the caption, which illustrates the general good agreement between the two data sets.
| Variable | Type | Old Period | New Period | New Epoch |
|---|---|---|---|---|
| (days) | (days) | (+ 240 0000) | ||
| V2 | ab | 0.5278619 | 0.527840 | 52445.561 |
| V3 | ab | 0.6197084 | 0.619713 | 52445.165 |
| V4 | ab | 0.5642512 | 0.564243 | 52445.629 |
| V7 | ab | 0.5948665 | 0.594868 | 52445.347 |
| V8 | ab | 0.6437059 | 0.643690 | 52445.287 |
| V9 | ab | 0.6092938 | 0.609295 | 52445.582 |
| V10 | ab | 0.8757413 | 0.875744 | 52445.090 |
| V12 | ab | 0.6656063 | 0.665607 | 52445.248 |
| V13 | ab | 0.7066260 | 0.706619 | 52445.074 |
| V14 | ab | 0.6937767 | 0.693788 | 52445.442 |
| V15 | c | 0.3007852 | 0.300785 | 52445.586 |
| V17 | ab | 0.6364715 | 0.636444 | 52445.474 |
| V25 | ab | 0.7287186 | 0.728720 | 52445.466 |
| V26 | c | 0.4195213 | 0.412376 | 52445.461 |
| V27 | c | 0.3141578 | 0.314158 | 52445.473 |
| V28 | ab | 0.8237775 | 0.823797 | 52445.210 |
| V30 | c | 0.2728723 | 0.272871 | 52445.582 |
| V31 | ab | 0.7887144 | 0.788715 | 52445.005 |
| V32 | c | 0.3619382 | 0.367021 | 52445.655 |
| V34 | c | 0.3914157 | 0.391414 | 52445.639 |
3 Discussion of individual objects and new variables
3.1 Comments on individual variables
For stars of steady amplitude (V3, V7, V9, V10, V12, V13, V27, V31 and V34), the agreement between the light curves of LC99 and those in the present work is excellent. No further discussion is needed in these cases. Other stars deserve some comments.
V2. This star is labelled as a Blazhko variable in the catalogue of Clement (2002). The appearance of the light curve in Fig. 1 indeed suggests that the effect is present. The detailed plot of the light curve displayed in Fig. 3 confirms the Blazhko nature of the variable and allows an estimate of the magnitude variation of the maximum at different epochs (Table 2). With only five measurements of the maximum light momenta it is difficult to characterize the Blazhko periodicity. Nevertheless, the frequency analysis detected a secondary peak at 1.8870 c/d, very close to the main peak at 1.8945 c/d, which suggest a Blazhko periodicity of 133 d, however, the value of the secondary peak is not fully reliable owing to the poor phase coverage of the Blazhko cycle.

| HJD | |
|---|---|
| 15.532 | 245 0333.667 |
| 15.309 | 245 0358.476 |
| 15.374 | 245 0622.921 |
| 15.309 | 245 1057.877 |
| 15.878 | 245 2436.609 |
V4, V8, V14. These stars have not been noticed before as having the Blazhko effect. However, the LC99 light curves show some cycle–to–cycle variations. Moreover, our data have a different amplitude in all three cases, thus, the possibility of a long–term Blazhko effect is just plausible, but not definitely proven.
V15. The light curve in our Fig. 2 and in Fig.5 of LC99, make the star suspected of having cycle–to–cycle variations. Since our analysis did not detect a radial double–mode pulsation, the only possibility is a Blazhko effect. Even though the time series has large gaps, we can tentatively explain the light curve with a close doublet of frequencies (=3.3246 and =3.2101 c/d or a Blazhko period of 8.7d). More observations are required to define better this doublet, since it seems too much separated (Moskalik & Poretti 2003).
V17 and V25. Our light curves display a lower amplitude than in LC99, but they are much more accurate and rule out the possibility of a double–mode pulsation or a Blazhko effect. Indeed, the inspection of these stars on the reference image reveal that they are blends, and hence our amplitudes are underestimated.
V26. This star is suspected of being a double mode star in the list of Clement (2002). However when subdividing the data sets of LC99 and our own into subsets, the resulting light curves look very stable although they show considerable time shifts ranging between 0.004 d and 0.062 d. Once the subsets are corrected by these shifts, a clean sinusoidal lightcurve is obtained with a period of 0.412376 days. Thus the star is not a double mode pulsator and the shifts can possibly be explained as light time effects if this RRc is a member of a binary system. More observations would be needed to confirm this possibility.
V28. This variable seems to be rather peculiar, displaying a lower amplitude light curve than the other RRab stars. It is the longest period RR Lyrae variable in M2 (see Table 1), and its physical parameters are clearly discordant with those of the other RRab stars, with a particularly low and large luminosity and radius. The possibility of an unseen blend affecting its light curve can not be discarded. The star could be an anomalous Cepheid, but its mean magnitude (=15.945) is quite normal for an RR Lyrae variable. Owing to this peculiar behaviour, we didn’t include its physical parameters in Tab. 6.
V30. This star is also suspected of being a double mode star in the list of Clement (2002). However we find it to be monoperiodic with a period of 0.272871 days. The scatter in the observations of both LC99 and our own is a bit large.
V32. The LC99 data show some scatter but no traces of a second periodicity have been found performing a frequency analysis. However, when splitting the time series into different subsets, we clearly evidenced the same light curve displaced in time. Therefore, a light–time effect is plausible for this star. The light curve displayed in Fig. 2 has been corrected of this effect.
3.2 Negative detections
V16. This star is reported as variable in the catalogue of Clement (2002) and it is identified in the map of LC99. However we find no star in the position marked by these authors nor variablility in nearby stars. Therefore we have not included this star in Fig. 1 or in the subsequent analysis.
V18-21. These variables were not in the field of our CCD images.
V22-24. These stars, convincingly variables as reported by LC99, were identified in our images, but no significant light variations were detected in either the or filters despite not being in particularly crowded regions.
V29, V33. These stars are a blend in our images and the resulting amplitudes are very small. Our data are not useful to improve LC99 results.
3.3 Newly discovered variables
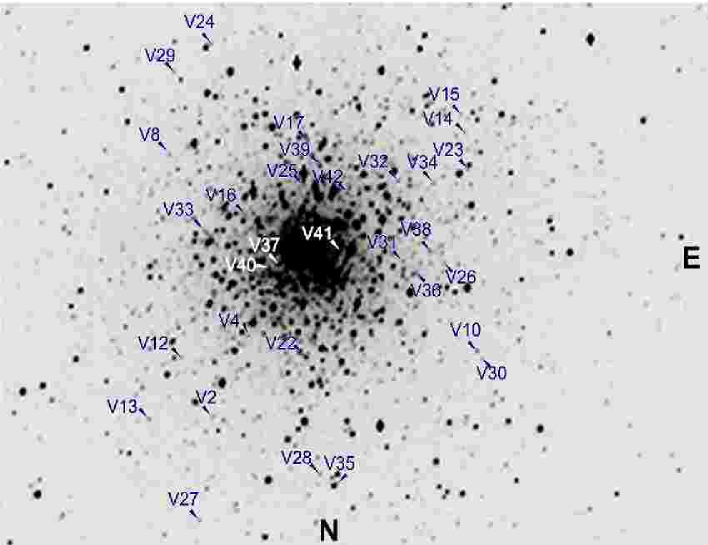
We have detected clear light variations in 8 stars in the field of M2, not previously reported as variables. The corresponding identifications are shown in Figs. 4 and 5. In Table 3, we report the period and epoch of maximum light, and the Bailey’s type for each new variable. The error on the periods of the new variables is d.
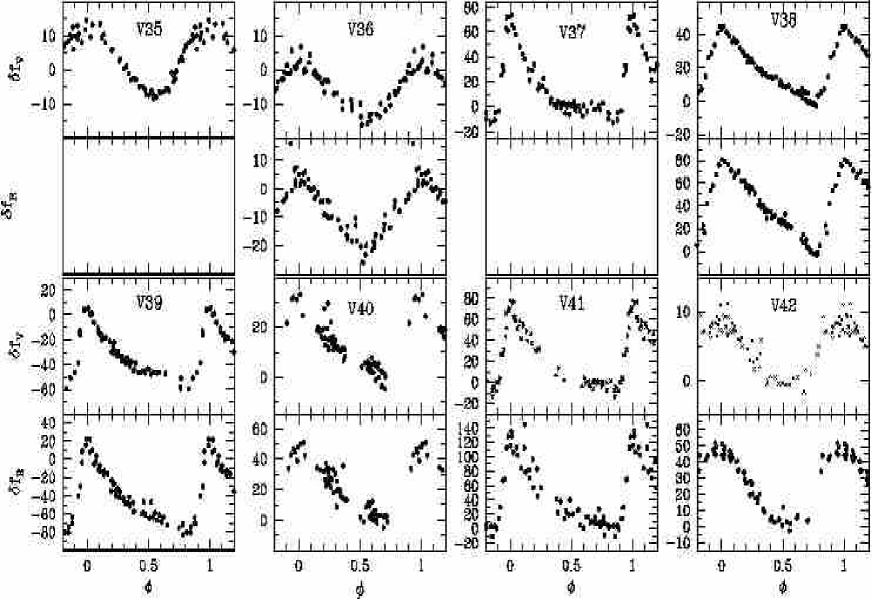
The light curves of the new variables are shown in Fig. 6. Due to the problem with the PSF of our images described in Sect. 2, and the fact that these new variables are all blends to some degree (see Fig. 5), we cannot assign a standard magnitude for the new variables. The light curves are therefore displayed as differential fluxes in units of ADU/sec. Fourier decomposition and the subsequent calculation of physical parameters are mainly light curve shape dependent, and we can use the light curves for some of the new variables for that purpose. The new variables are:
| Variable | Type | Period | Epoch | ||
|---|---|---|---|---|---|
| (h m s) | (o ") | (days) | (+ 240 0000) | ||
| V35 | c | 21 33 28.0 | 0.32557 | 52445.517 | |
| V36 | c | 21 33 30.7 | 0.27078 | 52445.562 | |
| V37 | ab | 21 33 26.0 | 0.56668 | 52445.709 | |
| V38 | ab | 21 33 31.1 | 0.80735 | 52445.519 | |
| V39 | ab | 21 33 27.3 | 0.60781 | 52445.467 | |
| V40 | ab | 21 33 25.6 | 0.75173 | 52445.447 | |
| V41 | ab | 21 33 28.0 | 0.60532 | 52445.663 | |
| V42 | c | 21 33 28.3 | 0.32801 | 52445.497 |
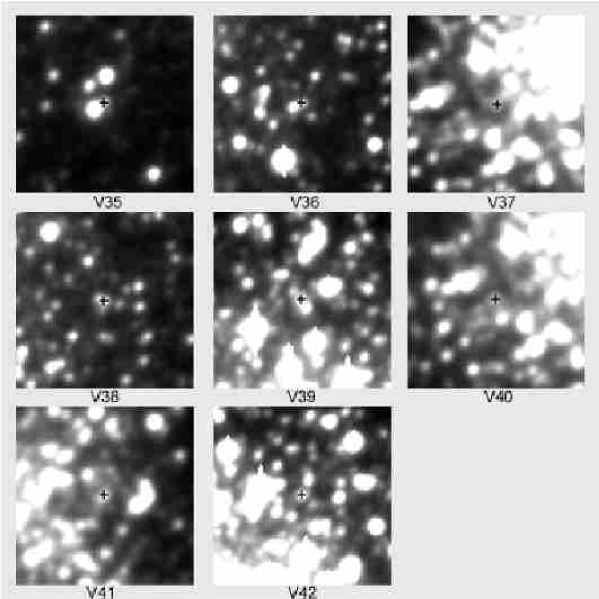
V35. This RRc variable appears in the V images as a blend with another brighter star by about two magnitudes, and it is not detected in the R images. This star will not be considered for physical parameter calculations.
V36 and V42. These are new RRc variables.
V37, V38, V39, and V40. These stars show clear light curves of the RRab type. V37 is not detected in the R images.
V41. This is a strong blend not resolved in our images. The variability in the difference images has a small offset relative to the centre of the contaminating brighter star. The variable is of type RRab.
4 Fourier light curves decomposition and physical parameters
The mathematical representation of the light curves is of the form:
| (1) |
where are magnitudes at time , the period and the epoch. A linear minimization routine is used to fit the data with the Fourier series model, deriving the best fit values of and of the amplitudes and phases of the sinusoidal components.
The fits are not shown in Figs. 1, 2 and 6 for simplicity and clarity. From the amplitudes and phases of the harmonics in eq. 1, the Fourier parameters, defined as , and , were calculated. The mean magnitudes , and the Fourier light curve fitting parameters of the individual RRab and RRc type stars in are listed in Table 4. The mean dispersion about the fits is about mag. These parameters will be used below to estimate the physical parameters of the stars.
The realization that light curve shapes and physical parameters are related, traces back to the paper of Walraven (1953). The relation between the pulsation of RR Lyrae variables and their physical parameters is obtained from hydrodynamic pulsation models of defined physical parameters, which are used to generate theoretical light curves. These curves are then fitted to obtain the corresponding Fourier parameters. Simon & Clement (1993) used hydrodynamic pulsation models to calibrate equations for the effective temperature , a helium content parameter , the stellar mass and the luminosity , in terms of the period and Fourier parameter for RR Lyrae stars of the Bailey’s type RRc (see eqs. 2, 3, 4 and 5). Recently, Morgan et al. (2005) have found several [Fe/H] - log P - relations for RRc variables, and we have adopted their eq. 5 (see eq. 6 below), with a quoted standard deviation of , to derive the [Fe/H] values given in Table 5. for the RRc stars can be estimated through the calibration given by Kovács (1998) (eq. 7). For the sake of clarity, all the equations used are listed below:
| (2) |
| (3) |
| (4) |
| (5) |
| (6) |
| (7) |
For the RRab stars we have used the eq. 3 of Jurcsik & Kovács (1996) for [Fe/H] (our eq. 8), eq. 2 in Kovács & Jurcsik (1996) for (our eq. 9), and eqs. 5 and 11 in Jurcsik (1998) for and log (our eqs. 10 and 11). The explicit formulae are:
| (8) |
| (9) |
| (10) |
| (11) |
The luminosity is derived through and the bolometric correction , adopting the relation of Sandage & Cacciari (1990):
| (12) |
With:
| (13) |
In the previous equations, and are phase shifts with
assumed cosines and sines Fourier series respectively, they are related by:
.
A thorough discussion of the uncertainties in the physical parameters, as obtained from the above mentioned calibrations, can be found in the work of Jurcsik (1998). The estimated uncertainties for log , log , log and [Fe/H] are and dex respectively.
We have carried out the Fourier decomposition of RRab stars using the combined data of LC99 and our own, except in those stars where the Blazhko effect is confirmed or suspected, i.e. in V2, V4, V8, V14 and V15. Moreover, V31, V40 and V41 data are less reliable owing to high scatter and/or gaps in the phase coverage: also these stars have been not considered. Tables 5 and 6 list the physical parameters we obtained.
We notice that the average value of [Fe/H] we derived from our RRab sample () is in close agreement with that reported by Kovacs & Walker (2001; [Fe/H]=). Also when including the two RRc stars (as Kovacs & Walker did), the average value ([Fe/H]=) is within the error bars.
It must be noticed that derived from eqs. 7 and 9 for RRc and RRab stars respectively, agree very well. However the luminosities for RRc stars derived from eq. 3 seem to be too large when compared with those for RRab variables (derived from eqs. 9, 12 and 13). This can be appreciated in Fig. 8 (open circles and crosses). The possibility that this is the result of the temperature dependence of the bolometric correction, , can be ruled out as it does not explain the difference in . Alternatively, if eq. 12 is used to transform the values, obtained with eq. 7, into , both RRc and RRab stars have similar luminosities (crosses in Fig. 8). Moreover, the values of the RRc stars reported in Table 4 (V27, V30, V32 and V34) are quite similar to those of the RRab stars. Then, some inconsistency seems to exists between the zero points of eq. 3 and eq. 7 for the RRc stars. This problem has been noticed and commented by Cacciari et al. (2005) whom opted for decreasing the magnitud scale derived from eq. 7 by 0.20 mag.
| Star (N) | ||||||
|---|---|---|---|---|---|---|
| V3 (9) | 16.007 | 0.362 | 0.084 | 4.03 | 2.05 | 0.17 |
| V7 (8) | 15.995 | 0.391 | 0.084 | 3.95 | 1.91 | 6.14 |
| V9 (8) | 16.038 | 0.356 | 0.077 | 3.98 | 1.99 | 0.10 |
| V10 (8) | 15.753 | 0.246 | 0.019 | 4.48 | 3.06 | 1.27 |
| V12 (8) | 15.957 | 0.349 | 0.075 | 4.17 | 2.29 | 0.64 |
| V13 (6) | 15.952 | 0.275 | 0.045 | 4.19 | 2.33 | 0.61 |
| V17 (8) | 16.056 | 0.196 | 0.052 | 3.89 | 1.72 | 5.98 |
| V25 (5) | 16.211 | 0.118 | 0.011 | 4.03 | 2.18 | 0.26 |
| V27 (1) | 15.954 | 0.047 | ||||
| V28 (2) | 15.945 | 0.079 | 4.79 | |||
| V30 (1) | 16.126 | 0.079 | ||||
| V31 (4) | 16.074 | 0.184 | 0.013 | 4.48 | 3.06 | 1.66 |
| V32 (4) | 16.085 | 0.201 | 0.005 | 4.66 | 3.50 | 2.70 |
| V34 (4) | 15.983 | 0.213 | 0.013 | 5.38 | 4.50 | 3.23 |
| V36 (2) | – | 0.077 | 4.36 | |||
| V37 (7) | – | 0.123 | 0.040 | 3.61 | 1.51 | 5.59 |
| V38 (4) | – | 0.107 | 0.008 | 4.39 | 2.63 | 0.89 |
| V39 (6) | – | 0.097 | 0.017 | 3.96 | 2.09 | 6.10 |
| V41 (4) | – | 0.048 | 0.014 | 4.03 | 2.31 | 0.06 |
| 0.002 | 0.003 | 0.003 | 0.07 | 0.11 | 0.18 | |
| 0.002 | 0.004 | 0.004 | 0.24 | 0.37 | 0.66 |
N: number of harmonics used to fit the light curve.
: after shifting our data to fit the LC99 magnitude scale.
V17 and V25 : light curve fitting on our data only.
5 Discussion
5.1 Oosterhoff type and RR Lyrae statistics
Including the 3 new variables the average value of the period for the RRc stars is 0.327 0.044 days. Comparing with the mean values for seven clusters reported by Clement & Rowe (1999), M2 fits better among the OoI type, although considering the standard deviations, the difference from the value in OoII type clusters of 0.36 days, is not significant. For the RRab stars, including the 5 new variables, we find an average period of 0.674 0.093 days which is typical of Oo II type clusters (average 0.65 days). Therefore, it seems that M2 is a borderline case between OoI and OoII type clusters.
| Star | [Fe/H] | (LT) | (PRZ) | D () | |||||
|---|---|---|---|---|---|---|---|---|---|
| V32 | 7202. | 0.75 | 1.754 | 0.26 | 0.60 | 0.713 | 0.710 | 10.71 | |
| V34 | 7228. | 0.66 | 1.725 | 0.28 | 0.48 | 0.673 | 0.728 | 10.64 | |
| Mean | 7215. | 0.71 | 1.74 | 0.27 | 0.54 | 0.69 | 0.68 | 10.67 | |
| 0.27 | 18. | 0.06 | 0.02 | 0.01 | 0.08 | 0.03 | 0.04 | 0.05 |
| Star | [Fe/H] | (LT) | (PRZ) | D () | |||
|---|---|---|---|---|---|---|---|
| V3 | 6380. | 0.72 | 1.622 | 0.729 | 0.767 | 10.49 | |
| V7 | 6424. | 0.72 | 1.621 | 0.720 | 0.756 | 10.40 | |
| V9 | 6384. | 0.73 | 1.618 | 0.727 | 0.762 | 10.58 | |
| V10 | 6084. | 0.52 | 1.702 | 0.808 | 0.854 | 10.22 | |
| V12 | 6320. | 0.68 | 1.634 | 0.744 | 0.785 | 10.40 | |
| V13 | 6231. | 0.67 | 1.645 | 0.758 | 0.800 | 10.47 | |
| V37 | 6287. | 0.85 | 1.579 | 0.714 | 0.744 | - | |
| V38 | 6049. | 0.64 | 1.660 | 0.790 | 0.833 | - | |
| V39 | 6331. | 0.87 | 1.561 | 0.705 | 0.762 | - | |
| Mean | 6276. | 0.71 | 1.63 | 0.75 | 0.79 | 10.42 | |
| 0.16 | 124. | 0.10 | 0.04 | 0.03 | 0.04 | 0.11 |
After LC99 reported 13 new RR Lyraes, for a total of 30 in the cluster, the ratio n(c)/n(ab+c) = 0.40 approached the mean typical value of 0.44 in OoII clusters and argued that not many undiscovered RR Lyraes are expected. We have found 8 new variables and a new value n(c)/n(ab+c) = 0.41 (negative detections excluded as variables ). We see no reason for not finding yet more RR Lyraes in this cluster if adequate monitoring is performed.
5.2 RR Lyrae radii
Given ( for RRab) and in Tables 5 and 6 one can derive the stellar radii. These radii depend fully on the semi-empirical relations and the hydrodynamical models used to calculate the luminosity and temperature, and they are included in Tables 5 and 6 under the name . Recently Marconi et al. (2005) have offered Period-Radius-Metallicity (PRZ) relationships for the RR Lyrae based on the nonlinear convective models of Bono et al. (2003 and references therein). In these relations the mean radius can be obtained from the pulsation period and the metallicity parameter . We have used these calibrations to calculate the radii of the RR Lyrae in M2 and compare them with the radii obtained independently from the light curve Fourier decomposition. In doing so, we have converted the [Fe/H] parameter into Z making use of the equation: where is the -enhancement factor with respect to iron (Salaris et al. 1993) which we adopt as . The radius can be estimated using the individual values of [Fe/H] in Table 6 or the average value . We have found that the differences in the estimated radii are not significant. Thus we report in Tables 5 and 6 the radii from P and Z, labelled (PRZ) using the average [Fe/H].

In Fig. 7 the comparison of (LT) and (PRZ) is shown. As seen in Tables 5 and 6, and Fig. 7, the (PRZ) values are systematically larger than (LT) by about 0.04. But given that both radii determinations are based on different models, methods and calibrations, and the sensitivity of radii to the opacity and other ingredients in the stellar models, both determinations can be considered quite consistent.
5.3 Distance to M2
To calculate the distance to the cluster we have calculated the distance moduli for each star, using the absolute magnitudes , given in Tables 5 and 6, derived from the Fourier parameters listed in Table 4. The total to selective extinction ratio , with (Harris 1996), was adopted to correct for interstellar extinction. For the RRab stars the values were obtained from the calibration of Kovács & Jurcsik (1996), while for the RRc stars the relation of Kovacs (1998) was used to derive .
We find a mean distance of kpc for the RRab and kpc for the RRc stars respectively. The uncertainty in these values is the standard deviation of the mean from individual stars. Our mean value of the distance to M2, kpc, from eleven RRab and RRc variables, is to be compared with the previous estimates of 11.5 and 11.2 kpc reported by Harris (1975; 1996), respectively.
5.4 On the evolutionary stage of the RR Lyrae stars
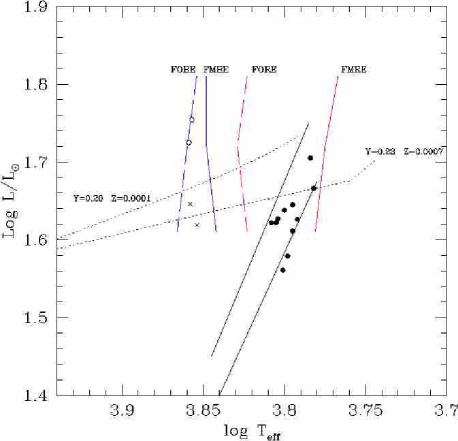
From the values in Tables 5 and 6 we can place the RRc and RRab stars in the HR diagram in Fig. 8. Two versions of the instability strip are shown. The vertical boundaries are the fundamental (continuous lines) and first overtone (dashed lines) instability strips from Bono et al. (1995), , Y= 0.24 and Z= 0.001 . As shown in the figure, the RRab variables populate the fundamental mode band in a narrow region in near the red edge of the theoretical instability strip, whereas the two RRc stars are located close to the first overtone blue edge. The small number of RRc variables in our diagram does not allow to discuss the suggestion of Bono et al. (1995) that in OoII clusters the transition between RRc and RRab variability occurs near the first overtone red edge, while in the OoI clusters the transition is found closer to the fundamental blue edge. The short continuous tilted lines are the empirical fundamental mode instability strip found by Jurcsik (1998) from 272 RRab stars of different metallicity, including variables from galactic field stars, many globular clusters and the Sculptor dwarf galaxy. It seems rather surprising that the empirical instability band is much narrower that the modelled one from Bono et al. (1995), even if it is defined from a very inhomogeneous sample of RRab variables. It is also clear that the location of the RRab stars in M2 follows closely the empirical strip both in slope and width.
Two values for the luminosity of the two RRc stars are plotted in Fig. 8. The upper values, open circles, correspond to the values obtained from eq. 3. The lower values are those obtained from the Mv values from eq. 7 and transformed into luminosity by the eqs. 12 and 13. While the apparent and absolute magnitudes of the RRc stars agree with those of the RRab stars, it is clear that the luminosity predicted from eq. 3 is large. We shall retain these large values for further comparison, in section 5.5, with RRc stars in other globular clusters studied by the Fourier decomposition technique.
The theoretical zero age horizontal branch (ZAHB) from the RRab models of Lee & Demarque (1990) for two chemical mixtures, (Y=0.20;Z=0.0001) and (Y=0.23; Z=0.0007) are also shown in Fig. 8. These two ZAHB‘s lie above the RRab stars. However, the estimated value of the relative abundance of helium for our RRc sample is Y=0.27, for which a model is not available. Since the luminosity of the ZAHB decreases with increasing Y, an extrapolation of Lee & Demarque (1990) models to larger values of Y would make the ZAHB match the distribution of RRab stars.
5.5 Physical parameter trends in globular clusters
The mean parameters for the RRc and RRab stars are compared for several clusters in Tables 7 and 8. These tables contain only those clusters for which their mean parameters have been obtained from the technique of RR Lyrae light curve Fourier decomposition and are updated versions of equivalent tables previously published by Arellano Ferro et al. (2004; 2006) and Kaluzny et al. (2000).
| Cluster | Oo type | [Fe/H] | No. of stars | ||||
|---|---|---|---|---|---|---|---|
| NGC 6171 | I | 6 | 0.53 | 1.65 | 7447 | 0.29 | |
| NGC 41471 | I | 9 | 0.55 | 1.693 | 7335 | 0.28 | |
| M5 | I | 7 | 0.58 | 1.68 | 7338 | 0.28 | |
| M52 | I | 14 | 0.54 | 1.69 | 7353 | 0.28 | |
| M33 | I | 5 | 0.59 | 1.71 | 7315 | 0.27 | |
| NGC 69344 | I | 4 | 0.63 | 1.72 | 7300 | 0.27 | |
| M25 | II | 2 | 0.54 | 1.739 | 7215 | 0.27 | |
| M9 | II | 1 | 0.60 | 1.72 | 7299 | 0.27 | |
| M556 | II | 5 | 0.53 | 1.75 | 7193 | 0.27 | |
| NGC 2298 | II | 2 | 0.59 | 1.75 | 7200 | 0.26 | |
| M927 | II | 3 | 0.64 | 1.77 | 7186 | 0.26 | |
| M68 | II | 16 | 0.70 | 1.79 | 7145 | 0.25 | |
| M15 | II | 6 | 0.73 | 1.80 | 7136 | 0.25 | |
| M158 | II | 8 | 0.76 | 1.81 | 7112 | 0.24 |
Data taken from Clement & Shelton (1997), except:
1. Arellano Ferro et al. (2004), 2. Kaluzny et al. (2000),
3. Kaluzny et al. (1998), 4. Kaluzny et al. (2001),
5. This work, 6. Olech et al. (1999),
7. recalculated in this work from the data of Marín (2002), 8. Arellano Ferro et al. (2006).
| Cluster | Oo type | No. of stars | [Fe/H] | ||
|---|---|---|---|---|---|
| NGC 61711 | I | 3 | 6619 | 0.85 | |
| NGC 41472 | I | 5 | 6633 | 0.80 | |
| NGC18513 | I | 7 | 6494 | 0.80 | |
| M54 | I | 26 | 6465 | 0.81 | |
| M35 | I | 17 | 6438 | 0.78 | |
| NGC 69346 | I | 24 | 6450 | 0.81 | |
| M557 | II | 5 | 6352 | 0.71 | |
| M28 | II | 9 | 6276 | 0.71 | |
| M929 | II | 5 | 6160 | 0.67 | |
| M1510 | II | 11 | 6237 | 0.67 |
1. Clement & Shelton (1997), 2. Arellano Ferro et al. (2004), 3. Walker (1999), 4. Kaluzny et al. (2000), 5. Kaluzny et al. (1998), 6. Kaluzny et al. (2001), 7. Olech et al. (1999), 8. This work, 9. recalculated in this work from the data of Marín (2002), 10. Arellano Ferro et al. (2006).
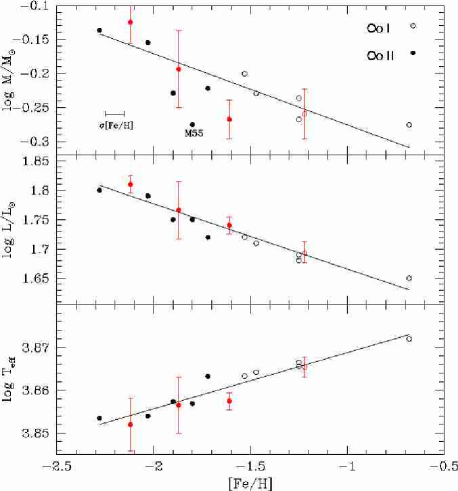
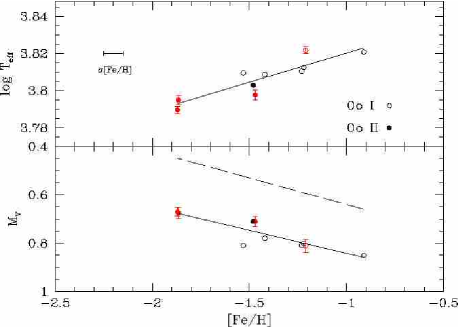
Figs. 9 and 10 show the trends of physical parameters as a function of metallicity
for RRc and RRab stars respectively. The dependences on metallicity are clear in all cases,
especially for and . The straight lines in the figures are the least square
fits to the point distribution. The relationships representing the lines are:
For the RRc stars:
| (14) |
| (15) |
| (16) |
The uncertainties in , , and in the above calibrations are:
0.029, 0.014, and 0.002 respectively.
For the RRab stars:
| (17) |
| (18) |
The uncertainties in and are 0.004 and 0.031 respectively.
The relationship between and [Fe/H] for the RRc stars (eq. 15) is very tight, and can be transformed into a - [Fe/H] relationship with the bolometric correction. Adopting the relation of Sandage & Cacciari (1990) and , we derive the relation:
| (19) |
This relation, shown as a dashed line in the lower panel of Fig. 10, has a small zero point difference with the average relationship obtained from several methods by Chaboyer (1999): . Eq. 19 can be used to estimate an average at [Fe/H] =1.50. This result is in good agreement with the weighted average of obtained by Cacciari (2003) from various methods, or with the weighted average of seven clusters obtained by Chaboyer (1999) , both for . Thus, the zero point predicted by the luminosities of eq. 3 (Simon & Clement 1993) is in agreement with the above independent estimates, but it is about 0.20 mag. too bright relative to the zero point predicted by the calibrations of eqs. 7 and 9 for the RRc and RRab stars (Kovács 1998; Kovács & Jurcsic 1996).
We do not find the discontinuity in the [Fe/H] relation claimed by
Lee & Carney (1999b) but find rather a smooth transition between OoI and OoII clusters.
The above equations represent general laws for the horizontal branch position and structure as a function of metallicity and seem to hold for globular clusters at a wide range of galactocentric distances and metallicities.
The trends given by eqs. (15), (18), and (19) agree with previous studies in that the RR Lyrae variables are more luminous (hence more evolved) in lower metalicity (hence older) clusters.
The relationship between and [Fe/H] has been widely discussed in the literature. Some evidence of the non linearity of the [Fe/H] relationship has been offered from empirical (Caputo et al. 2000; Demarque et al. 2000) and theoretical arguments (Cassisi et al. 1999; Ferraro et al. 1999; VandenBerg et al. 2000).
Of particular interest is the vs. [Fe/H] relation for the RRc variables. It is evident that RRc stars in OoII clusters have systematically larger masses than in OoI clusters. However, Clement & Rowe (2000), in a study of RRc variables in the clusters Cen, M55 and M3 reached the opposite conclusion. They found an increase of the mass with luminosity within each of the Oosterhoff groups, but a discontinuity at the transition between the OoI and OoII clusters. They derived lower masses and higher luminosities for the OoII RRc variables in Cen and M55 than the OoI RRc variables in Cen and M3, and a similar behaviour for the RRab variables. It seems that this conclusion could have been strongly influenced by the low value of for the cluster M55. However, our Figs. 9 and 10 (see also Tables 7 and 8), based on a larger number of clusters, suggest a continuous trend with metallicity, and do not support any significant discontinuity between OoI and OoII variables.
The trends in Figs. 9 and 10 and the related equations support the general scheme that OoII clusters are older and less metallic than OoI clusters, with their RR Lyrae being more massive, more luminous and having longer periods. This would be expected if the mass loss at the tip of the Red Giant Branch is diminished for smaller metallicities; thus in older clusters, at the time of reaching the HB stage, the stars turn into slightly more massive RR Lyrae variables with lower but larger luminosity, as expected from models of HB stars. This is consistent with the hypothesis that the origin of the Oosterhoff dichotomy is age; in OoII the stars are more massive, older and more evolved off the HB. The conclusion that on average metal poor (OoII group) are older than the richer clusters has been made in different studies (e.g.: Lee & Carney 1999b).
6 Conclusions
Physical parameters of astrophysical relevance have been derived for the RR Lyrae stars in M2 using the Fourier decomposition of their light curves. The estimates of the stellar radii for RRab stars from the above approach are about 5% smaller than radii derived from Period-Radius-Metallicity relations obtained from nonlinear convective models, i.e. a completely different set of pulsational models and approach. The agreement for the RRc is generally good but the dispersion is markedly larger.
Previously recognized trends between the cluster mean values of , , and against [Fe/H], obtained from RRc stars, have been established for a sample of 7 OoII and 5 OoI clusters. We extended the study of the trends for RRab stars in 4 OoII and 5 OoI clusters.
Our analysis, based on a larger data set than previous studies, allows one to quantify the relations (see eqs. 14-19 and Figs. 10 and 11). In particular, much has been discussed about the relation between luminosity (or ) and metallicity for the RR Lyrae variables. Our eqs. 15, 17, and 19 are in very good agreement with the slopes of relations solidly determined and available in the literature. The zero points indicate however that the luminosities for the RRc and RRab stars, as calculated from eq. 3 (Simon & Clement 1993) and those derived from eqs. 7 and 9 (Kovács 1998; Kovács & Jurcsic 1996) respectively, differ by the equivalent to 0.2 mag. This suggests these calibrations need to be revised.
RR Lyrae Fourier light curve decomposition produces a zero point of the RR Lyrae distance scale consistent with those from other methods. When the light curve decomposition technique is used on families of OoI and OoII globular clusters, it provides physical parameters, as a function of the metal content of the cluster, that are consistent with general notions of stellar evolution in the HB and of early stages of galactic formation.
Acknowledgments
The authors wish to thank S. Morgan for a careful reading of a first draft of the manuscript. We thanks the referee to have pointed Bono et al. (1995) paper to our attention. AAF acknowledges support from DGAPA-UNAM grant through project IN110102 and is thankful to the Universidad de La Laguna and the Instituto de Astrofísica de Canarias (Spain) for hospitality. EP acknowledges support from Progetto INAF 39/2005. We thank Juan Carlos Yustis for assistance in manouvreing Figs. 5 and 6. This work has made a large use of the SIMBAD and ADS services, for which we are thankful.
References
- (1) Alard, C., Lupton, R. H., 1998, ApJ, 503, 325
- (2) Alard, C., 2000, A&AS, 144, 363
- (3) Alcock, C., Alves, D. R., Axelrod, T. S., et al., 2004, AJ, 127, 334
- (4) Arellano Ferro, A., Arévalo, M. J., Lázaro, C., Rey, M., Bramich, D.M., Giridhar, S., 2004, Rev. Mex. Astron. Astrof., 40, 209
- (5) Arellano Ferro, A., García Lugo, G., Rosenzweig, P., 2006, Rev. Mex. Astron. Astrof., in press.
- (6) Bond, I. A., Abe, F., Dodd, R. J., et al., 2001, MNRAS, 327, 868
- (7) Bono, G., Caputo, F., Marconi, M., 1995, AJ, 110, 2365
- (8) Bono, G., Caputo, F., Castellani, V., Marconi, M., Storm, J. Degl’Innocenti, S., 2003, MNRAS, 344, 1097
- (9) Bramich, D. M., Horne, K., Bond, I. A., Street, R. A., Cameron, A. C., et al. 2005, MNRAS, 359, 1096
- (10) Cacciari, C., 2003, in ASP, Conf. Ser. 296, New Horizons in Globular Clusters, ed. G. Piotto, G. Meyland, S.G. Djorgovski & M. Riello., p. 329
- (11) Cacciari, C., Corwin, T.M., Carney, B.W., 2005, AJ, 129, 267
- (12) Castellani, M., Caputo, F., Castellani, V., 2003, A&A, 410, 871
- (13) Caputo, F., Castellani, V., Marconi, M., Ripepi, V., 2000, MNRAS, 316, 819
- (14) Cassisi, S., Castellani, V., Degl’Innocenti, S., Salaris, M., Weiss, A., 1999, A&AS, 134, 103
- (15) Chaboyer, B., 1999, in Post-Hipparcos Cosmic Candles, ed. A. Heck & F. Caputo, Kluwer Ac. Pub., p. 111
- (16) Clement, C., 2002 Catalogue of Variable Stars in Globular Clusters;// http://www.astro.utoronto.ca/ cclement/read.html
- (17) Clement, C., Shelton, I., 1997, AJ, 113, 1711
- (18) Clement C. M., Rowe J., 2000, AJ, 120, 2579
- (19) Clementini, G., Corwin, T. M., Carney, B. W., Sumerel, A. N., 2004, 127, 938
- (20) Demarque, P., Zinn, R., Lee, Y. W., Yi, S., 2000, AJ, 119, 1398
- (21) Ferraro, F. R., Messineo, M., Fusi Pecci, F., de Paolo, M. A., Straniero, O., Chieffi, A., Limongi, M., 1999, AJ, 118, 1738
- (22) Harris, W. E., 1975, ApJS, 29, 397
- (23) Harris, W. E., 1996, AJ, 112, 1487 (http://www.physics.mcmaster.ca/Globular.html)
- (24) Jurcsik, J., 1998, A&A, 333, 571
- (25) Jurcsik, J., Kovács, G., 1996, A&A, 312, 111
- (26) Kaluzny, J., Hilditch, R.W., Clement, C., Ricinski, S.M., 1998, MNRAS, 296, 347
- (27) Kaluzny, J., Olech, A., Thompson, I., Pych, W., Krzeminski, W., Schwarzenberg-Czerny, A., 2000, A&AS, 143, 215
- (28) Kaluzny, J., Olech, A., Stanek, K. Z., 2001, AJ, 121, 1533
- (29) Kovács, G., Jurcsik, J., 1996, ApJ, 466, L17
- (30) Kovács, G., Jurcsik, J., 1997, A&A, 322, 218
- (31) Kovács, G., 1998, Mem. Soc. Astron. Italiana, 69, 49
- (32) Lee, J., Carney, B. W., 1999a, AJ, 117, 2868 (LC99)
- (33) Lee, J., Carney, B. W., 1999b, AJ, 118, 1373
- (34) Lee, Y-W., Demarque, P., 1990, ApJ, 350, 155
- (35) Marconi, M., Nordgren, T., Bono, G., Schnider, G., Caputo, F., 2005, astro-ph/0503382
- (36) Marín, Z., 2002, M Sc. Thesis, Universidad de Los Andes, Venezuela
- (37) Morgan, S. M., Wahl, J. N., Wieckhorst, R. M., 2005, astro-ph/0506348
- (38) Moskalik, P., Poretti, E., 2003, A&A, 398, 213
- (39) Olech, A., Kaluzny, J., Thompson, I. B., Pych, W., Krzeminski, W., Shwarzenberg-Czerny, A., 1999, AJ, 118, 442
- (40) Oosterhoff, p. Th., 1939, Observatory, 62, 104
- (41) Sandage, A. R., Cacciari, C., 1990, ApJ, 350, 645
- (42) Salaris M., Chieffi A., Straniero O., 1993, ApJ, 414, 580
- (43) Simon, N. R., Clement, C. M., 1993, ApJ, 410, 526
- (44) Stetson, P.B., 2005, in: http://cadcwww.hia.nrc.ca/cadcbin/wdb/astrocat/stetson/query/NGC7089
- (45) Stetson, P.B., 1987, PASP, 99, 191
- (46) VandenBerg, D. A., Swenson, F.J., Rogers, F. J., Iglesias, C. A., Alexander, D. R., 2000, ApJ, 532, 430
- (47) Walraven, T., 1953, BAN, 12,57