Hot DB White Dwarfs from the Sloan Digital Sky Survey111Some observations reported here were obtained at the MMT Observatory, a joint facility of the University of Arizona and the Smithsonian Institution.
Abstract
We present photometry and optical spectroscopy for 28 DB and DO white dwarfs with temperatures between 28,000K and 45,000K. About 10 of these are particularly well-observed; the remainder are candidates. These are the hottest DB stars yet found, and they populate the “DB gap” between the hotter DO stars and the familiar DB stars cooler than 30,000K. Nevertheless, after carefully matching the survey volumes, we find that the ratio of DA stars to DB/DO stars is a factor of 2.5 larger at 30,000 K than at 20,000 K, suggesting that the “DB gap” is indeed deficient and that some kind of atmospheric transformation takes place in roughly 10% of DA stars as they cool from 30,000 K to 20,000 K.
1 Introduction
Existing surveys of white dwarfs have shown a peculiar absence of stars with helium atmospheres with temperatures between roughly 30,000K and 45,000K. Currently, the hottest published DB temperature is for the star PG 0112+104 near 30,000 K (Liebert et al., 1986). The most accurate determination is probably K, (Beauchamp, 1995) using fits to He I lines. At this temperature and below, only He I lines appear in the spectrum. Hydrogen often appears as a trace constituent, and these spectra are classified DBA. Beauchamp analyzed 51 DB and DBA stars, none hotter than PG 0112+104. Thejll et al. (1991) analyzed the far ultraviolet spectrophotometry of 11 of the hottest known DB stars but generally showed these to have lower than previously-published values. More recently Koester et al. (2001) analyzed 19 more DB stars, but the hottest determination was 25,400 K.
The He II 4686Å line should start appearing at about 40,000 K (38,000 K for a high signal-to-ratio spectrum), so spectra at this temperature and above would be classified DO. However, the coolest published temperature for a DO star before any publications from the Sloan Digital Sky Survey (SDSS; York et al. 2000) is the rather crude estimate of K for PG 1133+489 (Wesemael, Green and Liebert, 1985). Unfortunately, this star was not included in the more precise analysis of DO stars by Dreizler and Werner (1996). These authors included DO stars discovered in later surveys such as the Hamburg Schmidt survey (Heber, Dreizler and Hagen, 1996), but did not discover any cooler objects, thus supporting the existence of a “DB gap”. One or two stars classified DO from the SDSS may be similar in temperature to PG 1133+489 (Krzesiński et al., 2004), but none of the stars discussed in that paper are considerably cooler.
One suggested cause of this “DB gap” has been that as the DO stars cool, small residual amounts of hydrogen diffuse to their surfaces, so that 50,000 K helium atmosphere stars become 40,000 K hydrogen DA white dwarfs (Fontaine and Wesemael, 1987). Fontaine and Wesemael (1987) also proposed that the reappearance of helium atmosphere stars below 30,000 K is due to convective mixing of the H-rich atmosphere into the much more massive helium envelope when the outer convection boundary reaches high enough to penetrate the hydrogen. An unpleasant aspect of this theory is that the hydrogen layer mass evidently has to be quite thin, of the order of of the stellar mass, such as was found for PG 1305–017 (Bergeron et al., 1994). If the white dwarf progenitor’s asymptotic giant branch phase is not terminated with a special episode of mass loss, the remaining hydrogen envelope is predicted by models to be of the order . Asteroseismological studies of several pulsating DAV white dwarfs appear to confirm that these objects have hydrogen layer masses at least within a few orders of magnitude of this high value (Clemens, 1995; Bradley, 1998). Since the majority of white dwarfs within the DB temperature range remain DA, these apparently conflicting results may perhaps be consistent if a small fraction of the DAs retain only ultrathin outer hydrogen layers that can be convectively mixed below 30,000 K.
The problem of whether a DB gap exists is complicated by the known existence of several peculiar DAB, DBA, or DAO stars believed to lie in the 30–45,000 K range that (1) show evidence of spectrum variability and/or (2) do not fit simple atmospheric models. Simple atmospheric models may be either homogeneous (completely mixed) in H and He throughout the atmosphere or stratified with the hydrogen all in a very thin, upper layer. An example near 45,000 K is PG1210+533, which shows variable H, He I, and He II line strengths, probably modulated with an (unknown) rotational period like the magnetic star Feige 7 (Liebert et al., 1977; Achilleos et al., 1992). PG 1210+533 is not known to be magnetic. An example near 30,000K is GD 323, which shows a peculiar DAB spectrum that has not been fit successfully with either a homogeneous or stratified model atmosphere (Liebert et al., 1984; Koester, Liebert and Saffer, 1994). This star has a variable spectrum (Pereira, Bergeron and Wesemael, 2005) but is again not known to be magnetic. In contrast to these are two stars in the middle of the gap which are well fit with homogeneous atmospheres models. HS 0209+0832 is fitted at 36000 K with a 2% helium abundance (Jordan et al., 1993) and PG 1603+432 at 35,000K with 1% helium (Vennes et al., 2004). The peculiarity of some of these stars might be related to the edges of the DB gap, but in any case their uncertain relationship to the DB sequence has led workers to exclude them, perhaps too quickly, from the statistics of the DB gap. The possible roles of stellar wind mass loss, accretion and convective dredge-up in the spectral evolution of DAB stars is discussed in MacDonald & Vennes (1991).
It must be emphasized, however, that the total number of well-analyzed DB stars prior to the SDSS was rather small, only slightly more than the 70 listed in the first paragraph. Thus, the validity and significance of the alleged “DB gap” has not been clear. However, SDSS has included many such stars in its spectroscopic program, resulting in a substantial increase in the census of DBs (as well as many more DAs). Here we report the discovery of 6 DB white dwarfs with high signal-to-noise ratio photometry and spectroscopy that place their temperatures in the previously empty range of 30,000 K to 45,000 K. We also discuss 4 other well-observed stars at the edge of the range, and 18 less well-observed candidates also likely to be in the DB gap.
2 The SDSS
The SDSS (York et al., 2000; Stoughton et al., 2002; Abazajian et al., 2003, 2004, 2005; Adelman-McCarthy et al., 2006) is imaging 10,000 square degrees of high Galactic latitude sky in five passbands, , , , , and (Fukugita et al., 1996; Gunn et al., 1998, 2005). The images are processed (Lupton et al., 2001; Stoughton et al., 2002; Pier et al., 2003) and calibrated (Hogg et al., 2001; Smith et al., 2002; Ivezić et al., 2004; Tucker et al., 2005) to produce 5-band catalogs, from which galaxies, quasars, and stars are selected for follow-up spectroscopy. Spectra covering 3800Å to 9200Å with resolution of 1800 are obtained with twin fiber-fed double-spectrographs. High priority targets, namely the primary galaxies and quasars samples (Eisenstein et al., 2001; Strauss et al., 2002; Richards et al., 2002) as well as a small number of stars, are assigned to plug plates with a tiling algorithm that ensures nearly complete samples, save for the effects of the fiber collision distance (Blanton et al., 2003a). Lower priority targets take left-over fibers, generally where the large-scale structure of galaxies produce voids; these samples are incomplete and spatially inhomogeneous, but likely in a manner that can be modeled.
Of particular importance to the study of DB white dwarfs is the “Hot Standard” target class, which selects all isolated stars with clean photometry flags with very blue colors, and , down to a flux limit of . Both the colors and flux limit are applied to dereddened magnitudes (Schlegel et al., 1998), as is likely appropriate because stars this hot and faint are generally several hundred parsecs out of the disk. Because of the lack of a Balmer decrement, DBs hotter than about 15,000K are blue enough to make this target class (Harris et al., 2003; Kleinmann et al., 2004). The Hot Standard class is a tiled target class, meaning that these objects are guaranteed a fiber to the limits of fiber collisions. Note that the requirement that the stars be isolated, i.e. not superposed on the sky with another object, and free from certain photometry flags means that even the Hot Standard class is only 50% complete (Eisenstein et al., 2005). Fainter and redder WDs can still receive fibers by several other target classes; see Kleinmann et al. (2004) for discussion of this issue. Isolated stars at and and that are not Hot Standards have a spectroscopic completeness that is about 66% of that of the Hot Standards (Eisenstein et al., 2005). All SDSS targeting classes are also subject to a bright flux limit; these vary slightly, but generally require , not corrected for extinction, in a diameter fiber magnitude, which corresponds to about in the usual PSF magnitudes.
The SDSS photometric zeropoints are close to the AB convention of 3631 Jy for ; however, they are not perfect. We have adopted corrections of , , , with and unchanged. These match the value in Eisenstein et al. (2005) but differ somewhat from the estimates in Abazajian et al. (2004). The AB corrections have been estimated from comparisons with the HST calibrations (Bohlin et al., 2001) and from the DA color locus. The band shift is uncertain but has negligible consequence for this work. The band shift is important for this paper, as it implies that the stars are hotter than would be inferred from assuming that the SDSS photometric zeropoints were perfectly on the AB system. While the change is large, the primary reason is known: the original zeropoints for the SDSS system laid out in Fukugita et al. (1996) neglected the effects of atmospheric extinction on the bandpasses. This is a 4% shift in the band, 1% in , and negligible elsewhere. Hence, once this is corrected, the shifts in , , , and are all modest, less than 1.5%, and do not affect our conclusions. We will discuss our tests of the AB calibration in a later paper, but all tests to date recover a shift in the band of about 4%, i.e., the hypothesis of is not consistent with the data. Unless otherwise noted, all photometry is quoted on the SDSS system without the AB corrections. All analysis uses the AB corrected magnitudes.
3 Hot DB White Dwarfs
3.1 Atmospheric Models
For the spectroscopic fitting we used a grid of helium-rich model spectra with 5 different traces of hydrogen: H/He = , , , , . Effective temperatures ranged from 10000 to 50000 K and logarithmic surface gravity ranged from 7.0 to 9.0. The numerical procedures of the atmospheric calculations and the DK fitting routine (§ 3.5) as well as the input physics are described in past papers (Finley et al., 1997; Homeier et al., 1998; Friedrich et al., 2000; Koester & Wolff, 2000; Koester et al., 2005). We therefore give here only a brief summary of those aspects that are important for hot, helium rich white dwarfs and not covered in detail in the references.
HeI bound-free cross sections were obtained from the Opacity Project calculations as provided by the TOPBASE database at CDS (Seaton, 1987; Cunto & Mendoza, 1992; Cunto et al., 1993). The Stark broadening of the optical HeI lines uses the calculations of Beauchamp, Wesemael, and Bergeron (1997) with tables supplied to us through Dr. Thomas Rauch (priv. comm.). One remaining uncertainty in DB models is the treatment of the HeI resonance lines in the EUV. We have used the asymptotic wing formula described in Griem (1974). Data for electron and ion Stark broadening parameters were taken from that reference and additionally from Dimitrijevic & Sahal-Brechot (1984a, b, 1990). In cool DB stars these resonance lines are very strong, violating the validity criteria of the theory and raising conflicts with UV observations of white dwarfs (the EUV resonance lines themselves have never been observed directly in any white dwarf). We therefore have introduced artificial weakening of the far wings beyond about 300Å from the line center. However, this uncertainty is not relevant for the hot DBs considered here, since the resonance lines are weaker than in the cool objects and do not overlap as strongly.
The optical HeI lines reach a maximum strength about 25,000 K. This creates partial degeneracies in the spectral fitting between models just below and above this point. Above 30,000 K, these degeneracies are milder, but the line strengths change rather gently with temperature, leaving the determination of temperatures sensitive to small systematic errors in the data and the models. In the end, we find that there are unexplained differences in the results at the level of 1000 K. This level of accuracy is sufficient for our purposes, but the deviations suggest the opportunity for future improvements.
A major concern in the estimation of temperatures is the possible presence of small levels of hydrogen in the atmospheres. We assume that the hydrogen is mixed homogeneously through the atmosphere. The hydrogen alters the line profiles of the helium lines so that a 100% helium atmosphere model would overestimate the temperature. Similarly, the hydrogen slightly reddens the slope of the spectral continuum, thereby causing a photometric temperature estimate to be overestimated. The signature of hydrogen is the appearance of Balmer lines, notably H, in the spectrum. A H/He fraction of typically corresponds to a shift of about 4000 K at these hot temperatures; however, most of the stars presented in this paper do not show H and H as strongly as this model would predict. Hence, the possible temperature shifts are much smaller. Throughout the paper, we use a H/He fraction of for the 4 stars that show Balmer lines and or for the remainder of the sample, the difference between the latter two being negligible.
3.2 Selection
Hot DB White Dwarf candidates
Spectroscopya
Imagingb
Astrometryd
Name
Class
Plate/Fiber/MJD
Run/Rerun/Col/Field/Id
HS?c
RA
Dec
e
Anglef
SDSS J001529.74+010521.3
DB
389
530
51795
2662
40
6
308
77
Y
3.873926
1.089256
2.08
184.6
SDSS J040854.60–043354.6
DB A:
465
518
51910
1729
40
6
496
29
Y
62.227510
–4.565178
1.79
183.4
SDSS J074538.17+312205.3
DO
755
51
52235
2137
40
2
91
28
Y
116.409046
31.368161
3.57
261.7
SDSS J081115.08+270621.7
DO
1206
235
52670
3462
40
4
86
192
Y
122.812863
27.106047
1.35
185.2
SDSS J081546.08+244603.2
DO
1585
388
52962
3644
41
5
96
30
N
123.942021
24.767581
0.30
338.7
SDSS J084823.52+033216.7
DB
564
565
52224
2125
40
5
89
145
N
132.098019
3.537982
0.55
160.6
SDSS J084916.18+013721.2
DB
467
594
51901
1462
40
4
46
188
N
132.317420
1.622575
1.74
172.0
SDSS J090232.17+071929.9
DB
1191
368
52674
3478
40
5
129
133
Y
135.634078
7.324996
1.82
286.5
SDSS J090456.11+525029.8
DB
552
547
51992
2074
41
6
125
46
Y
136.233828
52.841617
1.69
246.1
SDSS J092544.40+414803.1
DB
939
362
52636
2887
40
6
225
45
N
141.435022
41.800881
2.20
269.3
SDSS J093041.80+011508.4
DB
475
101
51965
1907
40
2
134
47
Y
142.674168
1.252336
0.46
180.1
SDSS J093759.52+091653.2
DB
1304
131
52993
3538
40
3
178
30
Y
144.498002
9.281449
1.78
218.1
SDSS J095256.68+015407.6
DB
481
513
51908
1907
40
3
171
55
Y
148.236183
1.902138
1.25
150.8
SDSS J113609.59+484318.9
DO+M
966
69
52642
3059
42
2
105
30
Y
174.039961
48.721934
1.06
169.4
SDSS J123750.46+085526.0
DB
1233
83
52734
3525
40
1
229
49
Y
189.460269
8.923910
0.14
157.2
SDSS J134524.92–023714.2
DB
913
185
52433
2333
40
3
63
134
N
206.353845
–2.620620
0.77
111.9
SDSS J140159.09+022126.7
DB
532
358
51993
1462
40
4
568
58
Y
210.496233
2.357431
0.76
345.3
SDSS J141258.17+045602.2
DB
583
432
52055
1478
40
5
35
54
Y
213.242391
4.933957
2.69
168.0
SDSS J141349.46+571716.4
DB
1160
414
52674
3183
40
5
110
87
Y
213.456085
57.287893
0.46
333.4
SDSS J143227.25+363215.2
DB
1382
314
53115
3893
41
1
349
60
N
218.113551
36.537568
2.14
353.0
SDSS J153852.34–012133.7
DBA
926
428
52413
2334
40
4
259
214
Y
234.718125
–1.359367
2.82
152.6
SDSS J154201.48+502532.0
DB
796
180
52401
2299
41
3
252
130
N
235.506191
50.425559
2.68
296.9
SDSS J164703.44+245129.0
DB
1414
445
53135
3958
40
3
163
86
N
251.764343
24.858082
1.81
176.0
SDSS J211149.59–053938.3
DB A:
638
533
52081
1659
40
6
85
67
Y
317.956629
–5.660647
0.93
156.9
SDSS J212403.12+114230.1
DB
730
380
52466
1739
40
5
48
348
Y
321.013001
11.708370
2.32
112.0
SDSS J215514.43–075833.7
DB
716
344
52203
2576
40
4
49
108
Y
328.810149
–7.976054
2.46
207.4
SDSS J222833.82+141036.9
DB+M:
737
602
52518
2566
40
6
161
68
Y
337.140934
14.176924
2.09
159.3
SDSS J234709.29+001858.0
DB
385
624
51877
2662
40
4
261
80
N
356.788735
0.316125
1.11
43.1
NOTES.—aThe identification numbers for the SDSS spectroscopy.
bThe identification numbers for the SDSS imaging.
cWhether or not (Y or N) the object was targetted as a HOT_STANDARD.
If so, the object received high priority in fiber allocation;
if not, the object was targeted through the star or serendipity sets
and recieved lower priority.
dProper motion from USNO-B catalog.
eProper motion in arcseconds per century. The USNO catalog errors vary
but are of order unity in these units.
fDirection of proper motion (North through East).
| Name | ||||||
|---|---|---|---|---|---|---|
| SDSS J001529.74+010521.3 | 18.711(26) | 18.938(37) | 19.419(22) | 19.730(28) | 20.09(12) | 0.094 |
| SDSS J040854.60–043354.6 | 19.042(26) | 19.307(14) | 19.688(26) | 19.964(40) | 20.14(15) | 0.364 |
| SDSS J074538.17+312205.3 | 18.592(19) | 18.912(15) | 19.348(22)* | 19.637(22) | 19.89(08) | 0.195 |
| SDSS J081115.08+270621.7 | 17.750(16) | 18.118(14) | 18.666(21) | 18.999(16) | 19.38(07) | 0.111 |
| SDSS J081546.08+244603.2 | 18.170(21)* | 18.595(20) | 19.045(21) | 19.398(30) | 19.65(08) | 0.183 |
| SDSS J084823.52+033216.7 | 19.207(27) | 19.446(17) | 19.864(22) | 20.242(36) | 20.47(14) | 0.129 |
| SDSS J084916.18+013721.2 | 19.296(30) | 19.452(21) | 19.802(32) | 20.048(37) | 20.54(22) | 0.141 |
| SDSS J090232.17+071929.9 | 18.543(20) | 18.711(18) | 19.050(23) | 19.376(29) | 19.48(07) | 0.260 |
| SDSS J090456.11+525029.8 | 18.665(22) | 18.955(23) | 19.411(17) | 19.740(25) | 19.93(09) | 0.055 |
| SDSS J092544.40+414803.1 | 19.128(32) | 19.303(38) | 19.852(41) | 20.310(57) | 20.29(14) | 0.059 |
| SDSS J093041.80+011508.4 | 19.168(28) | 19.215(27) | 19.614(28) | 19.808(35) | 20.00(12) | 0.272 |
| SDSS J093759.52+091653.2 | 18.333(18) | 18.520(20) | 18.849(23) | 19.184(33) | 19.31(07) | 0.154 |
| SDSS J095256.68+015407.6 | 17.292(24) | 17.496(13) | 17.849(19) | 18.156(15) | 18.45(03) | 0.189 |
| SDSS J113609.59+484318.9 | 16.430(28) | 16.836(33) | 17.332(21) | 17.513(20) | 17.39(02) | 0.073 |
| SDSS J123750.46+085526.0 | 18.618(34) | 18.840(22) | 19.314(28) | 19.619(48) | 19.96(15) | 0.090 |
| SDSS J134524.92–023714.2 | 19.213(31) | 19.467(20) | 19.916(26) | 20.202(37) | 20.32(14) | 0.173 |
| SDSS J140159.09+022126.7 | 18.736(28) | 19.026(26) | 19.470(25) | 19.828(34) | 19.99(13) | 0.120 |
| SDSS J141258.17+045602.2 | 17.191(13) | 17.346(23) | 17.750(15) | 18.086(20) | 18.39(03) | 0.079 |
| SDSS J141349.46+571716.4 | 18.226(55) | 18.399(24) | 18.808(19) | 19.106(22) | 19.51(09) | 0.051 |
| SDSS J143227.25+363215.2 | 18.510(17) | 18.653(24) | 19.116(14) | 19.378(22) | 19.68(07) | 0.038 |
| SDSS J153852.34–012133.7 | 19.307(33) | 19.483(20) | 19.791(21) | 20.040(31) | 20.39(18) | 0.502 |
| SDSS J154201.48+502532.0 | 16.498(16)* | 16.777(23) | 17.137(15) | 17.502(15) | 17.81(02) | 0.066 |
| SDSS J164703.44+245129.0 | 19.219(29) | 19.465(21) | 19.854(23) | 20.175(35) | 20.47(13) | 0.192 |
| SDSS J211149.59–053938.3 | 18.644(22) | 18.839(12) | 19.228(18) | 19.492(24) | 19.61(08) | 0.415 |
| SDSS J212403.12+114230.1 | 18.881(23) | 18.995(12) | 19.329(17) | 19.636(30) | 19.93(11) | 0.298 |
| SDSS J215514.43–075833.7 | 18.072(21) | 18.270(27) | 18.715(22) | 18.992(28) | 19.23(07) | 0.115 |
| SDSS J222833.82+141036.9 | 18.611(25) | 18.769(17) | 19.084(18) | 19.380(23) | 19.66(08) | 0.248 |
| SDSS J234709.29+001858.0 | 18.781(38)* | 18.997(27) | 19.388(17) | 19.656(24) | 20.07(13) | 0.107 |
NOTES.—The SDSS photometry in the , , , , and bands, uncorrected for reddening or AB zeropoints. The error in the last two digits are given in parentheses. This error is only the photon Poisson error; it does not include field-to-field calibration errors, which is estimated at 0.01 mag in , , , 0.02 mag in , and 0.03 mag in (Ivezić et al., 2004). An asterisk indicates that the photometry in that band was flagged during processing as suspect (Kleinmann et al., 2004); we have excluded these bands from our model fitting. The Schlegel et al. (1998) extinction prediction for the band is given in the last column.
We draw our sample from the SDSS DR4 white dwarf catalog (Eisenstein et al., 2005). The parent set for this catalog was selected by their blue colors and stellar redshifts. The stars were then fit to stellar atmospheres by the autofit method described in Kleinmann et al. (2004) and Eisenstein et al. (2005). Those with temperature and surface gravities indicative of white dwarfs were denoted as such. Stars with unusual results were flagged for visual inspection and could be added to or removed from the white dwarf list.
In brief, the autofit method performs a minimization of the spectrum and photometry relative to the grid of atmospheric models to yield an estimate of the temperature and surface gravity of the star. Two grids of atmospheres are used, pure hydrogen and pure helium; typically one model grid has a signficantly lower best than the other. All model spectra are convolved to the spectral resolution of the data. Masked pixels are excluded, as are any photometric bands with suspicious warning flags. Errors on the fitted parameters are computed by taking moments of the likelihood function . The continuum is controlled by marginalizing over an unknown polynomial of order 5 that multiplies the model spectrum. This order of polynomial is sufficiently general to be completely degenerate with the reddening or with any effect from atmospheric dispersion moving the star relative to the SDSS fiber entrance. The spectra are fit over the range 3900Å to 6800Å. Our 5th order polynomial will remove errors in the SDSS spectrophotometry on scales above 500Å, but errors on smaller scales would be passed through and could affect the fits if ill-placed. However, the SDSS fluxing does appear to be good, at least in the mean, on these smaller scales, save for a 5% bump at 3930Å.
From the DR4 catalog, we select all white dwarfs, regardless of classification, that have dereddened and that were fit best by a helium atmosphere hotter than 28,000 K. We repeated the autofit analysis on these stars, extending the helium grid up to 50,000 K. We used maximum wavelengths of 6800Å and 5400Å and also used a model grid with 1% hydrogen. We then inspected the stars, studying the spectra and photometry along with the various autofit results. Some of the stars were subdwarfs; these changes in classification have been reflected in the released DR4 catalog. Others were DO stars that were hotter than 50,000 K, which we decided not to include in this paper as they are much hotter than the putative DB gap. One star was a cooler magnetic DB whose spectrum had drastically biased the fit. Three other stars were rejected because closer inspection led us to conclude that they were either considerably cooler or so noisy as to be inconclusive.
After the inspection, we are left with 28 stars that we believe to be hot DB or cool DO stars. 19 of these are from the Hot Standard class. The basic information on these stars is given in Table 3.2, including the USNO-B proper motion. The SDSS photometry is given in Table 3.2. Some bands have photometric flags set that lead us to be suspicious of the photometry; these bands have been marked with asterisks and excluded from the autofit and subsequent analysis.
3.3 Follow-up Data
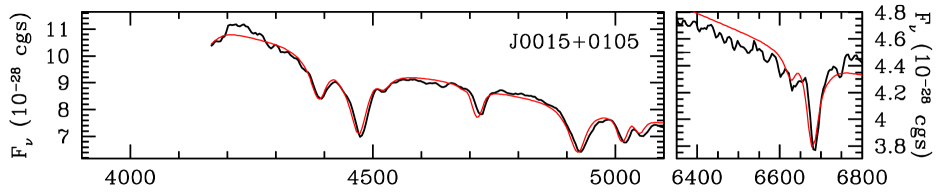
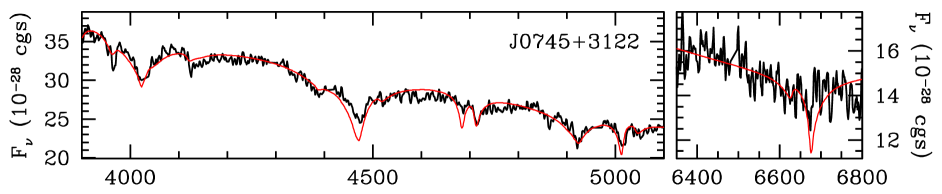
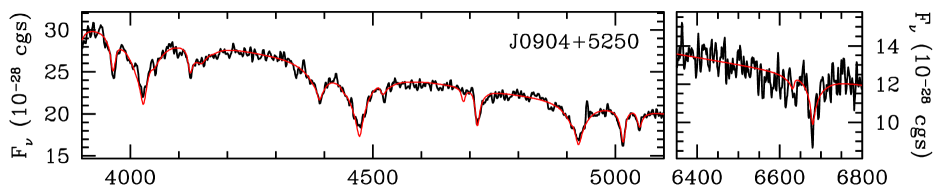
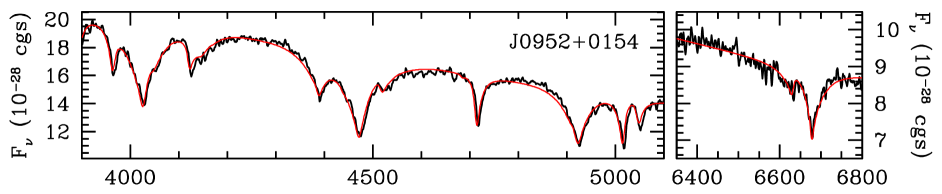
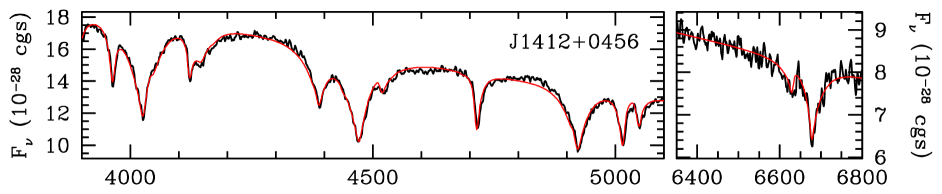
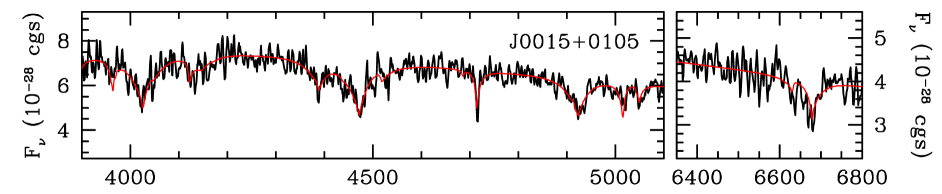
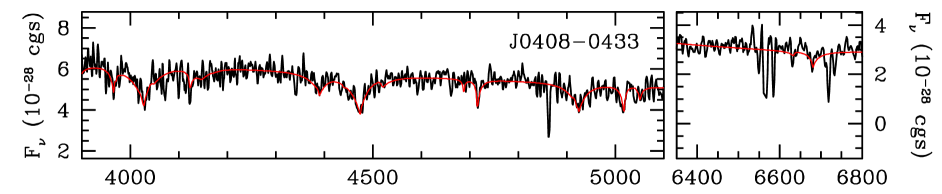
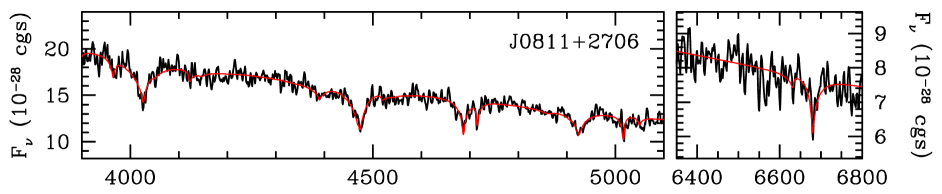
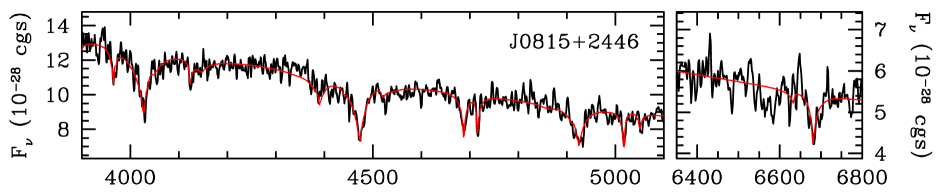
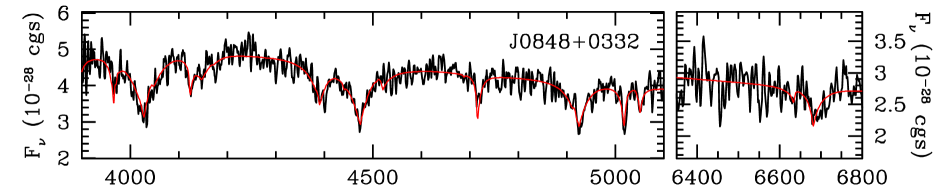
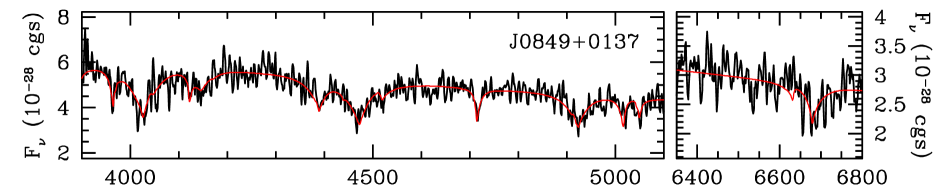
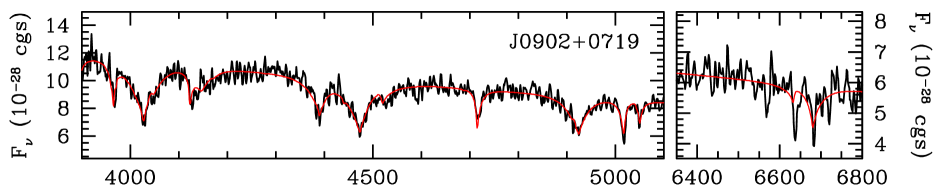
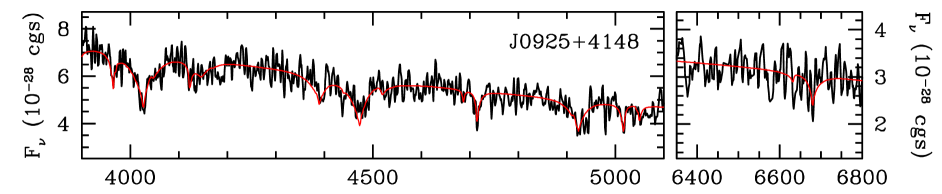
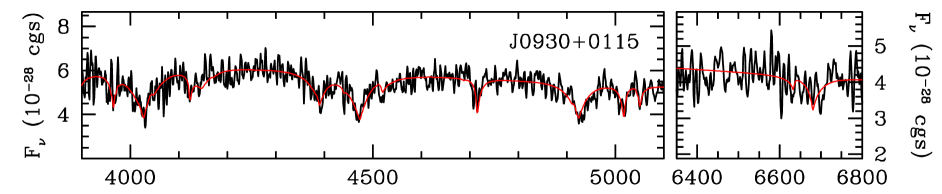
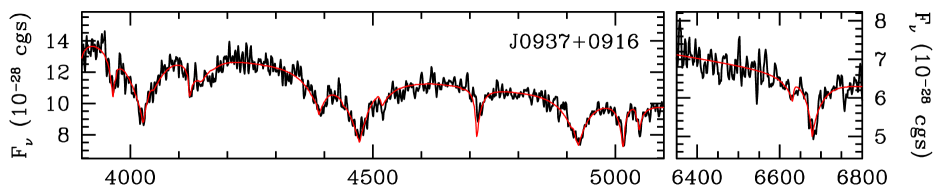
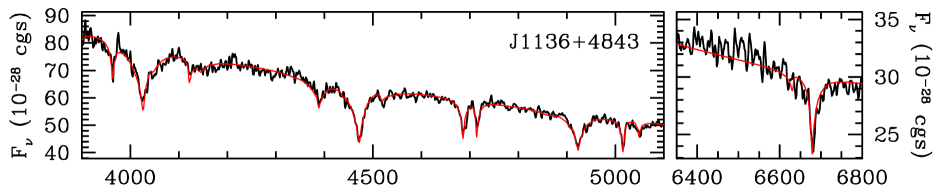
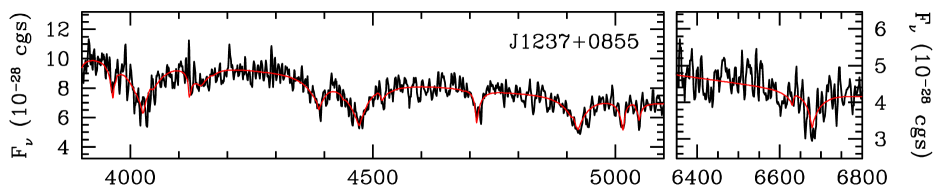
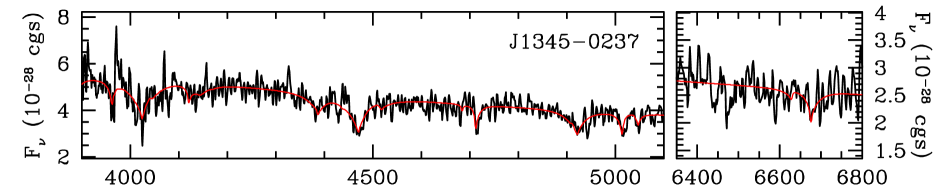
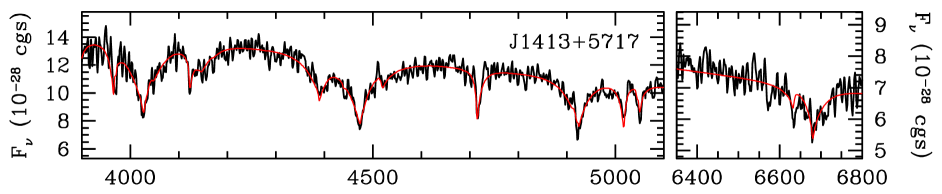
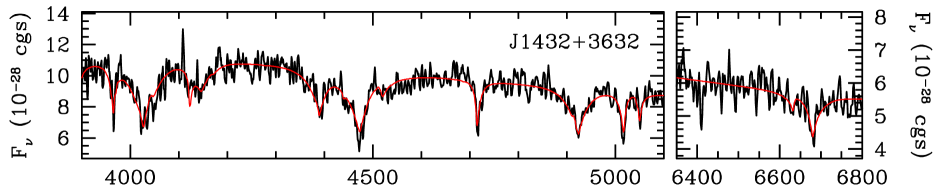
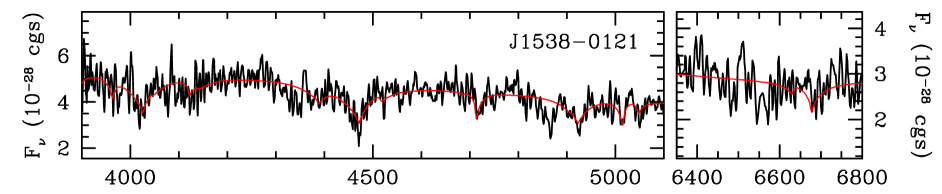
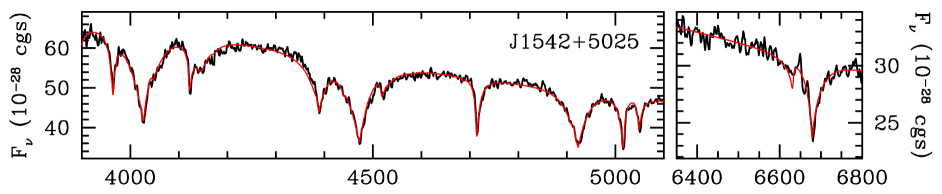
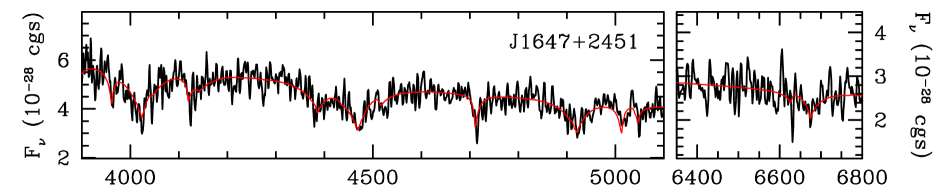
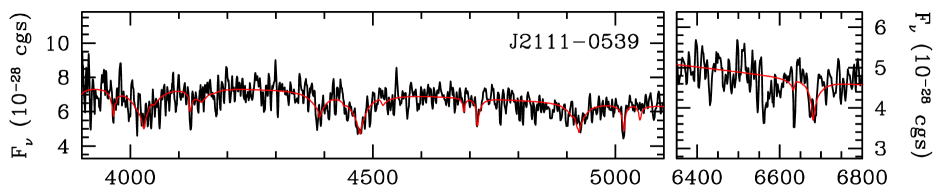
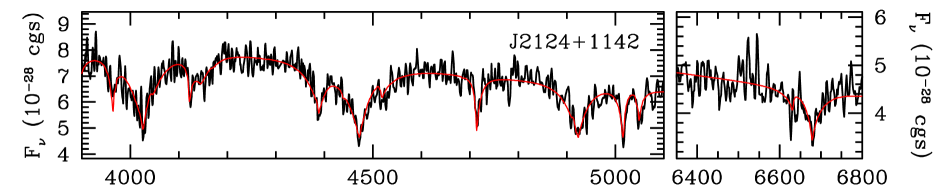
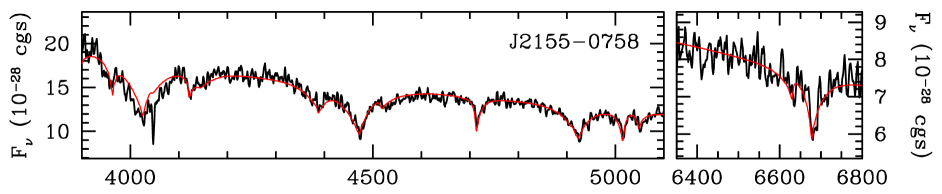
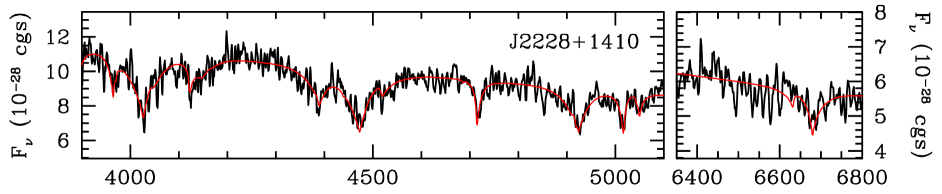
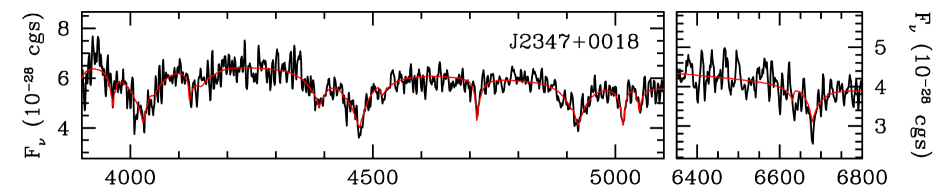
Unfortunately, the signal-to-noise ratio in the red portion of the SDSS spectra was not always sufficient to detect weak H lines in these very blue stars. We therefore acquired higher signal-to-noise ratio spectra at the 6.5-meter MMT in order to refine the temperature estimates and search for the possible Balmer lines. These spectra are shown in Figure 1. The SDSS spectra for stars not observed at the MMT are shown in Figures 2–5.
One star (J0015+0105) was observed with the SpecPol spectrometer (Schmidt et al., 1992; Smith et al., 2003) on October 29, 2003. The spectral resolution is low, about 18Å FWHM through the slit, but the throughput is very high, permitting a good constraint on the Balmer lines in the 45 minute exposure. The flux calibration was performed using the standard star G 191-B2B.
Five stars (J0952+0154, J1401+0221, J0904+5250, J1426+0456, J0745+3122) were observed with the Blue Channel spectrograph on the night of January 19, 2004. Seeing conditions were poor, such that we used a wide slit (–). A 500 mm-1 grating was used, resulting in roughly 6Å FWHM spectral resolution over a wavelength range of 3900Å to 6800Å. The spectra were reduced with standard IRAF packages and fluxed using the spectrophotometric standard stars G 191-B2B and Feige 66. Exposure times ranged between 20 and 45 minutes per star.
In addition to our 5 targets, we observed the well-studied, hot, pulsating DBV star GD 358 with the intent of testing our modeling. We find, however, that this star is sufficiently close to the peak strengths of the He I lines (near 25,000 K) that its temperature fits are unstable in a manner that is not expected to extend to higher temperatures. When we fit GD 358 with autofit over the full spectral range, we obtain a temperature of 27,700 K, but when we restrict to blueward of 5400Å (where most but not all of the strong lines are), the derived temperature is 23,900 K. Making a similar restriction on our primary stars typically changes our fits by only a few hundred degrees, and only one star by more than 1000 K (SDSS J1538–0121, which has other discrepencies to be described in § 3.6) The DK fitting package has similar trouble with GD 358.
3.4 Photometric Temperature Estimates
| Name | (AB) | (AB) | 95% range | DOFa | ||
| SDSS J001529.74+010521.3b | –0.336 | –0.820 | 35.4 | 33.6–37.3 | 0.36 | 4 |
| SDSS J040854.60–043354.6 | –0.437 | –0.836 | 40.1c | 34.2–45.7 | 1.29 | 4 |
| SDSS J074538.17+312205.3 | –0.431 | –0.828 | 39.8 | 35.4–44.1 | 2.00 | 3 |
| SDSS J081115.08+270621.7 | –0.448 | –0.946 | 47.4 | 44.7– | 4.05 | 4 |
| SDSS J081546.08+244603.2 | –0.531 | –0.900 | 43.6 | 35.1– | 0.47 | 3 |
| SDSS J084823.52+033216.7 | –0.326 | –0.869 | 35.5 | 31.3–40.5 | 2.01 | 4 |
| SDSS J084916.18+013721.2 | –0.247 | –0.674 | 25.8 | 19.9–29.8 | 2.12 | 4 |
| SDSS J090232.17+071929.9 | –0.302 | –0.797 | 30.7 | 27.4–34.3 | 4.42 | 4 |
| SDSS J090456.11+525029.8 | –0.350 | –0.825 | 35.7 | 31.9–40.0 | 1.14 | 4 |
| SDSS J092544.40+414803.1 | –0.236 | –1.049 | 37.1 | 31.7–43.6 | 11.84 | 4 |
| SDSS J093041.80+011508.4 | –0.185 | –0.730 | 26.7 | 21.9–30.5 | 3.43 | 4 |
| SDSS J093759.52+091653.2 | –0.283 | –0.748 | 27.6 | 24.3–31.1 | 4.82 | 4 |
| SDSS J095256.68+015407.6 | –0.312 | –0.760 | 30.8 | 28.0–33.8 | 2.53 | 4 |
| SDSS J113609.59+484318.9 | –0.472 | –0.725 | 46.1 | 40.7– | 0.06 | 2d |
| SDSS J123750.46+085526.0 | –0.295 | –0.835 | 34.8 | 30.1–40.7 | 1.10 | 4 |
| SDSS J134524.92–023714.2 | –0.357 | –0.828 | 36.9 | 32.2–42.4 | 1.82 | 4 |
| SDSS J140159.09+022126.7 | –0.373 | –0.871 | 37.6c | 32.0–43.7 | 1.30 | 4 |
| SDSS J141258.17+045602.2 | –0.224 | –0.791 | 29.7 | 27.0–32.4 | 3.74 | 4 |
| SDSS J141349.46+571716.4 | –0.231 | –0.745 | 28.4 | 24.3–32.9 | 1.74 | 4 |
| SDSS J143227.25+363215.2 | –0.197 | –0.757 | 28.1 | 25.3–31.1 | 4.13 | 4 |
| SDSS J153852.34–012133.7 | –0.398 | –0.798 | 34.9c | 29.7–41.1 | 1.47 | 4 |
| SDSS J154201.48+502532.0 | –0.343 | –0.770 | 31.5 | 27.0–37.7 | 7.18 | 3 |
| SDSS J164703.44+245129.0 | –0.355 | –0.811 | 35.0 | 30.7–40.0 | 0.63 | 4 |
| SDSS J211149.59–053938.3 | –0.385 | –0.855 | 38.5c | 33.8–43.4 | 2.39 | 4 |
| SDSS J212403.12+114230.1 | –0.262 | –0.790 | 29.9 | 26.7–33.4 | 1.68 | 4 |
| SDSS J215514.43–075833.7 | –0.280 | –0.789 | 31.8 | 28.3–35.5 | 1.20 | 4 |
| SDSS J222833.82+141036.9 | –0.288 | –0.738 | 28.5 | 25.3–31.9 | 2.64 | 4 |
| SDSS J234709.29+001858.0b | –0.229 | –0.767 | 28.7 | 27.2–30.2 | 3.04 | 4 |
NOTES.—The colors include a maximal reddening correction from Schlegel et al. (1998) and a 4% and 1.5% AB correction for and , respectively, making the colors bluer. The best-fit temperature for a pure Helium atmosphere with is listed, using only the photometry and the errors (suspect bands are marked by asterisks and given no weight). The 95% confidence interval is listed; strictly speaking, these are simply the values. We omit the upper bound if it exceeds 50,000 K, the maximum of our grid. All temperatures are in 1000’s of Kelvin. A maximal reddening correction is assumed. The of the best fit is given. aDegrees of freedom available to fit. bThe colors and fit are based on the stacked photometry listed in §3.6 rather than single-epoch photometry in Table 3.2. cThe fit is to a model with 1% hydrogen fraction rather than pure helium. dThe M star companion is bright enough that we have excluded the and bands from the fit.
At these temperatures, the predicted photometric colors depend sensitively on temperature but are insensitive to surface gravity. At 30,000 K, the and colors change by mag and mag per 1000 K, respectively, but a surface gravity change of a factor of 10 (i.e., 1 dex) changes these colors by only 0.023 mag and 0.024 mag, respectively. We therefore perform a fit of the model predictions directly to the photometry alone, assuming that the stars have pure helium atmospheres and . The surface gravities of typical white dwarfs and DBs in particular are known to be clustered around (Beauchamp, 1995), and the dispersion around that point is small enough as account for well less than 1000 K of uncertainty.
We present these photometry-only fits in Table 3.4. All stars were dereddened by the full amount of the Schlegel et al. (1998) prediction. A 30,000K DB white dwarf with would have (Bergeron, private communication). Our fainter stars, with , are therefore at least 400 parsecs away, and since all of the targets are at high Galactic latitude, the reddening assumption is appropriate for the fainter stars. However, the brightest stars may be over-corrected, which would cause an overestimate of their temperature. We further apply a correction to move the SDSS photometry to the AB system, as discussed in § 2. For reference, the 30,000 K DB model has synthetic AB colors of and , i.e., SDSS colors of and . Finally, we add calibration uncertainties in quadrature to the errors in all bands; these are taken to be 0.01 mag in , , and , 0.02 mag in , and 0.03 mag in (Ivezić et al., 2004).
Two of the candidates (J0015+0105 and J2347+0018) lie on the southern Galactic cap equatorial strip, where the SDSS has imaged repeatedly. Therefore these objects have extremely precise photometry. In both cases, we use 11 epochs of photometry. These 11 agree with each other and are consistent with Table 3.2. The weighted averages are , , , , and for SDSS J234709.3001858 and , , , , and for SDSS J001529.7010521. In both cases, the errors derived from the variance of the 11 epochs are 0.015 mag or smaller for all bands, save for 0.04 mag in . Because some but not all of the calibration uncertainties will be decreased in multiple observations, we adopt 0.015 mag (0.04 mag in ) as the errors.
We regard the photometric fits as a robust temperature estimate. The precision of the temperature estimate is typically limited by the photometric accuracy, particularly in the band. This is usually the result of the statistical errors, but a floor of about K is set by the knowledge of the photometric zeropoint and uncertainties in the reddening correction. Typically, the errors are closer to 2000 K. Nevertheless, this constrains many of the stars to be hotter than 30,000 K, although some are better fit in the 28,000 K range.
3.5 Spectroscopic Temperature Estimates
| DJE Fitting | DK Fitting | |||||||
| Name | Class | |||||||
| SDSS J001529.74+010521.3 | DB | 11.6 | 36.7(08) | 7.97(12) | 1.07 | 40.0(08) | 8.31(10) | 1.28 |
| MMT | 35.5 | 7.68 | 35.4 | 8.06 | ||||
| SDSS J040854.60–043354.6 | DB A: | 10.6 | 34.9(17)† | 7.61(16)† | 1.22 | 36.5(14)† | 7.82(12)† | 1.67 |
| SDSS J074538.17+312205.3 | DO | 8.5 | 44.5(11) | 8.61(26) | 0.93 | 47.2(05) | 7.73(15) | 1.34 |
| MMT | Poor Fit | Poor Fit | ||||||
| SDSS J081115.08+270621.7 | DO | 16.3 | 47.5(01) | 8.01(04) | 0.96 | 47.4(03) | 7.78(08) | 1.29 |
| SDSS J081546.08+244603.2 | DO | 15.7 | 45.5(04) | 7.72(09) | 0.95 | 46.5(01) | 7.84(08) | 1.21 |
| SDSS J084823.52+033216.7 | DB | 11.1 | 32.1(07) | 7.70(10) | 1.03 | 34.3(07) | 7.55(09) | 1.31 |
| SDSS J084916.18+013721.2 | DB | 8.4 | 29.4(10) | 7.72(13) | 1.09 | 29.5(07) | 7.36(12) | 1.38 |
| SDSS J090232.17+071929.9 | DB | 12.9 | 30.2(06) | 7.71(08) | 0.99 | 29.9(05) | 7.50(08) | 1.20 |
| SDSS J090456.11+525029.8 | DB | 15.5 | 37.5(06) | 7.99(09) | 1.09 | 38.2(06) | 7.90(08) | 1.07 |
| MMT | 40.1 | 7.91 | 39.4 | 7.85 | ||||
| SDSS J092544.40+414803.1 | DB | 9.5 | 38.7(11) | 7.59(14) | 1.15 | 39.8(11) | 7.30(14) | 1.34 |
| SDSS J093041.80+011508.4 | DB | 8.1 | 31.9(09) | 7.72(15) | 0.96 | 34.0(11) | 7.50(15) | 1.45 |
| SDSS J093759.52+091653.2 | DB | 17.4 | 31.5(04) | 8.10(07) | 0.97 | 31.3(04) | 7.92(05) | 1.00 |
| SDSS J095256.68+015407.6 | DB | 30.6 | 33.8(02) | 8.16(03) | 0.82 | 34.8(02) | 8.07(03) | 1.19 |
| MMT | 34.2 | 8.30 | 33.9 | 8.10 | ||||
| SDSS J113609.59+484318.9 | DO+M | 28.9 | 45.0(01) | 7.62(02) | 0.99 | 46.4(00) | 7.81(03) | 1.22 |
| SDSS J123750.46+085526.0 | DB | 9.3 | 31.3(08) | 7.82(11) | 0.94 | 34.0(06) | 7.87(10) | 1.44 |
| SDSS J134524.92–023714.2 | DB | 8.0 | 38.2(14) | 7.90(17) | 1.07 | 41.4(14) | 7.46(17) | 1.50 |
| SDSS J140159.09+022126.7 | DB | 10.4 | 34.8(14)† | 7.98(15)† | 1.16 | 37.9(15)† | 8.01(13)† | 1.28 |
| MMT | 36.5† | 7.67† | 36.5† | 7.51† | ||||
| SDSS J141258.17+045602.2 | DB | 28.2 | 31.0(02) | 7.98(03) | 0.86 | 31.9(02) | 8.00(03) | 1.25 |
| MMT | 31.5 | 7.96 | 31.2 | 7.87 | ||||
| SDSS J141349.46+571716.4 | DB | 15.5 | 30.0(05) | 7.92(07) | 0.96 | 31.3(04) | 7.96(06) | 1.24 |
| SDSS J143227.25+363215.2 | DB | 12.0 | 29.1(06) | 7.57(09) | 1.19 | 32.7(05) | 7.82(09) | 1.33 |
| SDSS J153852.34–012133.7 | DBA | 6.8 | 21.9(03)† | 8.49(15)† | 1.07 | 30.1(16)† | 8.26(16)† | 1.40 |
| SDSS J154201.48+502532.0 | DB | 36.3 | 32.4(02) | 7.83(03) | 0.80 | 33.2(01) | 7.84(02) | 1.36 |
| SDSS J164703.44+245129.0 | DB | 7.8 | 31.7(10) | 8.03(14) | 1.04 | 33.2(09) | 7.79(14) | 1.07 |
| SDSS J211149.59–053938.3 | DB A: | 8.1 | 36.1(22)† | 7.62(19)† | 1.00 | 47.4(07)† | 7.73(18)† | 1.34 |
| SDSS J212403.12+114230.1 | DB | 12.8 | 30.3(06) | 7.92(08) | 1.07 | 32.4(05) | 8.08(08) | 1.13 |
| SDSS J215514.43–075833.7 | DB | 19.5 | 32.1(04) | 8.25(05) | 1.32 | 28.8(04) | 7.79(05) | 1.55 |
| SDSS J222833.82+141036.9 | DB+M: | 12.4 | 33.2(07) | 8.02(10) | 1.04 | 33.6(05) | 7.91(08) | 1.22 |
| SDSS J234709.29+001858.0 | DB | 11.6 | 32.1(07) | 7.92(10) | 1.25 | 32.9(07) | 7.80(11) | 1.01 |
NOTES.—The MMT lines refer to the MMT spectrum of the star immediately above. For the SDSS spectra, the formal errors on the last two digits are given in parentheses. However, the discrepencies between the two fitting packages suggest that the systematic errors are important as well, particularly for the surface gravities. The signal-to-noise ratio is quoted for the band. We have omitted quotes of the signal-to-noise ratio and formal errors from the MMT data because these reductions are not as well characterized as the SDSS. Of course, the S/N ratio is considerably higher. †Using a H/He ratio of 1%, which is a representative value but not optimized. The SDSS spectrum of J1401+0221 fits to 38,900K and with a pure He atmosphere.
We fit the SDSS and MMT spectra to the atmosphere models by two different methods. These two packages share the same grid of atmosphere models and the same spectral reductions but are otherwise independent.
The first is the autofit method described in § 3.2. These resulting temperatures and gravities are presented in Table 3.5 as the DJE numbers. There is a mild covariance between temperature and gravity, such that higher gravities imply higher temperatures. Note that autofit does include the photometric data as well, but the photometry is much less constraining (at least in a statistical sense) than the spectra and so it has relatively little pull on the results.
The second model fitting was performed by Detlev Koester and is listed in Table 3.5 as the DK numbers. In this method, the model is fit to the observed spectrum in a number of preselected continuum regions between the spectral lines. The flux correction factors determined for these regions are then quadratically interpolated for the whole spectrum. After this normalization, the statistic is determined only in the regions containing the lines. In essence, this means that only the information contained in the line shape relative to the adjacent continuum is used. The photometry is not used as a constraint.
Figure 6 compares the results from the two fitting methods. We are generally encouraged by the agreement. All of the fits to MMT data agree well, to better than 700 K. For the SDSS spectra, there are a few outliers (to be discussed later), but most fits agree. There does appear to be a trend for the DK temperatures to be higher than the DJE temperatures by about 1500 K. This difference seems to be smaller at higher signal-to-noise ratio, only 800 K at per pixel and better for the MMT data, and increases for noisier data, suggesting that it is related to some difference in how pixels are weighted. The surface gravities agree to reasonable accuracy, with a mean offset of 0.05 dex. Removing these offsets, the scatter between the two fits is about 1000 K and about 0.2 dex in overall and about 25% better in the higher signal-to-noise ratio data. We take this to be an indication of the systematic uncertainties in the fitting.
Figure 7 compares the results between the DJE fits and the photometric fits. Again, the results agree well, save for one outlier to be discussed later. There is a hint that the photometric temperatures are systematically slightly lower than the DJE spectral fits (which in turn are slightly lower than the DK spectral fits). In other words, the photometry is slightly redder than the models would predict. However, one can see from the Figure that this offset is at most 1000 K, which is comparable to the level of uncertainty in the AB corrections for the SDSS photometric zeropoints. Figures 8 and 9 show the comparison of the DJE fits to the AB and colors. Again, the agreement is good.
Based on the agreement of these three temperature estimates, we feel that there is little doubt that the bulk of the stars in the sample are helium atmosphere stars between 30,000 K and 45,000 K. However, the small offsets between the 3 methods speak to a mild level of systematic uncertainty in the temperature scale, perhaps as much as 2000 K. At higher signal-to-noise ratio, there remain discrepencies between the spectroscopic and photometric data. Some of this may simply be due to be incorrect AB zeropoints, but we doubt that this can be the full explanation. If the residuals are the result of subtle differences in the line shapes, this may be due to systematic errors in the models, but it might also be small problems in the SDSS fluxing corrections.
3.6 Description of Individual Stars
3.6.1 Those with MMT Data
SDSS J001529.7010521: This star has 11 epochs of photometry that prove that the star is very blue, with a color that suggests a temperature of 35,000 K. We acquired spectroscopy from the MMT with the SPECPOL instrument. The improved signal-to-noise ratio in the red allows us to exclude H, and the spectrum is a good match to helium atmosphere at 35,500 K. Hence, we regard this star as an extremely good case for a DB at 35–36,000K.
SDSS J074538.1312205: The SDSS spectrum of this star shows a hint of HeII 4686Å line, and so this star was reobserved at the MMT with Blue Channel. There is evidence for H in the MMT spectrum, and the HeII 4686Å line is confirmed. However, no atmosphere model fits the spectrum and so we do not quote a temperature from the MMT spectrum. We include the SDSS values, as they were part of the selection, but in light of the MMT spectra, the fits to the SDSS spectra should not be trusted. The photometry suggests K. As mentioned in § 1, the presence of the HeII line requires a temperature exceeding 38,000 K. The relative strength of HeII 4686Å compared to HeI 4713Å is weak, suggesting that the star is a cool DO, perhaps close to the photometric fit in temperature, which would make it the coolest DO star yet found.
Two explanations are suggested to explain this discrepant spectrum. First, the star might have a weak magnetic field, enough to distort the line profiles, making the cores more shallow, but not enough to show Zeeman splitting. Such was the case for LB 8827 = PG 0853+164 (Putney, 1997; Wesemael et al., 2001). This remarkable DBA with a probable temperature moderately above 20,000 K shows variable circular polarization. The spectrum of SDSS J0745 might be monitored for time-dependent variations in the He and H line strengths, modulated on a rotational period. The magnetic DBA Feige 7 shows evidence for spatial variation in the He and H abundances modulated on its 2.2-hr rotational period (Liebert et al., 1977; Achilleos et al., 1992). The second possibility is that the atmospheric composition might be inhomogeneous, either because of stratification or because of spatial variability around the surface. This star would then be another example of the peculiar DAO stars mentioned in the introduction.
Thus, SDSS J074538.1312205 might be observed with a spectropolarimeter (on a large telescope) to search for weak circular polarization, as found for LB 8827. It might also be monitored for spectrum variability, modulated on a rotational period.
SDSS J090456.1525030: SDSS spectrum was too noisy to exclude H, so we reobserved this star at the MMT with the Blue Channel spectrograph. The photometry suggests K. The spectroscopic fits to the MMT spectra are higher, around 40,000K. However, these fits are not good to the eye; this is true even if one restricts the fit to blueward of 5400Å. The 40,000K model predicts a weak HeII 4686Å line that is absent from the MMT spectrum, and the line cores have the wrong depth.
The fits improve if one includes some hydrogen in the atmosphere. The H/He model grid produces a H line that is likely just permitted within the noise, and the agreement with the He line depths improve. There is a hint of a H line in the spectrum that offers some support for this interpretation. The fitted model temperature drops to 36,300 K. The photometric fit drops to , compatible with this. In other words, a DBA fit around 36,000 K is a plausible outcome. At present, we have left our classification as DB pending a resolution of the discrepency.
SDSS J095256.6015407: The SDSS and MMT Blue Channel spectra are both of high quality and argue against the presence of any Balmer lines. The spectroscopic fits yield a temperature of 34,000K, but this is about 2- high for the photometry, which suggests a temperature of 30,800K.
SDSS J140159.1022126: SDSS spectrum was too noisy to exclude H, so we reobserved this star at the MMT with the Blue Channel spectrograph. The MMT spectrum suggests that H and H are present. Fitting with a H/He ratio of 0.01 drops the spectroscopic fit by 2400K, to 36,500K, relative to a pure-helium model fit. The photometric fit is compatible with this result. Hence, although this star does have hydrogen in its atmosphere, it is almost certainly above 30,000K.
SDSS J141258.1045602: The SDSS spectrum is very nice and does not show H. This star was reobserved at the MMT with Blue Channel, and we again found no signs of Balmer lines. The spectroscopic fit is about 31,500 K; the photometry is compatible with this but somewhat redder, around 30,000 K.
3.6.2 Stars with high SDSS data
These four stars are bright enough that they have high quality SDSS data.
SDSS J113609.5+484318: This is a bright DO+M binary system, such that the SDSS spectrum is of high signal-to-noise ratio. The spectrum suggests a temperature of 45,000 K to 46,400 K. The and photometry is consistent with this; the and band photometry is anomalously bright because of the companion.
SDSS J154201.4502532: The SDSS spectrum is very nice and shows no H. The photometry supports the spectroscopic fit at 32,000–33,000 K.
SDSS J215514.4–075833: The autofit spectroscopic fits suggests a temperature of 32,000 K, while the DK fit is about 3000 K cooler. The photometry would seem to support the higher temperature. There is no sign of H in the spectrum, but there is an unexplained absorption feature at 4050Å.
SDSS J234709.3001858: This star was observed twice by the SDSS at similar signal-to-noise ratio; the other spectrum is from plate 385, fiber 623, MJD 51783. Moreover, this star has 11 epochs of photometry. The spectra would suggest a temperature around 32,000–33,000 K, but the photometry is redder than that predicted by the model. The photometry would prefer 28,700 K. No Balmer lines are visible in the SDSS spectra.
3.6.3 Other candidates from SDSS
Most of the remaining objects should simply be considered candidates. The spectra are best explained as DB or DO white dwarfs at high temperature and the photometry is generally blue. However, the spectra are generally too noisy to exclude weak Balmer lines or to detect some of the peculiarities found in the above cases. Of course, the temperature fits have more statistical uncertainty as well.
SDSS J040854.6–043354: Some noisy hints of H and H, although these are suspiciously narrow. The spectroscopy is noisy but prefers 35,000–36,500 K even with a 1% hydrogen admixture. The photometry would seem to be hotter, 40,000 K, even with the hydrogen admixture, but this is disfavored by the lack of a He II 4686Å detection. The errors are such that reconciliation closer to the spectroscopic values is the likely outcome.
SDSS J081115.0+270621: This is a low temperature DO star, likely around 47,500 K.
SDSS J081546.0+244603: This is a low temperature DO star, likely around 46,000 K.
SDSS J084823.5+033216: The spectrum suggests 32,000–34,000 K and the photometry is consistent with this, if not a little bluer.
SDSS J084916.1+013721: This star is likely at the low end of the temperature range in this paper. The spectrum is fit to 29,500 K, and the photometry is somewhat redder than this, albeit consistent.
SDSS J090232.1+071929: The spectrum and photometry both favor 30,000 K.
SDSS J092544.4+414803: The best fit to the spectrum is 39,000 K. The photometry is slightly redder than this, but consistent.
SDSS J093041.8+011508: The spectrum is noisy but suggests 32,000-34,000 K. However, the photometric fit is significantly cooler than this, below 30,000 K with a best fit around 26,700 K.
SDSS J093759.5+091653: The spectroscopy suggests 31,500 K while the photometry is about 2 redder (27,600 K).
SDSS J123750.4+085526: The spectroscopic fit is 31,000–34,000 K; the photometry is slightly bluer but consistent.
SDSS J134524.9–023714: The spectroscopic fits call for a 38,000-41,000 K temperature. The photometry is somewhat redder but consistent. The spectrum is noisy enough that the HeII lines implied by the higher temperature can’t be excluded.
SDSS J141349.4+571716: The spectroscopy and photometry both support a 30,000-31,000 K temperature. Although there is a small absorption feature near where H would be, the wavelength doesn’t match exactly and so we think this is probably noise.
SDSS J143227.2+363215: The spectroscopic fits disagree somewhat, 29,000 K and 32,700 K, but the higher temperature DK fit is clearly affected by continuum artifacts that render it suspect to the eye. The photometry argues for the lower value, with an upper limit of about 31,000 K.
SDSS J153852.3–012133: This star shows indications of H and H, so we classify it as DBA. With 1% hydrogen in the atmosphere, the two spectroscopic fits fall on either side of the DBV degeneracy, 22,000 K and 30,000 K. The dereddened photometry is much bluer, suggesting 35,000 K and supporting the higher temperature. However, this line of sight has an unusually high extinction, mag, so it is possible that the photometry has been overcorrected. While this star is probably around 30,000 K, the possibility that it is on the lower temperature side of the degeneracy cannot be completely excluded with the SDSS data.
SDSS J164703.4+245129: The spectrum is noisy, but the best fit is 32,000–33,000 K. The photometry is somewhat bluer than this model but consistent.
SDSS J211149.5–053938: This star shows a hint of H, so we classify it as DB A:. The spectroscopic fit with a 1% hydrogen atmosphere is 36,000 K with autofit; the photometry supports this. The DK fit finds 47,400 K, but this is not consistent with the lack of HeII lines. A higher quality red spectrum is required to confirm the H signature.
SDSS J212403.1+114230: The spectroscopic fits find 30,000–32,000 K, and the photometry is consistent with this.
SDSS J222833.8141036: The spectrum shows indications of a faint M star companion redward of 7000Å. The photometry prefers a somewhat cooler temperature than the spectroscopy, 28,500 K versus 33,000 K, but some of this skewing might be due to the band being made slightly brighter by the companion. The color, however, is consistent with the spectroscopic temperature.
4 Is there a DB gap?
Having shown that the temperature range between 30,000 K and 45,000 K is not devoid of helium atmosphere white dwarfs, we would like to understand whether there is any deficiency at all of DB stars at this temperature. In other words, do all low-temperature DB stars go through a high-temperature DB phase? In principle, one would like to construct a temperature function, namely the number density of stars at each temperature, and compare that to the steady state distribution given the cooling rates. In practice, this is tricky because given the flux limits of the SDSS, one is probing larger distances for the hotter stars and these distances are large enough that we can see out to several times the scale height of the Galactic disk. In other words, to construct the temperature function, one must first model the distribution of white dwarfs in the Galactic disk.
It is likely easier to use the DA stars as a sentinal for the Galactic distribution by forming the ratio of the number of DA to DB stars in the same volume of space and then studying the temperature dependence of that ratio. If DA and DB stars cool at the same rate, then in a given volume of space if these two types of stars do not convert from one to another (or convert into another class of white dwarf), then the ratio should remain constant. More generally, we simply require that the two types of stars have cooling rates ( as a function of ) that differ by at most a temperature-independent multiple. Comparison of hydrogen envelope and hydrogen-free cooling models by G. Fontaine in Liebert et al. (2005) indicates that no signficant differences in the cooling rates occur for a mass of between 45,000 K and 15,000 K, supporting our assumption.
We will use DA and DB white dwarfs from the SDSS DR4 white dwarf catalog (Eisenstein et al., 2005), focusing on the region between 15,000 and 40,000 K. For the hot DBs, we adopt the pure-helium fit to the SDSS spectra. We optionally include DBA stars as DBs, without adjusting their temperatures for the mixed atmosphere. Otherwise, we exclude classes other than DB or DA (e.g., we exclude DA+M binaries). We adopt the DA temperatures from Eisenstein et al. (2005). We do not use the errors on the temperatures, and we omit stars below 15,000 K because the helium lines are getting weak.
To make this a clean test, we want to probe the DA and DB stars in the same volume of space (at each temperature). It is acceptable for different temperatures to probe different volumes so long as the comparison at each temperature is fair. A simple flux limit would nearly accomplish the goal, but at a fixed temperature and surface gravity, DA and DB stars do not have exactly the same optical magnitude because of the details of the atmospheres and resulting bolometric corrections. For example, at 20,000 K a DA star is about 0.1 mag fainter in than a DB star, whereas at 30,000 K, the DA star is about 0.25 mag brighter. For our analysis, we require at all temperatures that the DB stars have . We then find, at each temperature, the flux limit for the DA stars that would detect both the DA and DB star out to the same distance. Here, we assume that both the DA and DB stars have the same surface gravity, .
Because DA and DB stars have a spread in radii and surface gravities, a flux limit does not correspond to a fixed distance limit at a given temperature. Larger stars (less massive white dwarfs) can be detected to greater distance. If DA and DB stars had the same distribution of surface gravities, then the fuzziness of the distance boundary would not be a problem. However, it is known that DB stars have a tighter distribution of (Beauchamp, 1995). Populations of particularly high-mass and particularly low-mass DA stars exist that don’t seem to have a DB analog. This is likely due to different formation mechanisms (See discussion in Liebert et al., 2005). To address this, we only include DA stars with . We include all DB stars. Note that although the autofit method does produce a surface gravity estimate, we are not using this to compute a distance.
Finally, the completeness of the SDSS catalog must be modeled. The important selection boundary is the cut of the Hot Standard class. DB stars are bluer than this at all temperatures above 14,000 K, but DA stars become redder than around 22,000 K. Eisenstein et al. (2005) presents a simple completeness analysis for unblended blue stars, finding that at , the completeness of the SDSS at is only 66% of that at . We therefore upweight the redder stars by a factor of 1.5 and restrict ourselves to unblended stars where the completeness is highest. The unblended cut itself produces an incompleteness that depends on magnitude and Galactic latitutde, but this is irrelevant for our comparison because it affects DA and DB stars nearly equally. We exclude blended stars (Eisenstein et al., 2005).
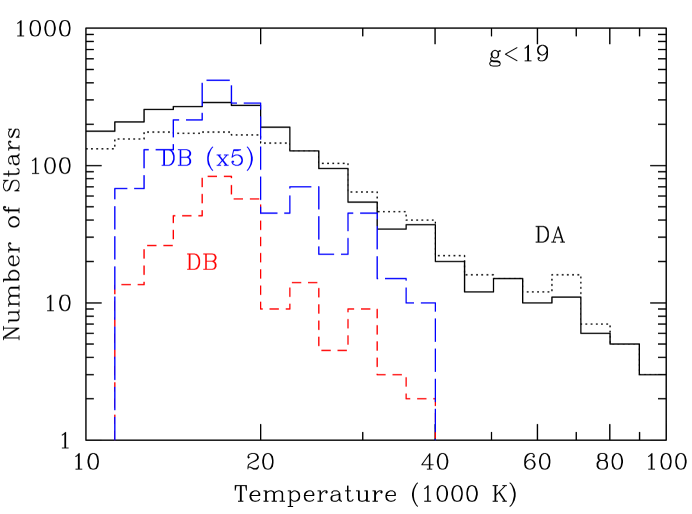
Figure 10 shows the histogram of temperatures for the DA and DB stars, having weighted for color-dependent incompleteness and applying the temperature-dependent flux cuts to the DAs. Including the DBA stars, the ratio of DA to DB stars is 5 between 16,000 and 22,000 K (703 and 139 stars), but increases to 12.5 between 25,000 and 40,000 K (226 and 18 stars). In other words, the DB gap appears to be deficient by a factor of 2.5.
Adjusting various aspects of our analysis does not appear to affect this deficit. Excluding the DBA stars or including the DAs of other alters the ratio of DA to DB stars, but the factor of roughly 2.5 between the hot and cool ratios persists. For example, excluding the DBA stars, the factor is 2.2. Similarly, if one assumes the DB stars to be while leaving the DA stars at , then the flux limit for the DA sample becomes brighter to maintain the same volume, but this simply increases the DB to DA ratio at all temperatures without affecting the deficit in the gap. In other words, the ratios 5 and 12.5 given above are less robust than their ratio.
Could this factor of 2.5 be an artifact of our temperature fits? Such a result seems difficult to arrange. A relatively smooth systematic bias in either the DA or DB fits would shift the histograms but wouldn’t warp them enough to remove the deficit. For the DA stars, the trends of the line profiles versus temperature over the range in question are strong and monotonic; moreover, the results are supported by the locus of color versus temperature (Eisenstein et al., 2005). It is difficult to imagine how one could suppress the DA histogram by a factor of 2.5 at 30,000 K. For the DB stars, if the normalization at 20,000 K is correct, then we should have found of order 70 hot DB stars instead of the 28 in this paper. We do not believe the catalog could be this incomplete. The final route is to try to soften the peak in the DB histogram at 20,000 K and shift some of those stars towards lower or higher temperatures. But there are simply too many DB stars in the peak (note that Fig. 10 is on a logarithmic scale). Even between 14,000 and 25,000 K, the ratio of DA to DB stars is 7, much less than 14, and we don’t plausibly see how to shift these rank-and-file DB stars to be hotter than 25,000 K or less than 14,000 K.
If the change in DA to DB ratio from 30,000 K to 20,000 K is caused by some DAs turning into DBs, and if the ratio of 5 at low temperatures is correct, then this means that roughly 12% of 30,000 K DA stars turn into 20,000 K DB stars.
If one considers yet hotter temperatures, then the DO stars seem to rebound in number compared to the hot DAs. The DA histogram includes 96 stars at K down to . Meanwhile, the DR4 catalog includes 22 non-binary, non-blended DO stars at , most above 50,000 K. There are 10 PG1159 stars as well, and these are thought to mostly be white dwarfs, although some are hot subdwarfs. Hence, taking the simplest route, the ratio of DA to non-DA white dwarfs at temperatures above 40,000 K is about 3, less than even the value of 5 found at 20,000 K and much less than the ratio at 30,000 K. Because the temperature measurements in all three classes of these stars are somewhat uncertain, we postpone a detailed treatment of the temperature dependence of the ratio. Moreover, we have not included any differential bolometric correction for the survey depth for the DAs and DOs. Still, there is little doubt that the DA fraction drops at the highest temperatures.
Although it is unlikely to matter, we should note that although our calculations of DA to DB ratios is fair at each temperature, we are probing different volumes of space as a function of temperature. In other words, if the DB to DA ratio dropped as a function of distance above the Galactic plane, we would see a trend with temperature that could mimic an evolutionary transformation. However, the fact that the DB gap was discovered in much brighter and closer samples suggests that this is not the cause.
Clearly, the above is only a first analysis, and more work is needed to firm up this quantitative factor of 2.5 as the deficit in the DB gap and to better measure the transition temperatures. Such work could include the surface gravities as a distance measure, but more importantly it is necessary to more carefully place the DA and DB stars on the same physical temperature and surface gravity scale. Our autofit work can only be considered approximate for this task. Figure 10 hints that the transition temperature may even be closer to 20,000 K, but we have chosen to be conservative and not tune our bins to fine details in the histogram. Further, to quantify the gap more finely, one will probably need to consider what role the mixed types of stars, such as DBA, or other classes of WD, such as the hot DQs, play in the DB gap. The numbers of these stars are sufficiently less than the 55% of the DB stars (i.e., the gap) that they can’t plausibly fill the gap, but their numbers might well be large enough to shift the quantification of the deficiency. Finally, subtle differences in the cooling function between DA and DB could alter the amount of transformation implied. These kinds of detailed modeling and evolutionary questions have been long-standing topics in the white dwarf literature. Because of the complicated nature of these systematic uncertainties, we are hesitant to quote an error bar on our 2.5 value. We expect that if one pushed the numbers and the definitions, one could reach 2 or 3. Hopefully this first quantification of the DB gap will encourage further work on constraining these evolutionary paths.
5 Conclusions
In summary, we have presented 28 stars as candidate hot DB or cool DO white dwarfs. Some of the stars have compelling evidence for being between 30,000 and 45,000 K, in the DB gap. These are the first helium-atmosphere white dwarfs found in this range of temperature. Given the existence of strong proof in these cases, it is likely that most of the candidates with noisier data are also at the temperatures indicated by their spectroscopic and photometric fits.
Of the ten stars with particularly good observations, six of them have strong evidence for being DB stars above 30,000 K: SDSS J001529.7010521, SDSS J095256.6015407, SDSS J140159.1022126 (despite some hydrogen), SDSS J090456.1525030 (but not a perfect fit), SDSS J154201.4502532, and SDSS J215514.43–075833.7. Two other well-observed stars are only somewhat cooler, 28,000–30,000 K: SDSS J141258.1045602 and SDSS J234709.3001858. The final two are cool DO stars: the DO+M star SDSS J113609.59+484318.9 at 45,000 K and the possibly weakly magnetic SDSS J074538.17+312205.3.
The 18 other stars in this paper are noisier candidates from the same vein. Two are cool DO stars, and one DBA (SDSS J153852.34–012133.7) is sufficiently uncertain that could be below 25,000 K. The other 15 are DB and DBA stars with temperature estimates between 28,000 K and 39,000 K. Some of these stars, notably SDSS J074538.1+312205, may be similar to some of the previously known “peculiar” DAB/DBA/DAO stars discussed above, but more observations will be needed to establish these links.
Helium atmospheres are not as well understood as hydrogen ones, and it is certainly possible that the temperature scale inferred from our modeling has systematic biases. The trend among several of our examples with better data for the spectroscopic fit to be K hotter than the photometric fit may be an indication of such a bias. On the other hand, several of the stars have consistent results between the two methods and some of the noisier examples have warmer photometric fits. Whether these differences reflect real differences in the properties of the atmospheres or simply unmodelled errors in the data remains to be seen.
Our results clearly show that helium atmosphere stars do exist at temperatures above the DBV strip at K and below the HeII DO stars at 47,000 K and up. The DB gap is not empty. Indeed, we find a continuous distribution of temperatures.
However, in comparing the ratio of the numbers of DB and DA stars as a function of temperature, we find that there remains a factor of 2.5 deficit in the density of DB stars at temperatures between 25,000 and 40,000 K as compared to a baseline established between 16,000 and 22,000 K. This was a simple analysis, with several assumptions about fine details that one would hope to improve, but our results support the remarkable idea that about 10% of 30,000 K DA stars become DB stars by the time they have cooled to 20,000 K. The mechanism for this transformation remains a mystery.
DJE was supported by grant AST-0098577 and AST-0407200 from the National Science Foundation and by an Alfred P. Sloan Research Fellowship. JL acknowledges support from NSF grant AST-0307321 for work on white dwarfs found in the SDSS.
Funding for the creation and distribution of the SDSS Archive has been provided by the Alfred P. Sloan Foundation, the Participating Institutions, the National Aeronautics and Space Administration, the National Science Foundation, the U.S. Department of Energy, the Japanese Monbukagakusho, and the Max Planck Society. The SDSS Web site is http://www.sdss.org/.
The SDSS is managed by the Astrophysical Research Consortium (ARC) for the Participating Institutions. The Participating Institutions are The University of Chicago, Fermilab, the Institute for Advanced Study, the Japan Participation Group, The Johns Hopkins University, the Korean Scientist Group, Los Alamos National Laboratory, the Max-Planck-Institute for Astronomy (MPIA), the Max-Planck-Institute for Astrophysics (MPA), New Mexico State University, University of Pittsburgh, University of Portsmouth, Princeton University, the United States Naval Observatory, and the University of Washington.
References
- Abazajian et al. (2003) Abazajian, K., et al., 2003, AJ, 126, 2081
- Abazajian et al. (2004) Abazajian, K., et al., 2004, AJ, 128, 502
- Abazajian et al. (2005) Abazajian, K., et al., 2005, AJ, 129, 1755
- Achilleos et al. (1992) Achilleos, N., Wickramasinghe, D.T., Liebert, J., Saffer, R., & Grauer, A.D. 1992, ApJ, 396, 273
- Adelman-McCarthy et al. (2006) Adelman-McCarthy, J., et al., 2006, ApJS, 162, 38
- Beauchamp (1995) Beauchamp, A. 1995 PhD Dissertation, Université de Montréal (Détermination des paramétres atmosphériques del étoiles naines blanches de type DB)
- Beauchamp, Wesemael, and Bergeron (1997) Beauchamp, A., Wesemael, F., & Bergeron, P. 1997, ApJS, 108, 559
- Bergeron et al. (1994) Bergeron, P., Wesemael, F., Beauchamp, A., Wood, M.A., Lamontagne, R., Fontaine, G., & Liebert, J. 1994, ApJ, 432, 305
- Blanton et al. (2003a) Blanton, M.R., Lupton, R.H., Maley, F.M., Young, N., Zehavi, I., Loveday, J., 2003a, AJ, 125, 2276
- Bohlin et al. (2001) Bohlin, R.C., Dickinson, M.E., & Calzetti, D., 2001, AJ, 122, 2118
- Bradley (1998) Bradley, P.A. 1998, ApJS, 116, 307
- Clemens (1995) Clemens, J.C. 1995 in Lecture Notes in Physics, v. 433, eds. D. Koester & K. Werner, (Heidelberg: Springer-Verlag) p. 294
- Cunto & Mendoza (1992) Cunto, W. & Mendoza, C. 1992, Revista Mexicana de Astronomia y Astrofisica, vol. 23, 23, 107
- Cunto et al. (1993) Cunto, W., Mendoza, C., Ochsenbein, F., & Zeippen, C. J. 1993, A&A, 275, L5
- Dimitrijevic & Sahal-Brechot (1984a) Dimitrijevic, M. S. & Sahal-Brechot, S. 1984a, Journal of Quantitative Spectroscopy and Radiative Transfer, 31, 301
- Dimitrijevic & Sahal-Brechot (1984b) —. 1984b, A&A, 136, 289
- Dimitrijevic & Sahal-Brechot (1990) —. 1990, A&AS, 82, 519
- Dreizler and Werner (1996) Dreizler, S. and Werner, K. 1996 A&A, 314, 217
- Eisenstein et al. (2001) Eisenstein, D.J., et al., 2001, AJ, 122, 2267
- Eisenstein et al. (2005) Eisenstein, D.J., et al., 2005, ApJS, submitted
- Finley et al. (1997) Finley, D. S., Koester, D., & Basri, G. 1997, ApJ, 488, 375
- Fontaine and Wesemael (1987) Fontaine, G., & Wesemael, F. 1987, in The Second Conference on Faint Blue Stars, eds. A.G. Davis Philip, D.S. Hayes, & J. Liebert, (Schenectady NY: L. Davis Press) p. 319-326
- Friedrich et al. (2000) Friedrich, S., Koester, D., Christlieb, N., Reimers, D., & Wisotzki, L. 2000, A&A, 363, 1040
- Fukugita et al. (1996) Fukugita, M., Ichikawa, T., Gunn, J.E., Doi, M., Shimasaku, K., & Schneider, D.P., 1996, AJ, 111, 1748
- Gunn et al. (1998) Gunn, J.E., et al., 1998, AJ, 116, 3040
- Gunn et al. (2005) Gunn, J.E., et al., 2005, AJ, 131, 2332
- Griem (1974) Griem, H. R. 1974, Spectral line broadening by plasmas (Pure and Applied Physics, New York: Academic Press, 1974)
- Harris et al. (2003) Harris, H., et al., 2003, AJ, 126, 1023
- Heber, Dreizler and Hagen (1996) Heber, U., Dreizler, S., and Hagen, H.J. 1996, A&A, 311, 17
- Hogg et al. (2001) Hogg, D.W., Finkbeiner, D.P., Schlegel, D.J., & Gunn, J.E. 2001, AJ, 122, 2129
- Homeier et al. (1998) Homeier, D., Koester, D., Hagen, H. J., Jordan, S., Heber, U., Engels, D., Reimers, D., & Dreizler, S. 1998, A&A, 338, 563
- Ivezić et al. (2004) Ivezić, Ẑ, et al., 2004, AN, 325, 6-8, 583
- Jordan et al. (1993) Jordan, S., Heber, U., Engels, D., & Koester, D. 1993, A&A, 273, 27
- Kleinmann et al. (2004) Kleinmann, S., et al., 2004, AJ, 607, 426
- Koester, Liebert and Saffer (1994) Koester, D., Liebert, J., & Saffer, R.A. 1994, ApJ, 422, 783
- Koester & Wolff (2000) Koester, D. & Wolff, B. 2000, A&A, 357, 587
- Koester et al. (2001) Koester, D. et al. 2001, A&A, 378, 556
- Koester et al. (2005) Koester, D., Napiwotzki, R., Voss, B., Homeier, D., & Reimers, D. 2005, A&A, 439, 317
- Krzesiński et al. (2004) Krzesiński, J., Nitta, A., Kleinman, S.J., Harris, H.C., Liebert, J., Schmidt, G., Lamb, D.Q., & Brinkmann, J., 2004, A&A, 417, 1093
- Liebert et al. (1977) Liebert, J., Angel, J.R.P., Stockman, H.S., Spinrad, H., & Beaver, E.A. 1977, ApJ, 214, 457
- Liebert et al. (1984) Liebert, J., Wesemael, F., Sion, E.M., & Wegner, G. 1984, ApJ, 277, 692
- Liebert et al. (1986) Liebert, J., Wesemael, F., Hansen, C.J., Fontaine, G., Shipman, H.L., Sion, E.M., Winget, D.E., and Green, R.F. 1986, ApJ, 309, 241
- Liebert et al. (2005) Liebert, J., Fontaine, G., Young, P.A., Arnett, D., & Williams, K., 2005, in preparation
- Lupton et al. (2001) Lupton, R., Gunn, J.E., Ivezić, Z., Knapp, G.R., Kent, S., & Yasuda, N. 2001, in ASP Conf. Ser. 238, Astronomical Data Analysis Software and Systems X, ed. F. R. Harnden, Jr., F. A. Primini, and H. E. Payne (San Francisco: Astr. Spc. Pac.); astro-ph/0101420
- MacDonald & Vennes (1991) MacDonald, J., & Vennes, S. 1991, ApJ, 370, 355
- Pereira, Bergeron and Wesemael (2005) Pereira, C., Bergeron, P., & Wesemael, F. 2005, ApJ, 623, 1076
- Pier et al. (2003) Pier, J. R., et al. 2003, AJ, 125, 1559
- Putney (1997) Putney, A., ApJS, 112, 527
- Richards et al. (2002) Richards, G., et al. 2002, AJ, 123, 2945
- Schlegel et al. (1998) Schlegel, D., Finkbeiner, D., Davis, M., 1998, ApJ, 500, 525
- Schmidt et al. (1992) Schmidt, G., Stockman, H.S., & Smith, P.S., 1992, ApJ, 398, L57
- Seaton (1987) Seaton, M. 1987, Journal of Physics B Atomic Molecular Physics, 20, 6363
- Smith et al. (2003) Smith, P.S., Schmidt, G., & Hines, D.C., 2003, ApJ, 593, 676
- Smith et al. (2002) Smith, J.A., Tucker, D.L., et al., 2002, AJ, 123, 2121
- Stoughton et al. (2002) Stoughton, C. et al. 2002, AJ, 123, 485
- Strauss et al. (2002) Strauss, M.A., et al., 2002, AJ, 124, 1810
- Thejll et al. (1991) Thejll, P., Vennes, S., & Shipman, H.L. 1991, ApJ, 370, 355
- Tucker et al. (2005) Tucker, D.L., et al., 2005, AJ, submitted
- Vennes et al. (2004) Vennes, S., Dupuis, J., & Chayer, P. 2004, ApJ, 611, 1091
- Wesemael, Green and Liebert (1985) Wesemael, F., Green, R.F., and Liebert, J. 1985, ApJS, 58, 379
- Wesemael et al. (2001) Wesemael, F., Liebert, J., Schmidt, G.D., Beauchamp, A., Bergeron, P., & Fontaine, G. 2001, ApJ, 554, 1118
- York et al. (2000) York, D.G., et al., 2000, AJ, 120, 1579