11email: jcombi@ujaen.es 22institutetext: Departament d’Astronomia i Meteorologia, Universitat de Barcelona, Martí i Franquès 1, 08028 Barcelona, Spain 33institutetext: AIM - Astrophysique Interactions Multi-échelles (UMR 7158 CEA/CNRS/Université Paris 7 Denis Diderot), CEA Saclay, DSM/DAPNIA/Service d’Astrophysique, Bât. 709, L’Orme des Merisiers, 91191 Gif-sur-Yvette Cedex, France
Multi-wavelength properties of the high-energy bright Seyfert 1 galaxy IGR~J18027$-$1455
A new sample of hard X-ray sources in the Galactic Plane is being revealed by the regular observations performed by the INTEGRAL satellite. The full characterization of these sources is mandatory to understand the hard X-ray sky. Here we report new multifrequency radio, infrared and optical observations of the source IGR~J18027$-$1455, as well as a multi-wavelength study from radio to hard X-rays. The radio counterpart of IGR~J18027$-$1455 is not resolved at any observing frequency. The radio flux density is well fitted by a simple power law with a spectral index . This value is typical of optically thin non-thermal synchrotron emission originated in a jet. The NIR and optical spectra show redshifted emission lines with , and a broad H line profile with FWHM 3400 km s-1. This suggests an Active Galactic Nucleus (AGN) of type 1 as the optical counterpart of IGR~J18027$-$1455. We confirm the Seyfert 1 nature of the source, which is intrinsically bright at high energies both in absolute terms and when scaled to a normalized 6 cm luminosity. Finally, comparing its X-ray luminosity with isotropic indicators, we find that the source is Compton thin and AGN dominated. This indicates that INTEGRAL might have just seen the tip of the iceberg, and several tens of such sources should be unveiled during the course of its lifetime.
Key Words.:
X-ray: individuals: IGR~J18027$-$1455 – X-rays: galaxies – Radio continuum: galaxies – Galaxies: Seyfert – Infrared: galaxies1 Introduction
Unidentified high energy sources have been a subject of interest from the early days of the COS-B era. In the 1990s, with the advent of X-ray/-ray satellites like ASCA and CGRO the number of sources with unidentified counterparts at other frequencies increased considerably. During the first year of observations, the IBIS/ISGRI instrument on board the INTEGRAL satellite (Winkler et al. 2003) detected 123 hard X-ray/-ray point sources, 28 of which had no clear identification with known objects in other ranges of the electromagnetic spectrum (Bird et al. 2004). These X-ray/-ray emitters could be high or low mass X-ray binaries, radio quiet pulsars, clusters of galaxies, or a significant fraction of any class of AGNs heavily obscured, at few keV, by the absorbing material of the galactic plane. The possibility that several unidentified IBIS sources were of extragalactic nature was early suggested by some authors (Ribó et al. 2004; Combi et al. 2004; Masetti et al. 2004a; Masetti et al. 2004b; Bassani et al. 2004; Combi et al. 2005).
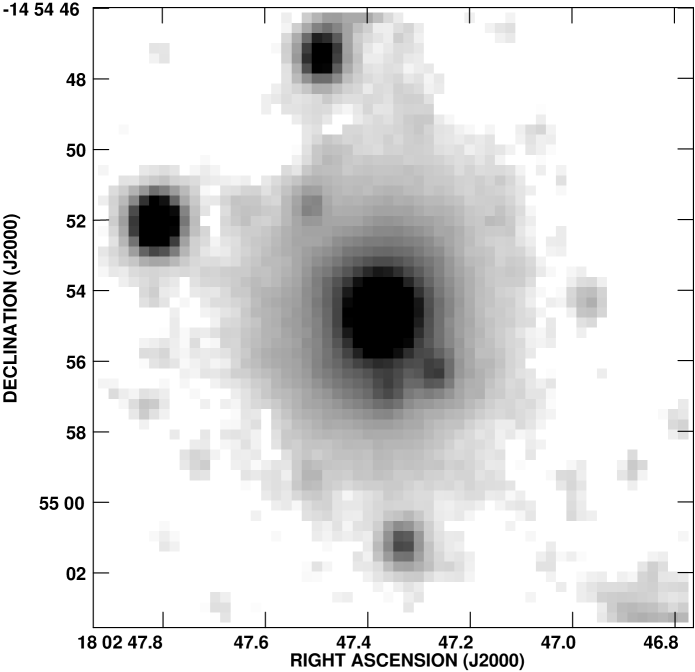
The source IGR~J18027$-$1455 is one of such sources. It was discovered in the energy range from 20 to 100 keV during 769 ks of observations. Looking for possible counterparts Combi et al. (2004) found two weak point-like radio sources from the 20 cm NRAO VLA Sky Survey (NVSS, Condon et al. 1998) inside its 2 arcmin-radius position error circle (see Fig. 1). One of them, NVSS~J180247$-$145451, lies inside and near the edge of the 2 position error circle of the faint ROSAT X-ray source 1RXS~J180245.5$-$145432 (Voges et al. 2000), which is the only soft X-ray source well within the IBIS/ISGRI error circle. In addition, inside the 2 position error ellipse of this radio source, it is located an extended near infrared (NIR) source, 2MASS~J18024737$-$1454547 (Cutri et al. 2003; Skrutskie et al. 2006), with standard aperture magnitudes , , and . Its optical counterpart has average magnitudes , and in the USNO-B1.0 catalog (Monet et al. 2003). The photometry of the NIR/optical counterpart is not consistent with a stellar spectrum (Combi et al. 2004). On the basis of spectroscopic optical observations Masetti et al. (2004b) have tentatively classified this source as a Seyfert 1 galaxy at redshift .

An important characteristic of AGNs is that they radiate over a wide range of frequencies, from radio to gamma-rays. For this reason, multi-wavelength observations are an important tool to discriminate between objects of different classes. Here we report multi-wavelength observations of IGR~J18027$-$1455 and discuss the obtained results. The structure of the paper is as follows. In Sect. 2 we describe our radio continuum, NIR and optical observations and present the results. In Sect. 3 we discuss the nature of all the detected multi-wavelength emissions and we summarize our conclusions in Sect. 4.
2 Multi-wavelength observations and results
2.1 Radio
The field of IGR~J18027$-$1455 was observed with the NRAO111The National Radio Astronomy Observatory is a facility of the National Science Foundation operated under cooperative agreement by Associated Universities, Inc. Very Large Array (VLA) on 2004 December 4 and 9, with the array being in its most extended A configuration. Each observing run lasted for 2 h distributed among the wavelengths of 20, 6 and 3.5 cm, always with two IF pairs of 50 MHz each. The visibilities were edited and calibrated using the AIPS software package of NRAO. The amplitude scale was set by observing the primary VLA calibrator 3C~286 and following the prescriptions recommended in the AIPS Cookbook concerning baseline range and reduction percentage of expected flux density as a function of the observed wavelength and array configuration. The phase calibrator observed was the nearby source J1733$-$130 at all frequencies. The analysis of our two individual epochs did not reveal radio sources with significant variability above the uncertainty of our amplitude calibration. Therefore, we concatenated the visibility data of individual epochs in order to analyze them together. Unfortunately, the source was accidentally placed 18 from the phase center, so we had to correct for primary beam response using the AIPS task PBCOR. The resulting flux densities of NVSS~J180247$-$145451, our candidate radio counterpart to IGR~J18027$-$1455, are presented in Table 1.
| Flux Density | Apparent deconvolved angular size | P.A. | |
|---|---|---|---|
| (cm) | (mJy) | () | (°) |
| 20 | |||
| 6 | |||
| 3.5 |
Our first VLA maps of NVSS~J180247$-$145451 displayed a clearly elongated radio source, as evidenced by the apparent deconvolved angular sizes of Table 1. However, this elongation is compatible with the expected bandwidth smearing for a source located at 18 from the phase center (Taylor et al. 2004). In fact, the object was found to be consistent with being unresolved at all frequencies. In order to avoid showing a visually misleading figure, we present our VLA map in Fig. 2 with the clean components convolved with a Gaussian beam artificially broadened in order to approximately compensate for the expected effects of bandwidth smearing. The corresponding beam at 6 cm wavelength is 131079 with position angle of 836, which reveals the point-like nature of the source at this resolution.

| Source | Pos. uncertainty | Astrometry | ||||||||
|---|---|---|---|---|---|---|---|---|---|---|
| IGR~J18027$-$1455 | 18h | 02m | 46 | 0 | 14° | 54′ | 10 | 0 | 2′(90% or 1.6) | 1st IBIS/ISGRI (Bird et al. 2004) |
| NVSS~J180247$-$145451 | 18h | 02m | 47 | 375 | 14° | 54′ | 54 | 78 | 002 (68% or 1) | this work |
| 2MASS~J18024737$-$1454547 | 18h | 02m | 47 | 370 | 14° | 54′ | 54 | 76 | 003 (68% or 1) | 2MASS (Cutri et al. 2003) |
| USNO-B1.0~0750-0506536 | 18h | 02m | 47 | 38 | 14° | 54′ | 55 | 1 | 02 (68% or 1) | USNO-B1.0 (Monet et al. 2003) |
| 1RXS~J180245.5$-$145432 | 18h | 02m | 45 | 5 | 14° | 54′ | 32 | 0 | 190 (68% or 1) | ROSAT (Voges et al. 2000) |
Our best estimate of the radio source position is and , determined from 3.5 cm observations. The positions of the objects at different wavelengths are summarized in Table 2. The radio spectrum is well fitted by a simple power law .
2.2 Near to far infrared
We conducted photometric (, and filters) and spectroscopic (0.9–2.5 m) NIR observations of 2MASS~J18024737$-$1454547 on 2004 July 10 with the spectro-imager SofI, installed on the ESO New Technology Telescope (NTT). We used the large field imaging of SofI’s detector, giving an image scale of 0288 pixel-1 and a field of view of 494494. Concerning the photometric observations, we repeated a set of observations for each filter with 9 different 30″ offset positions including 2MASS~J18024737$-$1454547, with an integration time of 90 seconds for each exposure, following the standard jitter procedure allowing to cleanly subtract the blank sky emission in NIR. We observed two photometric standard stars of the faint NIR standard star catalog of Persson et al. (1998): sj9157 and sj9172.
We used the IRAF (Image Reduction and Analysis Facility package) suite to perform the data reduction, including flat-fielding and NIR sky subtraction. For the three obtained images, one in each filter, we obtained an astrometric solution by using more than 200 coincident 2MASS objects, with a final rms of 007 in each coordinate. We show the final band image in Fig. 3, where the extended nature of 2MASS~J18024737$-$1454547 can be easily seen. We carried out aperture photometry and transformed the instrumental magnitudes into apparent magnitudes with the standard relation: where and are respectively the apparent and instrumental magnitudes, Zp is the zero-point, the extinction and the airmass. The observations were performed through an airmass close to 1. We obtained two sets of measurements for different appertures to include only the nucleus or the nucleus plus all the extended emission. Using a 4-pixel aperture diameter (12), and an adjacent annulus with outer radius of 5 pixels to estimate the sky background, we obtain: , and . The magnitudes of the whole extended emission (nucleus+host galaxy) are: , and . These last values are compatible within errors to those present in the 2MASS catalog, obtained with a 4″ aperture, except for the band, where we find a slightly brighter source.
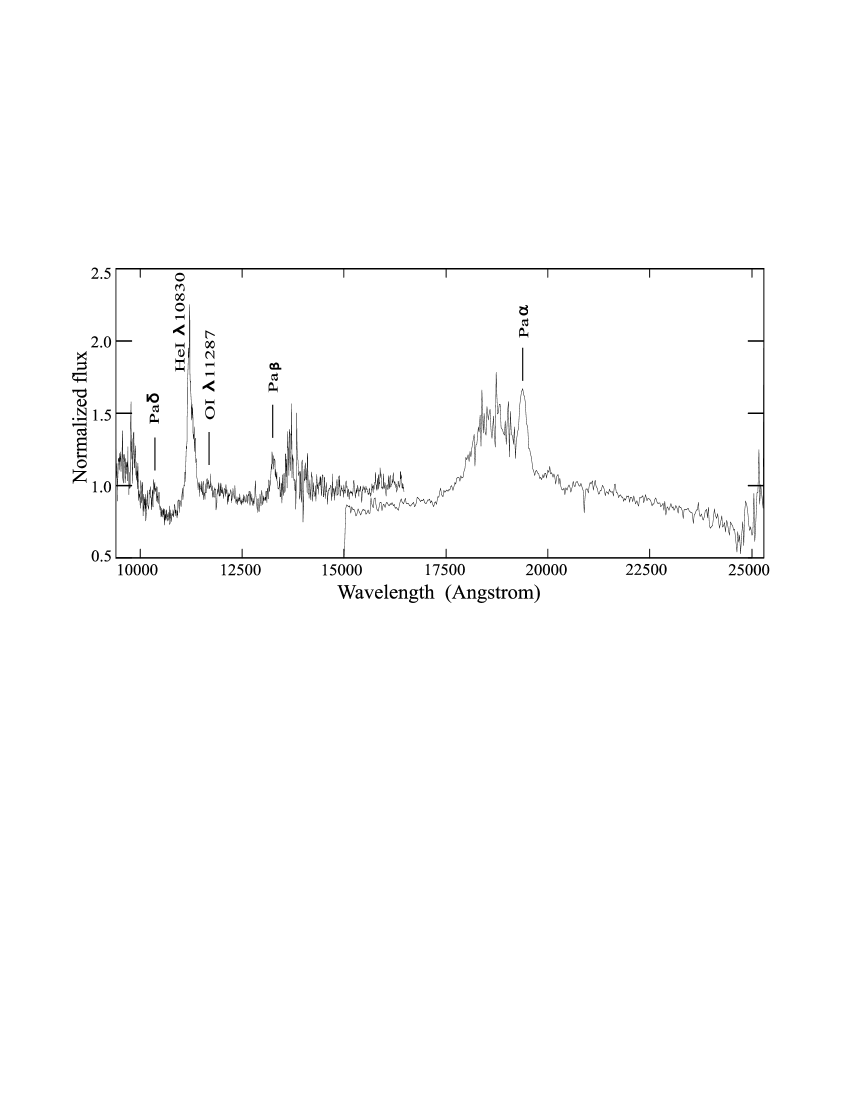
Concerning the NIR spectroscopy, we took 12 spectra with the Blue and Red grisms, respectively. The position of 2MASS~J18024737$-$1454547 in the slit was offset 30″ in half of the exposures to subtract the blank NIR sky. The total integration time was 240 s in each grism. We took Xe lamp exposures to perform the wavelength calibration. We extracted the spectra using the IRAF noao twodspec package. Figure 4 shows the obtained normalized spectrum with the most important NIR emission lines indicated. We were unable to completely remove the telluric features between 1.8 and 1.93 m, due to the atmospheric absorption. Several lines as Pa, He i 10830, O i 11287 (clearly detected after binning the spectrum), Pa and Pa are clearly visible. Using these NIR emission lines we obtain a redshift to the source of . We found no Br emission nor any [Fe ii] component.
We finally cross checked the position of the radio source NVSS J180247145451 with the IRAS222http://irsa.ipac.caltech.edu/applications/Gator/ Point Source catalog. At the mid-far infrared part of the spectrum, from 12 to 100 microns, we found no counterpart to our target. A total of 1168 IRAS sources lie in a circle of 3° radius centered around the radio position. As explained in Filliatre & Chaty (2004), we estimate as a robust upper limit for our target the flux such as 90% of the IRAS sources have greater fluxes, leading to 0.40, 0.35, 0.72, 9.1 Jy at 12, 25, 60 and 100 microns, respectively.
2.3 Optical
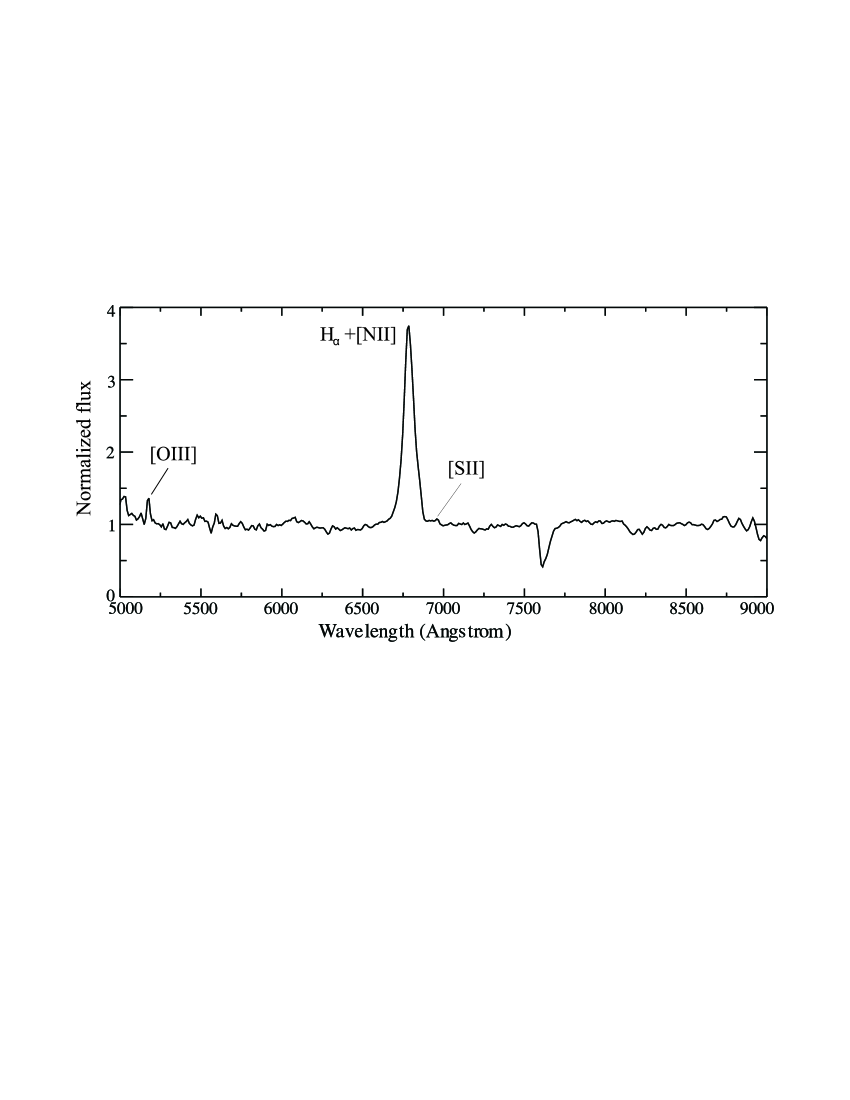
The optical counterpart candidate of IGR~J18027$-$1455, namely USNO-B1.0~0750-0506536, was observed in 2004 July 19 with the 2.2 m telescope of the Centro Astronómico Hispano Alemán (CAHA) in Calar Alto (Spain) under Director Discretionary Time (DDT). We used the CAFOS spectrograph with the grism R400 initially selected based on sensitivity criteria. This instrumental setup provided a dispersion of 9.65 Å pixel-1 with the CCD detector being a SITE#1d_15 chip. Three science exposures, of 20 min each, were taken and combined into a single spectrum. The frames were bias subtracted, flatfielded and wavelength calibrated using HgCd/He/Rb lamps and the IRAF software package. No flux calibration was obtained during our DDT observations and, therefore, the resulting spectrum in Fig. 5 is presented in normalized units. The optical spectrum is strongly dominated by H emission with and a broad profile with a FWHM km s-1 (mean between Gaussian and Lorentzian fits without deblending of the [N ii] lines).
3 Discussion
The position agreement between the IGR~J18027$-$1455, 1RXS~J180245.5$-$145432 and NVSS~J180247$-$145451 indicates that these are the multi-wavelength manifestations of the same source radiating at different bands of the electromagnetic spectrum. Moreover, the recently published second IBIS/ISGRI catalog (Bird et al. 2006) lists a position and error circle for IGR~J18027$-$1455 that clearly exclude the other radio source, namely NVSS~J180239$-$145453, as a possible counterpart (even at the 90% confidence level). The NIR source 2MASS~J18024737$-$1454547 has a position in agreement within errors with our new precise radio position of NVSS~J180247$-$145451. Its optical counterpart is USNO-B1.0~0750-0506536. Both the NIR and optical objects are clearly extended (this work and Masetti et al. 2004b, respectively). In addition, the redshifted emission lines seen in the NIR and optical spectra reveal an extragalactic object at a redshift of , with a broad H emission line with FWHM km s-1 (these values are compatible with those of Masetti et al. 2004b, although they reported a slightly narrower emission line with FWHM 2700 km s-1). We are therefore seeing the broad line region (BLR), and the object is classified as a type 1 AGN.
The steep radio spectral index () strongly supports a non-thermal emission mechanism of synchrotron nature. This is clearly compatible with optically thin extended jet emission from an extragalactic source. On the other hand, the NVSS flux density of the source at 1.4 GHz is mJy, to be compared with our measurement of mJy. Both values are only marginally consistent at the 3 level, suggesting that the source is variable at radio wavelengths. We note that 0.61 GHz (49 cm wavelength) observations conducted 3 months later provided a detection at a level of mJy (Pandey et al. 2006), either supporting the variability of the source or indicating that there is a low frequency turnover.
The NIR spectrum is very similar to other well studied Seyfert 1 galaxies such as NGC~863 or Mrk~335 (Rodríguez-Ardila et al. 2002), although the poor signal-to-noise ratio of our NIR observations is not enough to discriminate weak lines as in these cases. It is interesting to note that the permitted O i 11287 line is a feature completely associated with the BLR of Seyfert galaxies. In our case this line is marginally detected, as in NGC~863 (Rodríguez-Ardila et al. 2002). The non-detection of the Br line seems to suggest that thermal UV heating is not important, as it also happens in the case of NGC~1097 (Reunanen et al. 2002).
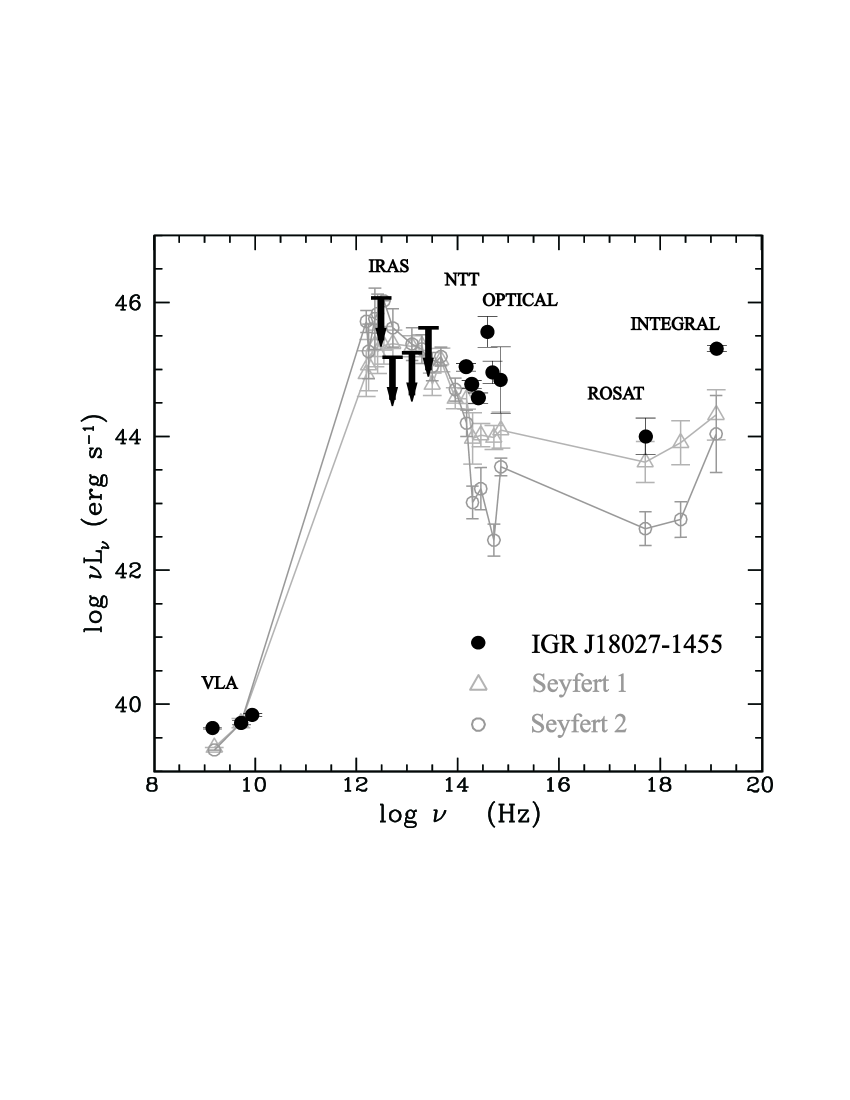
The multiwavelength properties of IGR~J18027$-$1455 strongly support an AGN nature and more specifically a type 1 Seyfert galaxy. In order to compare the broadband emission of the object with that one of the mean for type 1 Seyfert galaxies, we have determined the nuclear spectral energy distribution (SED), from the radio to the gamma-ray band. The observations used to build the SED have been discussed in Sect. 2. The observed magnitudes in the NIR and optical bands were corrected for reddening from Galactic extinction based on the estimated hydrogen column density cm-2 (Dickey & Lockman 1990) and the Predehl & Schmitt (1995) relationship , which gives magnitudes. The transformation between the absorption in the optical and that at other wavelengths was computed according to the Rieke & Lebofsky (1985) interstellar extinction law.
At soft X-ray energies, between 0.1–2.4 keV, the flux was obtained using the ROSAT/PSPC count rate of count s-1 (Voges et al. 2000) and a photon index of , typical of Seyfert 1 galaxies (Malizia et al. 2003). We used the web based tool PIMMS v3.7a333http://heasarc.gsfc.nasa.gov/Tools/w3pimms.html and the value given above to obtain an unabsorbed flux of erg cm2 s-1 (propagating all possible uncertainties). In addition, extrapolation of the ROSAT/PSPC count rate with the same photon index and absorption, considering all possible uncertainties, provides a flux of erg cm-2 s-1 in the 2–10 keV energy range.
The average fluxes detected by INTEGRAL in the 20–40 and 40–100 keV energy ranges are and mCrab, respectively (Bird et al. 2006). These can be converted to the cgs fluxes (assuming a Crab-like spectrum and the values in Bird et al. 2006) erg cm2 s-1 and erg cm2 s-1, respectively, which provide a total flux in the 20–100 keV range of erg cm2 s-1. We note that an analysis with more INTEGRAL data reveals the following values in the 20–100 keV range (Bassani et al. 2006): mCrab and erg cm2 s-1. As can be seen there are hints of variability in the hard X-ray/gamma-ray flux of IGR~J18027$-$1455, and the average of erg cm2 s-1 will be used when plotting the SED.
To compute the monochromatic luminosities we have adopted the cosmological parameters from Spergel et al. (2003): km s-1 Mpc-1, and . Using our measured redshift of we obtain444http://www.astro.ucla.edu/wright/CosmoCalc.html a luminosity distance of Mpc for IGR~J18027$-$1455, leading to a hard X-ray luminosity of erg s-1. The source is one of brightest Seyfert 1 galaxies detected so far: it is brighter than any of the Seyfert 1 galaxies detected with BeppoSAX (Panessa 2004), and the 4th brightest one among the 14 detected with INTEGRAL (Bassani et al. 2006).
We show in Fig. 6 the overall nuclear SED of IGR~J18027$-$1455 in a – representation, but normalized at 6 cm for comparison with the mean SEDs of Seyfert galaxies (Panessa 2004; Panessa et al. 2004). The real luminosities of IGR~J18027$-$1455 are 1.21 dex lower than those shown. Although in the NIR domain we have used nuclear magnitudes, the optical magnitudes ( and from USNO-B1.0 and from Masetti et al. 2004b) could be strongly contaminated by the host galaxy due to a limited angular resolution of 1″ pixel -1. We have not plotted the extrapolated 2–10 keV flux. Although the archival IRAS data does not allow us to detect the far infrared bump, the NIR/ROSAT data clearly show a SED typical of Seyfert 1 galaxies. However, the INTEGRAL data show that the source is clearly high-energy bright. Therefore, IGR~J18027$-$1455 is not only among the brightest type 1 Seyfert galaxies at high energies in absolute terms, but also when normalized to the 6 cm luminosity.
In the basic scheme for unification of AGNs, Seyfert galaxies are divided in two class. Those that have narrow forbidden lines and a BLR in their optical spectrum (Seyfert 1) and those that only have narrow lines (Seyfert 2). While the broad lines originate near the central massive black hole located at pc, narrow lines arise far from the nuclear engine at a distance pc. Specifically they are the same type of object but, according to the standard model, in Seyfert 2 galaxies the BLR is obscured by a molecular torus (Antonucci 1993). For this reason, the majority of these objects are Compton thick, that is, the medium is thick to Compton scattering so that the transmitted component is dramatically suppressed below 10 keV down to the NIR domain.
We can thus further check the Seyfert 1 nature of IGR~J18027$-$1455 and its agreement with unification schemes by comparing its soft X-ray luminosity with isotropic indicators. This allows us to discriminate if starburst or AGN is the dominant component, and at the same time to assess if the source is Compton thin or Compton thick. If the presence of a molecular torus around the central region is important, the X-ray emission coming from the central engine will be negligible and it should be coming from a more extended zone like the NLR or a starburst region. In this case, the column density could be obtained indirectly from the flux ratio between the X-ray flux and isotropic emission measurements like the [O iii]5007 and far-infrared fluxes. Both are good isotropic indicators, while [O iii]5007 emission is produced by photons originated in the central nucleus, infrared emission is mainly associated to star-forming activity, and therefore produced in a larger region than that of the molecular torus.
To compute the [O iii]5007 flux we have used our normalized optical spectrum and the average optical spectrum of Masetti et al. (2004b). The line is clearly detected at =5175 Å. Smoothing our spectrum with a Gaussian function, its equivalent width is Å and the [O iii]5007 flux is 7.1 10-16 erg cm-2 s-1. This flux has been corrected for extinction using the equation given by Bassani et al. (1999). Using a H 8.5 10-16 erg cm-2 s-1 Å-1 and a H 0.5 10-16 erg cm-2 s-1 Å-1, the observed flux ratio H/H 17 and 1.2 10-13 erg cm-2 s-1. Since the , between 2–10 keV, is 0.6–2.9 10-12 erg cm-2 s-1 the ratio is between 5 and 24. According to the flux diagnostic diagrams introduced by Panessa (2004) for type 1 and 2 Seyferts, the source is Compton thin. To calculate the far-infrared flux we have adopted the equation of Mulchaey et al. (1994). As a result the infrared flux is 8 10-11 erg cm-2 s-1. Therefore, the flux ratio 1.5 10-3. According to Panessa (2004), this shows that AGN contribution, not starburst, is the dominant component.
4 Summary
We can summarize our main results as follows:
-
1.
The radio counterpart of IGR~J18027$-$1455 has not been resolved at any frequency by the VLA in its most extended A configuration. The radio flux density is well fitted by a simple power law with a spectral index , typical of optically thin synchrotron radiation originated by a non-thermal jet. VLBI observations are needed to resolve the expected jet-like structure of this high energy object.
-
2.
The NIR spectrum of the IGR~J18027$-$1455 counterpart shows several emission lines with a redshift . The optical spectrum is strongly dominated by redshifted H emission with and a broad profile with FWHM km s-1. This confirms that IGR~J18027$-$1455 is a type 1 AGN.
-
3.
We determined the nuclear SED of IGR~J18027$-$1455 using new radio, optical and infrared observations and available data in the literature. Comparing our obtained SED with the average ones of Seyfert galaxies, we found that it is typical of Seyfert 1 galaxies, although brighter than the mean at high energies, both in absolute terms and when using a normalized 6 cm luminosity.
-
4.
We checked independently the Seyfert 1 nature of IGR~J18027$-$1455 by comparing its X-ray luminosity with isotropic indicators. The source is Compton thin, as expected in unification schemes, and the AGN contribution is the dominant component.
Acknowledgements.
J.A.C. is a researcher of the programme Ramón y Cajal funded jointly by the Spanish Ministerio de Educación y Ciencia (MEC) and Universidad de Jaén. M.R. has been supported by the French Space Agency (CNES) and by a Marie Curie Fellowship of the European Community programme Improving Human Potential under contract number HPMF-CT-2002-02053, and is being supported by a Juan de la Cierva fellowship from MEC. The authors also acknowledge support by DGI of MEC under grants AYA2004-07171-C02-02 and AYA2004-07171-C02-01, FEDER funds and Plan Andaluz de Investigación of Junta de Andalucía as research group FQM322. Partly based on observations collected at the European Southern Observatory, Chile (observing proposal ESO No 073.D-0339), and on observations collected at the Centro Astronómico Hispano Alemán (CAHA) at Calar Alto, Spain, operated jointly by the Max-Planck Institut für Astronomie and the Instituto de Astrofísica de Andalucía (CSIC).References
- Antonucci (1993) Antonucci, R. 1993, ARA&A, 31, 473
- Bassani et al. (1999) Bassani, L., Dadina, M., Maiolino, R., et al. 1999, ApJS, 121, 473
- Bassani et al. (2004) Bassani, L., Malizia, A., Stephen, J. B., et al. 2004, in Proceedings of The 5th INTEGRAL Workshop: The Integral Universe, ESA SP-552, 139, [arXiv:astro-ph/0404442]
- Bassani et al. (2006) Bassani, L., Molina, M., Malizia, A., et al. 2006, ApJ, 636, L65
- Bird et al. (2004) Bird, A. J., Barlow, E. J., Bassani, L., et al. 2004, ApJ, 607, L33
- Bird et al. (2006) Bird, A. J., Barlow, E. J., Bassani, L., et al. 2006, ApJ, 636, 765
- Combi et al. (2004) Combi, J. A., Ribó, M., & Mirabel, I. F. 2004, ATel, 246
- Combi et al. (2005) Combi, J. A., Ribó, M., & Mirabel, I. F. 2005, Ap&SS, 297, 385
- Condon et al. (1998) Condon, J. J., Cotton, W. D., Greisen, E. W., et al. 1998, AJ, 115, 1693
-
Cutri et al. (2003)
Cutri, R. M., Skrutskie, M. F., van Dyk, S., et al. 2003, VizieR Online Data Catalog, II/246
(http://cdsweb.u-strasbg.fr/viz-bin/Cat?II/246) - Dickey & Lockman (1990) Dickey, J. M., & Lockman, F. J. 1990, ARA&A, 28, 215
- Filliatre & Chaty (2004) Filliatre, Ph., & Chaty, S. 2004, ApJ, 616, 469
- Malizia et al. (2003) Malizia, A., Bassani, L., Stephen J. B., et al. 2003, ApJ, 589, L17
- Masetti et al. (2004a) Masetti, N., Palazzi, E., Bassani, L., Malizia, A., & Stephen, J. B. 2004a, ATel, 310
- Masetti et al. (2004b) Masetti, N., Palazzi, E., Bassani, L., Malizia, A., & Stephen, J. B. 2004b, A&A, 426, L41
-
Monet et al. (2003)
Monet, D. G., Levine, S. E., Canzian, B., et al. 2003, AJ, 125, 984
(http://cdsweb.u-strasbg.fr/viz-bin/Cat?I/284) - Mulchaey et al. (1994) Mulchaey, J. S., Koratkar, A., Ward, M. J., et al. 1994, ApJ, 436, 586
- Pandey et al. (2006) Pandey, M., Manchanda, R. K., Rao, A. P., Durouchoux, P., & Ishwara-Chandra 2006, A&A, 446, 471
- Panessa (2004) Panessa, F. 2004, Ph.D. Thesis, University of Bologna
- Panessa et al. (2004) Panessa, F., Bassani, L., Cappi, M., Dadina, M., & Iwasawa, K. 2004, Proceedings of the VI Italian Conference on Active Galactic Nuclei. [arXiv:astro-ph/0410083]
- Persson et al. (1998) Persson, S. E., Murphy, D. C., Krzeminski, W., Roth, M., & Rieke, M. J. 1998, AJ, 116, 2475
- Predehl & Schmitt (1995) Predehl, P., & Schmitt, J. H. M. M. 1995, A&A, 293, 889
- Reunanen et al. (2002) Reunanen, J., Kotilainen, J. K., & Prieto, M. A. 2002, MNRAS, 331, 154
- Ribó et al. (2004) Ribó, M., Combi, J. A., & Mirabel, I. F. 2004, ATel, 235
- Rieke & Lebofsky (1985) Rieke, G. H., & Lebofsky, M. J. 1985, ApJ, 288, 618
- Rodríguez-Ardila et al. (2002) Rodríguez-Ardila, A., Viegas, S. M., Pastoriza, M. G., & Prato, L. 2002, ApJ, 579, 214
- Skrutskie et al. (2006) Skrutskie, M. F., Cutri, R. M., Stiening, R., et al. 2006, AJ, 131, 1163
- Spergel et al. (2003) Spergel, D. N., Verde, L., Peiris, H. V., et al. 2003, ApJS, 148, 175
-
Taylor et al. (2004)
Taylor, G. B., Ulvestad, J. S., Perley, R. A. 2004, The Very Large Array Observational Status Summary,
http://www.vla.nrao.edu/astro/guides/vlas/current/
vlas.ps -
Voges et al. (2000)
Voges, W., Aschenbach, B., Boller, Th., et al. 2000, VizieR Online Data Catalog, IX/29
(http://cdsweb.u-strasbg.fr/viz-bin/Cat?IX/29) - Winkler et al. (2003) Winkler, C., Courvoisier, T. J.-L., Di Cocco, G., et al. 2003, A&A, 411, L1