Spitzer 70m Source Counts in GOODS-North
Abstract
We present ultra-deep Spitzer 70m observations of GOODS-North (Great Observatories Origins Deep Survey). For the first time, the turn-over in the 70m Euclidean-normalized differential source counts is observed. We derive source counts down to a flux density of 1.2 mJy. From the measured source counts and fluctuation analysis, we estimate a power-law approximation of the faint 70m source counts of , consistent with that observed for the faint 24m sources. An extrapolation of the 70m source counts to zero flux density implies a total extragalactic background light (EBL) of . The source counts above 1.2 mJy account for about 60% of the estimated EBL. From fluctuation analysis, we derive a photometric confusion level of mJy () for the Spitzer 70m band.
Subject headings:
cosmology: observations — galaxies: evolution — galaxies: high-redshift — infrared: galaxies1. Introduction
Deep 24m observations (Chary et al. 2004; Papovich et al. 2004; Fadda et al. 2006) have demonstrated the ability of the Multiband Imaging Photometer for Spitzer (MIPS, Rieke et al. 2004) to study the mid-infrared (mid-IR) properties of high-redshift galaxies (Yan et al. 2004; Le Floc’h et al. 2004, 2005; Pérez-González et al. 2005; Daddi et al. 2005; Papovich et al. 2006; Caputi et al. 2006). The interpretation of the 24m data are complicated by the presence of strong emission and absorption features (e.g., Armus et al. 2004) redshifted into the 24m band. Observations at longer wavelengths, such as 70m which is closer to the far-infrared peak of the spectral energy distribution (SED) and is away from the strong mid-IR features, are crucial for constraining the infrared luminosities and star-formation rates.
The previous deep Guaranteed Time Observer (GTO) surveys did not achieve sufficient sensitivity at 70m to detect distant luminous infrared galaxies (LIRGs; ), without stacking 70m data for a large number of 24m-selected sources (Dole et al. 2006). Much deeper observations are needed at 70m to individually detect the LIRGs that account for the majority of the extragalactic background light (Elbaz et al. 2002; Lagache et al. 2004). In this letter, we present initial results for the deepest 70m survey taken to date with Spitzer.
2. Observations
The ultra-deep 70m observations of the northern field of the Great Observatories Origins Deep Survey (GOODS-N) were carried out in Cycle-1 of the General Observer (GO) program (Spitzer program 3325). The survey covers the central of GOODS-N to a depth of 10.6 ks. The data were taken using small-field photometry mode with 10 MIPS-second data collection events (DCEs). The field was observed with an 8 position cluster map for each astronomical observational request (AOR). The observations were repeated with 12 AORs taking 34.5 hours of observatory time in total. The mapping order and dither positions of the cluster positions within the AORs were varied to provide uniform coverage and data quality across the field. The data were embargoed until after the GTO proprietary period and were released to our team in 2005 August. In addition to the GO data, we used the MIPS GTO data of GOODS-N (Spitzer program 81, Dole et al. 2004a). The GTO data were taken in slow scan mode with one degree scan legs and have an integration time of 600 s at 70m, covering an area of 0.6 deg2.
3. Data Reduction
The raw data were downloaded from the Spitzer Science Center (SSC) archive and were processed from scratch using the offline Germanium Reprocessing Tools (GeRT, S13 version 1.0). The instrumental artifacts in the basic calibration data (BCDs) were removed adopting the filtering techniques used for the reduction of the extragalactic First Look Survey (xFLS, Frayer et al. 2006). The BCD pipeline processing and filtering procedures were optimized for these deep photometry data. We adopted the updated S13 calibration, which assumes an absolute flux calibration factor based on stellar SEDs of 702 MJy sr-1 per MIPS-70 data unit. We then multiplied the data by the color correction factor of 1.09 to place the data on a constant scale, which is also the appropriate color correction (within 2%) for a wide range of possible galaxy SEDs (see SSC web pages for calibration and color-correction details). In comparison, the calibration correction adopted here is 3.4% larger than the calibration adopted for the xFLS analysis (Frayer et al. 2006).
The filtering of the data is a crucial aspect in the processing. For the 70m photometry mode, calibration stimulator (stim) flashes are used every 6 DCEs, and latents due to these stim flashes accumulate over time. To remove stim flash latents and additional artifacts, we used a median column filter followed by a median high-pass time filter per pixel (with a filter width of 16 DCEs). The positions of bright sources in the BCDs were flagged so that the filtering corrections were not biased by the presence of sources. The median filtering techniques yield small offsets from zero in the average level of the filtered-BCDs (fBCDs). These offsets correlate with the DCE position within the stim cycle and were removed by subtracting the median level from each fBCD.
The data were coadded onto a sky grid with pixels using the SSC mosaicing and source extraction software (MOPEX, version 112505). Sources were extracted using MOPEX point source response function (PRF) fitting. In crowded regions, the 24m positions (R. Chary et al., in preparation) were used for deblending. For optimal source extraction, an accurate uncertainty image is needed. The uncertainty image was constructed by combining the noise per pixel based on repeated observations with the local spatial pixel-to-pixel dispersion after the extraction of bright sources. The average level of the uncertainty image was then scaled to match the average empirical point-source noise derived by making multiple aperture measurements at random locations throughout the residual mosaic after source extraction. The scale factor between the aperture derived point source noise (including the aperture correction) and the pixel surface brightness noise is (point source)/ pixels) [mJy/(MJy sr-1)]. The average point source noise for the ultra-deep area (after the extraction of sources) is 0.53 mJy (). The applicability of the uncertainty image for point source extraction was verified by obtaining PRF fits with for sources throughout the image.
4. Results
4.1. Estimate of Confusion
Previous surveys with Spitzer are not deep enough to measure the photometric confusion noise at 70m, and the estimated confusion level is based on the observed bright source counts and models of galaxy evolution (Dole et al. 2004b). With the ultra-deep data of GOODS-N, we can directly measure the confusion level at 70m. We define the instrument noise (including photon noise, detector noise, and noise associated with the data processing) as . The total noise () represents the noise after the extraction of sources above a limiting flux density (), and the confusion noise () represents fluctuations due to sources with flux densities below . As defined here, is the “photometric” confusion noise, following the terminology of Dole, Lagache, & Puget (2003). In the direction of GOODS-N, the contribution of Galactic cirrus to the confusion noise is negligible (–0.02 mJy), based on the relationship given by Dole et al. (2003) and the calculations of Jeong et al. (2005).
The instrument noise was estimated empirically by subtracting pairs of data with the same integration time and covering the exact same region on the sky to remove sources and any remaining residuals from the sky after filtering. The measured instrument noise integrates down nearly with (Fig. 1). For these data, we find , where for integration time in units of ks. The functional form of this relationship is based on empirical results from several different data sets, and the parameter depends on the background level and the quality of the data reduction. We use the above function to extrapolate the instrument noise from half the data to the full data set and derive MJy sr-1.
Since the total noise image (after source extraction) and instrumental noise image have nearly Gaussian distributions, the confusion noise can also be approximated by a Gaussian and is given by . We iterate between source extraction at different limiting flux densities and confusion noise measurements until we converge to a solution with . For the solution, we derive MJy sr-1 and MJy sr-1, for a limiting source flux density of S70 mJy.111S70Sν(71.4m) and S24Sν(23.7m) throughout this paper. Including the additional systematic uncertainties of the absolute calibration scale (10%) and the conversion between point source noise and surface brightness noise (10%, §3), we derive a point source confusion noise of mJy ().
In comparison, the predictions of Dole et al. (2003, 2004b) suggest a photometric confusion level of mJy, depending on the exact shape of the differential source counts. The measured confusion level of 0.3 mJy agrees well with the predicted photometric confusion level. However, the source density criterion (SDC) confusion limit of 3.2 mJy adopted by Dole et al. is more than a factor of two higher than the limiting flux density derived here. The Dole et al. SDC limit corresponds to and a high completeness level of %. Sources can be extracted at lower completeness levels, and counts can be derived reliably well below this SDC limit by making use of the 24m data to help extract the faintest sources.
4.2. Source Counts
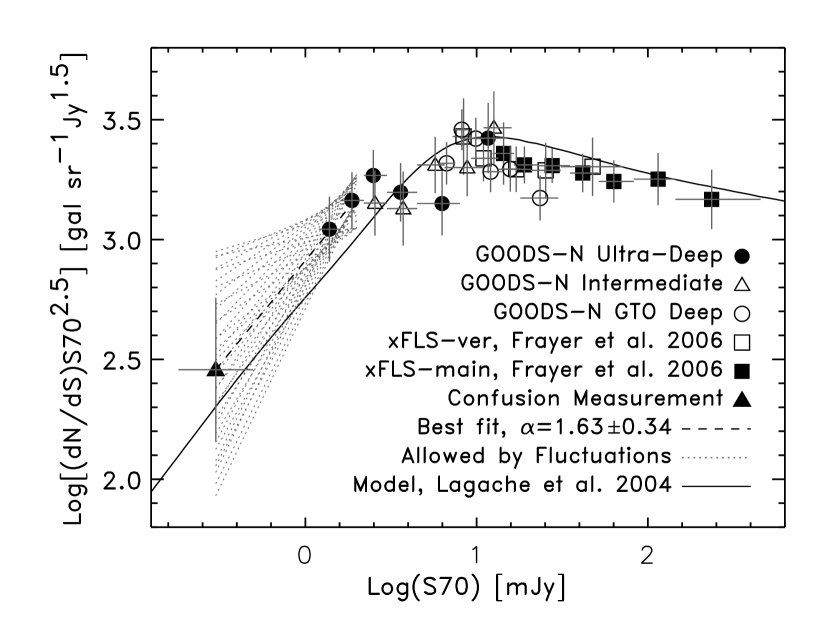
The source counts were derived separately for the central ultra-deep field, for the wide 0.614 deg2 GTO deep field, and for the intermediate field which includes the ultra-deep field and the surrounding regions of intermediate depth between the GTO and ultra-deep surveys (Table 1). Analysis was done on the “intermediate” field for better statistics at S70 mJy. The central ultra-deep area has a deficiency (–50%) in number of sources with flux densities between 5–10 mJy in comparison to typical areas surrounding GOODS-N, presumably due to cosmic variance. The intermediate and GTO fields allow the measurement of source counts for flux densities (4–12 mJy) not well sampled by the ultra-deep GOODS-N and the shallow xFLS surveys. The combination of the GOODS-N and the xFLS data sets yields source counts over the flux density range from 1.2 mJy to 455 mJy (Fig. 2). In comparison, the counts presented here are 12.5 times deeper than the counts previously published by the MIPS Team (Dole et al. 2004a) and about 7 times deeper than the counts based on the xFLS verification field (Frayer et al. 2006).
Sources were extracted for signal-to-noise (S/N) ratios of S/N2.5 for the ultra-deep field and S/N for the intermediate and GTO-deep fields. The uncertainty image (§3) was used to represent the point-source noise as a function of position. The number of spurious sources for each flux bin was estimated by performing source extraction on the negative image. Reliability degrades significantly below S/N. To compensate for spurious sources at low S/N, we required the presence of 24m counterparts in the ultra-deep field. Since the GOODS 24m data (M. Dickinson et al., in preparation) are about 100 times more sensitive in flux density, very few, if any, 70m-only detections are expected. Within the ultra-deep field, the chance coincidence within 8 ( times the positional rms uncertainty of the faintest 70m sources) of a 24m counterpart with S24Jy is 20%. By requiring 24m counterparts, we removed 80% of the spurious sources, and the observed counts were then corrected assuming a 20% chance match for the remaining spurious sources.
After correcting for reliability, the observed source counts are corrected for completeness and flux biasing (i.e., the scattering of faint sources into brighter flux density bins) using the Monte Carlo approach described by Chary et al. (2004). Simulated point sources spanning the full range of flux densities were injected at random positions into each image (one at a time with 3 repetitions per field). By using the simulations and the same source extraction methods, we populate a matrix representing the probability that a galaxy with input flux density is detected and measured with output flux density . By summing over the elements of the matrix, the true counts are derived from the observed counts. This Monte Carlo approach allows the derivation of the counts at low completeness levels; the completeness level for the faintest flux bin (1.2–1.6 mJy) is only 30% (Table 1). The uncertainties on the counts include the uncertainties of the reliability corrections, the Poissonian errors propagated through the matrix, and the 10% absolute flux calibration uncertainty combined in quadrature.
The Euclidean-normalized differential source counts turn over around 8–10 mJy (Fig. 2). The observed counts are consistent within 30% of the Lagache et al. (2004) model for bright flux densities. We find a slightly larger number of faint galaxies (S703 mJy) than predicted by Lagache et al. (2004), which may be due to cosmic variance in the direction of GOODS-N. Ultra-deep 70m observations over larger areas and along different lines of sight are needed to constrain the models more accurately at faint flux densities.
At low flux densities, a weighted least-squares fit to the differential source counts yields with . This is consistent with the power law of derived for the faint 24m sources (Chary et al. 2004). The observed fluctuations also constrain the faint source counts. We estimate the extrapolated source counts down to the confusion limit via simulations. Different populations of sources covering a wide range of values and normalizations at 2 mJy were randomly injected into the instrumental noise image and then extracted using the same techniques carried out for the confusion measurement. The best-fit solution for simulations consistent with the observed constraints is . At the confusion level of 0.3 mJy, we derive an extrapolated value for the Euclidean-normalized differential source counts of gal sr-1 Jy1.5.
4.3. Extragalactic Background Light
The expected extragalactic background light (EBL) due to infrared galaxies at 70m is fairly uncertain due to the difficulty of deriving accurate zodiacal light corrections for the Diffuse Infrared Background Experiment (DIRBE) measurements (e.g., Wright 2004). By interpolating between the 24m EBL value (Papovich et al. 2004), the 60m value (Miville-Dechênes, Lagache, & Puget 2002), and the DIRBE 100m and 140m measurements (Wright 2004), we estimate a predicted EBL level of at 71.4m. In comparison, Dole et al. (2006) estimates a total EBL of from 70m stacking analysis and the extrapolation of the 24m counts, and the Lagache et al. (2004) model predicts a value of .
By summing over the observed source counts for S70 mJy (including a small contribution from sources brighter than 455 mJy based on the Lagache et al. 2004 model), we derive a contribution of to the EBL. This is about 60% of the total EBL. By extrapolating () the 70m source counts down to the confusion level, we derive a contribution of for S70 mJy, and the extrapolation to zero flux density yields an estimated total EBL of . The uncertainties on the EBL measurements include an additional 10% systematic uncertainty to the error budget, accounting for the uncertainties associated with the absolute calibration and color corrections.
5. Concluding Remarks
Based on ultra-deep 70m observations, we derive source counts down to a flux density of 1.2 mJy, directly resolving about 60% of the EBL. The total fraction of the EBL estimated for sources down to the confusion level ( mJy, ) is about 75%. A power-law extrapolation to zero flux density implies a total EBL of at 71.4m. This is consistent with the value predicted based on EBL measurements at other wavelengths, the value predicted from the Lagache et al. (2004) model, and the value derived from the extrapolation of the 24m counts and 70m stacking analysis (Dole et al. 2006). However, the uncertainties on the results leave open the possibility of a significant population of sources at low 70m flux densities that are not accounted for in the models, such as highly obscured AGNs as proposed to account for the hard X-ray background (e.g., Worsley et al. 2005). Studies of the counterparts of the faint 70m population are ongoing and will help to constrain the infrared luminosities and the relative fraction of AGN versus starburst-dominated galaxies in the high-redshift Spitzer-selected surveys.
We thank our colleagues associated with the Spitzer mission who have made these observations possible. This work is based on observations made with the Spitzer Space Telescope, which is operated by the Jet Propulsion Laboratory, California Institute of Technology under NASA contract 1407.
References
- (1)
- (2) Armus, L., et al. 2004, ApJS, 154, 178
- (3)
- (4) Caputi, K. I., et al. 2006, ApJ, 637, 727
- (5)
- (6) Chary, R., et al. 2004, ApJS, 154, 80
- (7)
- (8) Daddi, E., et al. 2005, ApJ, 631, L13
- (9)
- (10) Dole, H., Lagache, G., & Puget, J.-L. 2003, ApJ, 585, 617
- (11)
- (12) Dole, H., et al. 2004a, ApJS, 154, 87
- (13)
- (14) Dole, H., et al. 2004b, ApJS, 154, 93
- (15)
- (16) Dole, H., et al. 2006, A&A, 451, 417
- (17)
- (18) Elbaz, D., Cesarsky, C. J., Chanial, P., Aussel, H., Franceschini, A., Fadda, D., & Chary, R. R. 2002, A&A, 384, 848
- (19)
- (20) Fadda, D., et al. 2006, AJ, 131, 2859
- (21)
- (22) Frayer, D. T., et al. 2006, AJ, 131, 250
- (23)
- (24) Jeong, W.-S., Lee, H. M., Pak, S., Nakagawa, T., Kwon, S. M., Pearson, C. P., & White, G. J. 2005, MNRAS, 357, 535
- (25)
- (26) Lagache, G., et al. 2004, ApJS, 154, 112
- (27)
- (28) Le Floc’h, E., et al. 2004, ApJS, 154, 170
- (29)
- (30) Le Floc’h, E., et al. 2005, ApJ, 632,
- (31)
- (32) Miville-Deschênes, M.-A., Lagache, G., & Puget, J.-L. 2002, A&A, 393, 749
- (33)
- (34) Papovich, C., et al. 2004, ApJS, 154, 70
- (35)
- (36) Papovich, C., et al. 2006, ApJ, 640, 92
- (37)
- (38) Pérez-González, P. G., et al. 2005, ApJ, 630, 82
- (39)
- (40) Rieke, G. H., et al. 2004, ApJS, 154, 25
- (41)
- (42) Worsley, M. A., et al. 2005, MNRAS, 357, 1281
- (43)
- (44) Wright, E. L. 2004, NewAR, 48, 465
- (45)
- (46) Yan, L., et al. 2004, ApJS, 154, 60
- (47)

| S(low) | S(high) | S(avg) | Observed | Reliability | Completeness | Corrected | Log[] |
|---|---|---|---|---|---|---|---|
| [mJy] | [mJy] | [mJy] | Number | Number | [gal sr-1 Jy1.5] | ||
| 1.2 | 1.6 | 1.38 | 21 | 0.75 | 0.30 | 52.414.3 | 3.0430.136 |
| 1.6 | 2.2 | 1.87 | 28 | 0.85 | 0.49 | 48.711.0 | 3.1630.118 |
| 2.2 | 3.0 | 2.49 | 31 | 0.97 | 0.75 | 40.2 7.8 | 3.2670.107 |
| 3.0 | 4.5 | 3.60 | 21 | 0.97 | 0.80 | 25.6 6.1 | 3.1970.122 |
| 4.5 | 8.0 | 6.29 | 14 | 1.0 | 1.05 | 13.3 3.6 | 3.1500.133 |
| 8.0 | 15.0 | 11.68 | 11 | 1.0 | 1.04 | 10.6 3.2 | 3.4230.147 |
| 2.2 | 3.0 | 2.55 | 28 | 0.75 | 0.43 | 48.713.4 | 3.1520.136 |
| 3.0 | 4.5 | 3.73 | 26 | 0.69 | 0.54 | 33.510.8 | 3.1290.154 |
| 4.5 | 6.5 | 5.73 | 20 | 1.0 | 0.86 | 23.2 5.2 | 3.3110.117 |
| 6.5 | 11.0 | 8.81 | 19 | 1.0 | 1.10 | 17.3 4.0 | 3.3000.119 |
| 11.0 | 16.0 | 12.62 | 10 | 1.0 | 0.87 | 11.5 3.7 | 3.4660.153 |
| 6.0 | 7.5 | 6.68 | 101 | 0.86 | 0.54 | 160.121.9 | 3.3180.088 |
| 7.5 | 9.0 | 8.19 | 96 | 0.95 | 0.69 | 132.516.8 | 3.4580.085 |
| 9.0 | 11.0 | 9.89 | 73 | 0.99 | 0.71 | 101.413.2 | 3.4210.086 |
| 11.0 | 14.0 | 12.07 | 62 | 1.0 | 0.92 | 67.3 8.7 | 3.2830.086 |
| 14.0 | 18.0 | 15.72 | 45 | 1.0 | 0.95 | 47.5 7.4 | 3.2940.094 |
| 18.0 | 30.0 | 23.48 | 43 | 1.0 | 1.09 | 39.6 6.1 | 3.1730.094 |
Note. — The first 6 rows are for the ultra-deep field (0.0277 deg2), the next 5 rows are for the intermediate field (0.0462 deg2), and the remaining rows are for GTO-deep field (0.614 deg2). The corrected counts are equal to the observed counts multiplied by the reliability value and divided by the completeness correction. The uncertainties for the Euclidean-normalized differential counts [] include the Poissonian noise, the uncertainties associated with the reliability, completeness, and flux biasing corrections, and the absolute calibration uncertainty of 10%.