The jet/disk connection in AGN: Chandra and XMM-Newton observations of three powerful radio-loud quasars
Abstract
The connection between the accretion process that powers AGN and the formation of jets is still poorly understood. Here we tackle this issue using new, deep Chandra and XMM-Newton observations of the cores of three powerful radio loud quasars: 1136–135, 1150+497 (Chandra), and 0723+679 (XMM-Newton), in the redshift range =0.3–0.8. These sources are known from our previous Chandra snapshot survey to have kpc-scale X-ray jets. In 1136–135 and 1150+497, evidence is found for the presence of diffuse thermal X-ray emission around the cores, on scales of 40–50 kpc and with luminosity L erg s-1, suggesting thermal emission from the host galaxy or a galaxy group. The X-ray continua of the cores in the three sources are described by an upward-curved (concave) broken power law, with photon indices and below and above keV, respectively. There is evidence for an unresolved Fe K line with EW 70 eV in the three quasars. The Spectral Energy Distributions of the sources can be well described by a mix of jet and disk emission, with the jet dominating the radio and hard X-rays (via synchrotron and external Compton) and the disk dominating the optical/UV through soft X-rays. The ratio of the jet-to-disk powers is , consistent with those derived for a number of gamma-ray emitting blazars. This indicates that near equality of accretion and jet power may be common in powerful radio-loud AGN.
1 Introduction
In recent years, Chandra observations of jets hosted by powerful quasars with FRII radio morphology revealed that these structures transport large ( erg s-1) amounts of energy as bulk kinetic energy from the cores to the distant radio lobes. Only a small fraction (%) of this energy is expended as radiation at large distances (Sambruna et al. 2004), while a larger fraction can be released close to the nucleus on sub-pc scales.
In the standard view of Active Galactic Nuclei, the ultimate origin of their power is accretion onto a central supermassive black hole (Urry & Padovani 1995). The large energy carried by jets must thus originate in the source inner regions, near the black hole. Indeed, the formation of the jet should be intimately connected to the accretion process, through the spin of the black hole (Blandford & Znajek 1977) and/or centrifugal forces due to the magnetic field threaded by the disk (Blandford & Payne 1982).
A clear connection between the jet and the accretion disk was inferred by observations of Galactic microquasars and binaries, where the ejection of a radio component from the center is usually associated to a minimum of the high-energy flux, and presumably to the disappearance of plasma in the inner disk orbits (e.g., Fender & Belloni 2004; but see Corbel et al. 2004 for a case of a jet in a high/soft state). In AGN, a correlation between superluminal radio ejecta and X-ray variability from the nucleus was directly observed in 3C 120 (Marscher et al. 2002). However, in most cases the notion of a jet/accretion link so far relied on indirect evidence. A proportionality between the kinetic power carried by the jet derived from the lobe properties and the accretion luminosity, estimated from the O[III] optical lines, was first inferred by Rawlings & Saunders (1991) and later confirmed by Xu, Livio, & Baum (1999). A similar correlation using the broad emission lines as a measure of the accretion power and VLBI data for the jet was derived by Celotti, Padovani, & Ghisellini (1997). From the modeling of the radio-to-gamma-ray Spectral Energy Distributions of a number of blazars111Blazars are defined as radio-loud AGN whose emission is dominated by non-thermal radiation from a relativistic jet oriented close to the line of sight. Blazars include BL Lacertae objects, Flat Spectrum Radio Quasars, and Optically Violently Variable quasars. with broad emission lines and adequate data at high energies ( keV), Maraschi & Tavecchio (2003) found that the jet and accretion powers in powerful blazars are of the same order, suggesting an important role of the black hole rotation to supply the necessary jet power.
In order to estimate the jet and disk powers separately it is necessary to use objects in which there is direct evidence for the presence of an accretion disk as well as of a bright jet. Such objects are not plentiful as the jet emission is bright only for orientations close to the line of sight, and in this case it dilutes disk-related features. Moreover, high energy data are important to constrain models. In general Flat Spectrum Radio Quasars (FSRQs) meet these requirements because their non-thermal jet continuum peaks at IR/optical wavelengths (Sambruna et al. 1996; Fossati et al. 1998) and thus may yield negligible contribution to the optical/UV region where the disk/line emission is expected. So far, such thermal contribution has been detected in a handful of cases, 3C 273 (von Montigny et al. 1997), 3C 345 (Bregman et al. 1986), and SWIFT J0746.3+2548, a =2.979 blazar recently discovered with Swift at energies 15 keV (Sambruna et al. 2006a).
In this paper, we discuss the jet/accretion connection using Chandra and XMM-Newton observations of the cores of three quasars with powerful radio emission and FRII morphology: 0723+679 (=0.846), 1136–135 (=0.554), and 1150+479 (=0.334). The three sources were found to exhibit one-sided X-ray jets on kpc scales from our Chandra exploratory survey (Sambruna et al. 2002, 2004). Interestingly, an Fe K emission line at 6–7 keV (rest-frame) was detected in the short ACIS-S spectra of the cores of 1150+497 and 0723+679 (Gambill et al. 2003). The Fe line detection indicates that even in the X-ray band the beamed jet emission does not completely swamp the accretion-related emission (Grandi & Palumbo 2004), qualifying the three sources as excellent candidates to investigate the jet/disk connection. Moreover, for these objects the jet multifrequency emission can be measured both close to the core and at large distances (kpc scales), probing the power transported along the jet.
We later acquired longer Chandra observations of 1136–135 and 1150+497 to study their jets, and an XMM-Newton exposure of 0723+679 to confirm the Fe-K line. The jet properties from the ACIS deep images of 1136–135 and 1150+497 were discussed in Sambruna et al. (2006b; S06 in the following) and Tavecchio et al. (2006). Here we report about the core X-ray properties of the three sources. Their basic properties and radio classifications are listed in Table 1.
The structure of the paper is as follows. In § 2 we summarize the previous Chandra observations of the cores. The description of the new X-ray observations, data reduction, and analysis protocol is given in § 3. Results from a spatial, timing, and spectral analysis are presented in § 4, while Discussion and Conclusions follow in § 5. Throughout this work, a concordance cosmology with H km s-1 Mpc-1, =0.73, and =0.27 (Spergel et al. 2003) is adopted. With this choice, 1′′ corresponds to 7.7 kpc for 0723+679, 6.4 kpc for 1136–135, and 4.8 kpc for 1150+497. The energy index is defined such that .
2 Observations and Data Reduction
2.1 Deep Chandra observations of 1136–135 and 1150+497
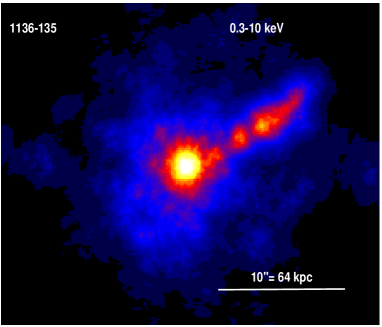
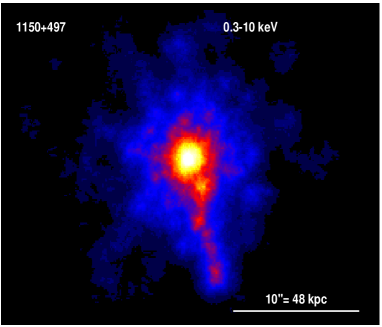
Follow-up Chandra observations were carried out on April 16, 2003 for 1136–135 and on July 18, 2003 for 1150+497, with total exposures 81 ks and 70 ks, respectively. Screening was performed using standard criteria (S06). After screening, the effective exposure times are 70.2 ks for 1136–135 and 61.7 ks for 1150+497. The net count rates of the cores in the energy range 0.3–10 keV from an extraction circle with radius 1.5′′ are 0.270.02 c/s for 1136–135 and 0.550.03 c/s for 1150+497. Figure 1 shows the 0.3–10 keV images of both sources (S06).
Since we expected bright X-ray cores, we used subarray mode to reduce the effect of pileup of the nucleus, with an effective frame time of 0.44 s, or the minimum allowed. With this precaution, the core of 1136–135 had 0.61 counts/frame, corresponding to negligible pileup (4%); however, the core of 1150+497 still had 1.25 counts/frame, or 11% pileup.
We inspected the ACIS-S background for flares and found none.
Background spectra and light curves were extracted from source-free
regions on the same chip of the source. Two sets of spectra were
extracted. The first set was derived from a circle centered on the
source X-ray centroid with radius 1.5′′. As these spectra are
affected by pileup, during the fit the spectral component
pileup model in XSPEC was included. The second
set of spectra were extracted from an annulus, centered on the source
X-ray position and with inner and outer radii 1′′ and 3′′,
respectively. The annuli spectra are mainly contributed to by the
PSF’s wings, which are not affected by pileup at the counts/frame of
our sources; however, they have a low signal-to-noise ratio.
To assess the reliability of the pileup correction for the
circle spectra, we compared the spectral fits to the latter with the
spectral fits to the annuli spectra, using the same continuum models
(see below). We found consistency of fitted parameters within the
uncertainties. Thus, in the following we will discuss the circle
spectra, which have a higher signal-to-noise ratio. The spectral
response files were constructed using the corresponding thread in
CIAO 3.1.
2.2 XMM-Newton observations of 0723+679
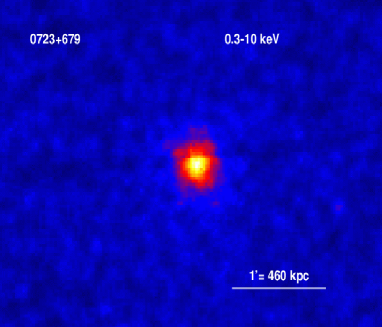
We observed 0723+679 with XMM-Newton on April 11, 2005 for a total exposure of 46.9 ks with the EPIC pn, and 46 ks with the MOS. The count rate of the source in 0.3–10 keV is 0.378 0.005 c/s with the pn and 0.101 0.002 c/s with the MOS. As not enough counts were collected with the RGS ( 300) for a detailed analysis, here we concentrate on the EPIC and OM data only. The MOS1 image in 0.3–10 keV is shown in Figure 1.
All the EPIC cameras were operated in full-frame mode with a thin
filter. The recorded events were screened to remove known hot pixels
and other data flagged as bad; only data with FLAG=0 were used.
The data were processed using the latest CCD gain values, and only
events corresponding to pattern 0–12 (singles, doubles, triples, and
quadruples) in the MOS cameras and 0–4 (singles and doubles only,
since the pn pixels are larger) in the pn camera were accepted. The
RGS data do not have sufficient signal-to-noise ratio to perform a
meaningful analysis.
Unfortunately, our observations were plagued by several episodes of intense background flares. For the flare rejection, we considered cuts on the count rate of the total hard X-ray (E keV) background light curve ranging between 1 and 8 c/s for the EPIC pn, and between 0.35 and 5 c/s for the MOS cameras. The choice of the count rate threshold represents a tradeoff between the necessity to minimize the contribution of the flaring background and the need to retain sufficient photon statistics for an accurate spectral analysis. We found that for the EPIC pn a cut at 5 c/s is a conservative but still suitable background threshold, whereas 2 c/s is a reasonably good choice for the MOS cameras. Excluding these events reduces the effective total exposures times to 19.9 ks for the EPIC pn and 35.2 ks for the MOS cameras. There is no pile-up in the pn or MOS cameras according to the SAS task epatplot.
The EPIC pn and MOS spectra were extracted from a circular region
centered on the source’s position and with radius 32′′. The
background was extracted from a circle with radius 60′′,
positioned in a region of the CCD free from serendipitous X-ray
sources. Response files were created with SAS v.6.1. There is
no pile-up in the pn or MOS cameras according to the SAS task epatplot.
The data from the Optical Monitor (Mason et al. 2001) were processed with the latest (December 3, 2005) calibration files. The observed magnitudes, extracted from the output files of the pipeline and corrected for systematics, are: ( Å), ( Å), ( Å), and ( Å). These values were corrected for the Galactic absorption column () and converted into fluxes by using standard formulae (e.g., Zombeck 1990).
3 Results
3.1 Chandra spatial analysis
Inspection of the 0.3–10 keV images of 1136–135 and 1150+497 in
Figure 1 reveals the presence of faint diffuse emission around the
cores of both targets. To quantify this result we performed a detailed
spatial analysis. The following procedure was adopted. First, radial
surface-brightness profiles were extracted from a series of concentric
annuli centered on the radio core position. Off-nucleus X-ray point
sources, as well as the X-ray jet, were excluded. Second, the radial
profiles were fitted with a model including the instrument Point
Spread Function (PSF). The latter was created using the Chandra Ray
Tracer (ChaRT) simulator which takes into account the spectral
distribution of the source. We used the best-fit X-ray continua from
the spectral analysis (Table 2). The significance of adding the PSF
model was determined using an F-test, assuming as threshold for
significant detection a probability P99%.
The observed radial profiles of the two sources in the total energy band 0.3–10 keV are shown in Figure 2. Comparing the instrumental PSF (dashed line) with the data, excess X-ray flux over the PSF’s wings is apparent above 5–6′′, indicating the presence of diffuse emission around the cores. To model this component, we used a model, described by the following formula (e.g., Cavaliere & Fusco-Femiano 1976):
where is the core radius. The radial profiles were then fitted with a model including the PSF, the background (held fixed at the measured value, c/s/arcsec2), and the -model. The latter is required at P 99% confidence in the fits for both sources. The fitted parameters are: , , ′′, or 47 kpc for 1136–135; , , ′′, or 36 kpc for 1150+497. The core radius is on the low-end of the range observed for intermediate- quasars (Crawford & Fabian 2003), and suggests emission on the scale of the host galaxy or a group of galaxies. The best-fit models are plotted in Figure 2 (dot-dashed lines). The bottom panels show the residuals of the fits to the radial profiles.
To analyze the 0.5–8 keV spectrum of the diffuse emission we extracted the count rate from the diffuse emission in 1136–135 from an annular region of inner and outer radii 5′′ and 15′′, with the jet excised. The inner radius of the extraction region is the minimum distance from the core at which the extended emission starts exceeding the PSF radial profile, whereas the outer radius represents the distance at which the background component dominates the total emission. The total count rates of the diffuse emission in this annulus are c/s in the case of 1136–135 and for 1150+497.
The spectra of the diffuse emission in both sources were fitted with a
model including a thermal (apec) component and a power law, the
latter accounting for the contribution of the wings of bright core
PSF111While the best-fit to the core X-ray spectra is more
complex than a single power law, we find that due to the low
signal-to-noise ratio of the diffuse emission spectra the best results
are obtained by using a power law., with Galactic absorption acting
on both components. The photon index of the power-law component was
fixed at the best-fit value obtained in the fit of the core spectrum
(=1.80 and 1.91, for 1136–135 and 1150+497); the temperature
was constrained to vary in the range 0.1 and 1.5 keV, typical of the
host galaxy halo. Since the metal abundance relative to solar is
poorly determined when left free to vary, we adopted the following
procedure: We fixed to 0.2, 0.4, 0.6, 0.8, 1 and compared the
respective fits. For 1136–135, is relatively well determined for
; for 1150+497, no significant differences in the spectral
fits are found when spans the entire 0.2-1 range. For ,
the measured temperature and 90% uncertainties is
keV for 1136–135 and
keV for 1150+497.
The observed fluxes of the thermal component in 0.3–2 keV are F erg cm-2 s-1 for 1136–135, and F erg cm-2 s-1 for 1150+497. These are consistent with the upper limits derived from our previous short exposures (Gambill et al. 2003). The corresponding intrinsic luminosities are L erg s-1 and L erg s-1, respectively.
We are interested in deriving the density of the hot gas around the cores of 1136–135 and 1150+497, an important parameter in our model of jet deceleration through gas entrainment (Tavecchio et al. 2005). The gas density can be obtained by de-projecting the surface-brightness profiles (see, e.g., Ettori 2000):
| (1) |
This relation assumes isothermal, hydrostatic equilibrium in spherical symmetry. We adopted the cooling function value (Sarazin 1988) for the hot gas temperature and an abundance =0.6. The resulting central particle densities for 1136–135 and 1150+197 are and for 1136–135 and 1150+497, respectively.
We evaluated the relative contribution of the thermal diffuse component and the point source in the region of extraction of the core spectra, a circle of radius 1.5′′. The ratios between the integrated and PSF model emission are 2.3 for 1136–135 and 1.9 for 1150+497. These estimates are, however, affected by large uncertainties (), due to the large errors on the spatial parameters. Taken at face value, these ratios imply that the diffuse emission gives a negligible contribution ( 0.1%) to the total emission within 1.5′′.
In summary, we find that the cores and jets of 1136–135 and 1150+497 are embedded in soft ( keV) thermal X-ray emission on a scale of tens of kpc and with luminosities erg s-1. The physical scale of the thermal diffuse emission is several tenths of kpc, likely related to the halo of the host galaxy or a small group of galaxies. The presence of the ISM and its properties impact discussions of mechanisms for jet deceleration on kpc scales (Tavecchio et al. 2006 and references therein).
3.2 Timing analysis
We searched for X-ray flux variability in the background-subtracted light curves of the cores. No timing analysis was performed for the core of 0723+679, because of the numerous large-amplitude flares affecting the background light curve.
The light curves of 1136–135 and 1150+497 are shown in Figure 3. According to the test, no significant variability of the 0.3–10 keV flux is detected in 1136–135, with a constancy probability P. On the contrary, in 1150+497 there is an indication that the X-ray flux is variable, with P. From Figure 3, the X-ray flux increases monotonically toward the end of the observation by a factor 1.2 in a few hours.
To investigate the energy-dependence of variability of 1150+497, light curves were extracted in the spectral bands 0.3–1.5 keV and 1.5–10 keV. The choice of these energy ranges is motivated by the results of the continuum spectral analysis, which shows a break around 1.5 keV of the best-fit broken power law model (Table 2a). With this division, roughly equal counts are contained in the two energy ranges, 0.20 c/s at soft and 0.35 c/s at hard energies. We find evidence of variability at both soft and hard X-rays, with P and 8.9%, respectively. The fractional variability amplitude (Gliozzi et al. 2003) in the two energy ranges is . Thus, there is no significant dependence of the amplitude of variability on energy.
The hardness ratios, defined as the ratio of the 1.5–10 keV counts to the 0.3–1.5 keV counts, are also plotted in Figure 3. Neither 1150+497 nor 1136–135 show any indication of spectral variability, with P for both sources.
3.3 Spectral analysis
The ACIS and EPIC spectra, extracted as described in § 3, were
grouped so that each new bin had at least 20 counts to enable
the use of the statistics. Spectral fits were performed
within XSPEC v.11.2.0 on the energy ranges 0.5–8 keV for ACIS,
0.3–10 keV for EPIC pn, and 0.4–10 keV for EPIC MOS, where the
calibrations for spectral analysis are best known and the background
negligible.
In all fits, an absorption column density fixed to the Galactic value
was included. In the case of 1136–135 and 1150+497, where modest
amounts of pileup is present, the models used to fit the ACIS spectra
included a component correcting for pileup (model pileup in
XSPEC). In this model, the timeframe was fixed at 0.441 s and
the psffrac parameter at 0.95.
The spectral results are summarized in Table 2 (X-ray continua) and Table 3 (the Fe-K line). All uncertainties are 90% confidence for one parameter of interest (=2.7). Below we comment separately on the spectral fit results for the continuum and the Fe line.
3.3.1 The Continuum
The X-ray spectra of the cores were fitted at first with a single
power law model and Galactic column density (Table 1). This provides a
formally acceptable fit to the EPIC spectrum of 0723+679 and to the
ACIS-S spectrum of 1136–135, but not to 1150+497. Inspection of the
residuals shows the presence of excess flux below 1 keV, indicating
the presence of a soft X-ray spectral component in all three
sources. We know that, at least in the case of 1136–135 and 1150+497,
the diffuse emission does not contribute significantly in the
extraction region of the core spectrum (§ 3.1); for 0723+679 the
addition of a thermal component (apec) to the power law
improves the fit significantly, however, the fitted temperature is
0.08 keV (for a fixed abundance of 0.2 solar), effectively mimicking a
steep power law at low energies. We thus conclude that the soft X-ray
excess flux below 1 keV is intrinsic to the point source in all three
cases.
Among the phenomenological models, a broken power law describes the X-ray spectra best. In all three sources, the fitted low-energy slope is steeper than the higher-energy slope, thus yielding a concave (upward curved) continuum. The parameters of the broken power law best-fit models are listed in Table 3, while Figure 4 shows the EPIC and ACIS-S residuals of the broken power law model fits.
We can not distinguish between a non-thermal and a thermal origin for the soft excess in the ACIS and EPIC data. We fitted the data with a power law at hard energies plus a blackbody to model the soft X-rays, in the assumption that the soft X-ray emission originates from the accretion disk. While the addition of the blackbody improves the fit significantly (P 99%), the derived temperatures are 1 keV, too large to be related to emission from a Shakura-Sunyaev accretion disk; the latter is expected to peak in the EUV portion of the spectrum, implying 0.1 keV. Clearly, such a model would produce a steep power law-like continuum in the soft part of the ACIS-S and EPIC energy range.
Prompted by the detection of an Fe K line in 1136–135 and 1150+497,
we tried more complex fits to the ACIS-S continua of these sources
using models including reflection from a neutral absorber
(pexrav). Reflection from a neutral medium provides a formally
good fit to the data of both 1136–135 and 1150+497, with reduced
=1.03 and 1.15, respectively. However, the fitted reflection
fraction, , is much larger than the value expected from
the line Equivalent Widths (EW) according to the relation
EW=160, or =1.25 (George & Fabian
1991). Fixing the reflection fraction to the latter value gives an
acceptable fit, but not statistically better than a broken power law.
We conclude that reflection from a cold medium, while consistent with
the data, is not required.
3.3.2 The Fe K emission line
As apparent from Figure 4, line-like residuals are present around 4–5 keV (6–7 keV rest-frame) in 1136–135 and 1150+497. Thus, we fitted the ACIS-S data adding a Gaussian component to the best-fit continuum model. The Gaussian gave a significant improvement only for 1136–135 and 1150+497, with for 2 additional parameters, corresponding to PF=98% and 96% for 1136–135 and 1150+497, respectively. A more conservative test using Monte Carlo simulations (Protassov et al. 2002) yields a significance for the lines of 96% and 94%.
The confidence contours of the Gaussian width versus its energy show that the Fe line is unresolved in both sources, and consistent with both a narrow unresolved ( keV) and broad Gaussian line. Thus, we report results for both a narrow ( keV) and a broad ( keV) Gaussian. The fitted parameters are listed in Table 3. The rest-frame energy of the line for both 1136–135 and 1150+497 is consistent with the Fe K fluorescent line often detected in lower-luminosity sources. The measured Equivalent Widths are in the range 60–80 eV.
In the case of 1136–135 the Fe-K residuals appear more complex than a single Gaussian. Indeed, adding a second narrow Gaussian component to the brokwn powerlaw plus narrow line model yields a significant improvement of the fit, for 2 additional dofs, significant at PF=97.5%. The fitted rest-frame energy of the second line is keV and its EW eV. The EW of the 6.4 keV line does not change. Taking the second line energy at face value, the closest emission line would be FeK at 7.06 keV, or K from H- or He-like Fe. This finding indicates additional complexity in the X-ray spectrum of 1136–135 which warrants future investigation with higher-quality X-ray data.
In the EPIC data of 0723+679 there is no strong evidence for significant line-like residuals at the higher energies (Fig. 4), contrary to the earlier Chandra spectrum (Gambill et al. 2003). Adding a narrow Gaussian to the best-fit continuum model yields only a modest improvement of for 2 additional parameters (the energy line was fixed at 6.4 keV in the source rest-frame), corresponding to an 80% significance from both the F-test and the Monte Carlo simulations. However, the line is detected (i.e., its flux is different from zero) at 90% confidence. The lack of a stronger detection is not surprising, considering the substantial loss of data due to the flaring background. The 99% upper limit to the line Equivalent Width is EW 100 eV, fully consistent with the Chandra detection.
In summary, we confirm the detection of an Fe-K line in 1150+497 and report its first detection in 1136–134. The Fe K line is detected but not required in 0723+679, with a 99% confidence upper limit to its EW of 100 eV.
4 Discussion
4.1 The SEDs: a mix of jet and accretion disk emission
An outstanding issue in the study of radio-loud sources is the relative contribution of the accretion disk and of the unresolved jet to the emission from the core. To this end, the detection of the Fe K emission line in the X-ray spectrum, together with the knowledge of the jet parameters, can provide important clues.
4.1.1 The Fe K line: dilution by beaming?
Contrary to radio-quiet sources the presence of the Fe K line emission from the cores of radio-loud AGN is not well established. Previous ASCA, RXTE, and BeppoSAX observations detected Fe K-shell emission from the cores of the brightest Broad-Line Radio Galaxies (e.g., Sambruna, Eracleous, & Mushotzky 2002 for a review of earlier results), and in a handful of radio-loud quasars (Hasenkopf, Sambruna, & Eracleous 2000; Reeves & Turner 2000). It is generally found that the Fe K line and associated reflection continuum in BLRGs are much weaker than in their RQ counterparts, the Seyfert 1s (e.g., Sambruna et al. 2002). A recent EPIC observation of the BLRG 3C 111 also shows a weak (EW 60 eV) but resolved Fe K emission line (Lewis et al. 2005).
The simplest interpretation is that RL sources have standard disks and the reflection features are diluted by the beamed emission of the jet. Alternatively, narrow lines could come from the outer portions of an ADAF (Eracleous et al. 2000). However, it has proven difficult to disentangle the jet and isotropic contributions in BLRGs due to the lower jet/disk luminosity ratios in these sources.
The targets of this paper are higher-luminosity quasars (Table 1) for which the presence of beamed jet emission can be inferred from the large-scale jet properties. The presence of the accretion-related Fe line from their cores suggests that the beamed jet component does not fully dominate the X-ray emission from the cores.
The Chandra spectra of 1136–135 and 1150+497 are consistent with both a narrow and a broad Fe K line. Proposed sites for the origin of a narrow line, at least in radio-quiet AGN, include the edge of the pc-scale torus, the Broad-Line Region (BLR), or scattering by gas or dust along the line of sight. It is conceivable that the observed Fe lines in Seyferts are a mix of a broad component from the disk and a narrow core from either/all the locations mentioned above (Nandra 2006). In the case of 1136–135 and 1150+497, where the viewing angle to the central black hole is small, an origin from the edge of the torus seems improbable. Similarly, scattering would produce emission lines at softer X-rays, which are not observed in the ACIS and EPIC spectra of our sources. While a narrow line from the BLRs cannot be excluded, the presence of a broad Fe-line from the accretion disk appears likely.
Support for this comes from the Eddington ratios of the three quasars. From Table 1 the Eddington luminosities are L erg s-1 in 0723+679, 1136–135, and 1150+497, respectively. An estimate of the bolometric (accretion-related) luminosity comes from the optical/UV energy range of the SEDs, which we argue below is dominated by the disk emission (§ 4.1.2). The disk luminosities, Ldisk, are listed in Table 4. Comparing LEdd and Ldisk, and if the disk luminosity is representative of the bolometric luminosity, the three quasars are radiating at or very close to the Eddington limit. A standard accretion disk is thus most likely present in both powerful quasars. We thus discuss the detected Fe K line in 1136–135 and 1150+497 assuming that the line is broad, and originates from the inner radii of a standard accretion disk.
In this scenario, we can estimate the expected EW of the Fe K emission line for a given inclination angle and photon index (George
& Fabian 1991). Assuming an inclination angle 4∘, as derived from
the SED modeling (Table 4), and a photon index typical of
the X-ray emission from radio-quiet AGN, from Figure 14 of George &
Fabian (1991) the expected EW of the Fe K line is 140 eV. An
XSPEC simulation including a disk component (power law with
) plus a Gaussian line with EW=140 eV, plus a jet
component (power law with ), normalized such that
the line EW=70 eV, shows that the jet would be responsible for
50% of the total flux in 2–10 keV.
We thus conclude that both jet and disk emission contribute to the X-ray emission from the three quasar cores. Specifically, the beamed emission contributes roughly 50% to the total flux in 2–10 keV, while the disk emission dominates below 2 keV.
Our results are similar to those obtained for 3C 273 by Grandi & Palumbo (2004). A re-analysis of multi-epoch BeppoSAX spectra of 3C 273 indicated that the jet dominates over the Seyfert-like component above 2 keV, while it is the only source of X-ray emission above 40 keV, where the reflection component of the Seyfert-like emission cuts off (Grandi & Palumbo 2004; Foschini et al. 2006; Turler et al. 2006). Note that, like 3C 273, the sources in this paper are characterized by non-negligible beaming, as shown by their one-sided Chandra jets. In this case, dilution of the disk-related features in the X-ray spectrum is expected. Whether beamed radiation dominates the X-ray emission of less beamed, lower-Eddington ratio sources, such as some Broad-Line Radio Galaxies (e.g., Eracleous et al. 2000), remains to be demonstrated.
4.1.2 SED modeling
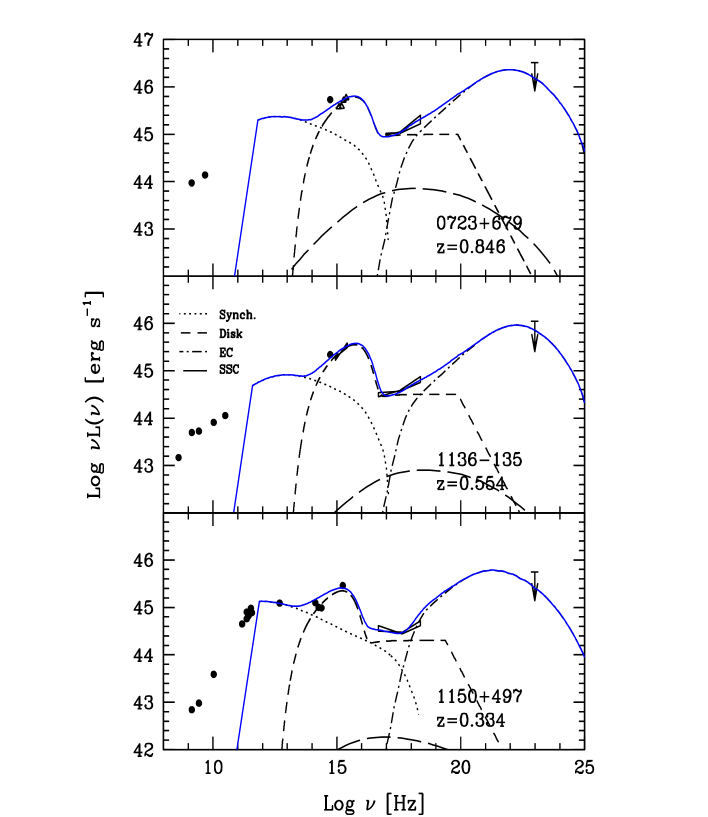
Figure 5 shows the SEDs of the cores of 0723+679, 1136–135, and 1150+497 obtained combining the X-ray best-fit continua from our Chandra observations with literature data at other wavelengths. The UV data were taken from Kuraszkiewicz et al. (2002), Lanzetta et al. (1993); the optical data from Gambill et al. (2003) and references therein; the radio from Condon et al. (1998), Kühr et al. (1981), Becker, White, & Edwards (1991), Pauliny-Toth et al. (1978). The IR data for 1150+497 were taken from the 2MASS database and from Impey & Neugebauer (1988). Only in the case of 0723+679 the optical-UV fluxes were derived from simultaneous data taken with the XMM Optical Monitor. Other data are not simultaneous or even close in time; we are not aware of multiwavelength campaigns to study these sources. None of these sources was detected by EGRET, therefore only upper limits to the GeV flux are given.
As discussed in § 4.1.1, there is evidence that both the disk and the jet contributes to the X-ray emission, with the jet becoming prominent at harder energies and the disk dominating below 2 keV. At longer wavelengths, the extremely hard UV spectrum of 1136–135 derived by Kuraszkiewicz et al. (2002) and the OM data of 0723+679 strongly suggest that the UV-optical emission in these two sources is dominated by the UV bump component associated to the disk. The optical and UV data for 1150+497 (although not simultaneous) support the same conclusion. On the other hands, the data in Figure 5 indicates that the radio through IR emission belongs to a different spectral component than optical/UV, most likely to the jet. We therefore interpret the observed SEDs using a model that combines the broad-band jet emission usually considered for blazars and a standard disk spectrum typical of radio-quiet QSOs.
We parameterize the disk emission in terms of a blackbody (optical to soft X-rays) plus a flat spectrum reproducing the reflection component at harder X-rays (Korista 1997). We can fix the disk luminosity in all the three sources at the level indicated by the observed optical-UV continuum. Interestingly, the direct observation of the disk is usually prevented in blazars by the intense non-thermal jet emission. In that case the disk luminosity is usually estimated assuming that the Broad Line Region reprocesses a fraction of the disk continuum, (Maraschi & Tavecchio 2003). In the sources under consideration here, the disk and the BLR luminosities are simultaneously available, allowing to check the assumption above. Indeed, using the values of in Table 1 and the value of fixed by the SEDs, we derive for 0723+679, for 1136–135, and for 1150+497. These values are consistent with the assumption within the (probably large) uncertainties involved in this procedure.
For the jet, we use the model fully described in Maraschi & Tavecchio (2003) to calculate the synchrotron (radio-IR) and Inverse Compton (IC) emission. The IC component includes as seed photons the synchrotron photons themselves (SSC) plus the external radiation field (EC). In fact, as apparent from Table 1, all three sources have luminous BLRs, providing an important source of soft photons. To calculate the EC emission it is necessary to provide the energy density of the BLR radiation: given the luminosity of the BLR (Table 1), it is possible to derive the energy density of the external radiation field assuming a distance for the BLR clouds. has been directly estimated for a few sources through the reverberation mapping technique (Kaspi et al. 2005; Bentz et al. 2006). These studies suggest a proportionality of and the luminosity of the illuminating source. From these relations and the adopted luminosities of the disk we derived the values of used as input for the modeling. Not all the parameters are fully constrained. The size of the emitting region, usually constrained in blazar modeling by the minimum variability timescale, is fixed here at cm, a typical value for blazars with similar power (e.g., Ghisellini et al. 1998; Tavecchio et al. 2002).
With these choices we calculated the models shown in Figure 5. The jet model cannot reproduce the data in the radio band, since the synchrotron emission is self-absorbed below Hz. As usually assumed, the radio component is probably due to the integrated contribution from the emission of the jet at larger distance from the core. In the model we assume that the high-energy component has the largest luminosity compatible with the EGRET upper limit. The main parameter determining the gamma-ray luminosity is the energy of the electrons emitting at the peak . Increasing (decreasing) its value causes the gamma-ray luminosity to increase (decrease) without affecting the rest of the observed SED. As an example we show in Figure 6 the SEDs of 0723+679 computed for two different values of and all the other parameters unchanged.
The physical parameters derived modeling the jet emission do not differ from those inferred for other powerful blazars (Tavecchio et al. 2002). A more prominent disk component in the optical-UV band with respect to the other powerful blazars is reproduced using a slightly less intense synchrotron continuum, obtained with a smaller magnetic field. In this respect, data in the IR-submm range would be crucial, since they would allow to probe the actual level of the peak of the synchrotron component.
We conclude that the SEDs of the three quasars are best explained by a mixed contribution of non-thermal jet emission and emission related to the accretion disk. The jet emission should dominates the SEDs below IR and above hard X-ray wavelengths, while the disk contributes mainly to the optical/UV and soft X-rays. However, we stress that the modeling of the jet component is based on rather poor data. Indeed, the only strong observational constraint is offered by the X-ray data; because of the lack of information in the IR-submm region and the upper limit in the -ray band, we have a large degree of freedom in the modeling. Thus, future observations focussed in the IR region and the possible detection in the MeV-GeV band will provide an important test of our interpretation.
4.2 Jet power and accretion
Important physical quantities can be inferred from the SED modeling, in particular the power carried by the jet, , and its radiative luminosity (corrected for beaming), . We derive assuming a composition of 1 (cold) proton per electron (e.g., Ghisellini & Celotti 2002; Maraschi & Tavecchio 2003). The jet power is then dominated by the bulk kinetic power associated with the proton component. The derived values are reported in Table 3. Since the estimated kinetic power depends on the total number of protons, which is in turn equal to the total number of electrons, the result depends only on the electrons at low energies which, for a given energy density of the external radiation field, are determined by the requirement of reproducing the X-ray spectrum. Therefore, in spite of the large range in some of the parameters allowed by the poor sampling of the SED, the derived power can be considered reasonably constrained.
Another input parameter for deriving and is the bulk Lorentz factor . Here we assume , implying an observing angle . From the values of from Table 4 the inclination angles are 3.8∘ for 0723+679 and 1136–135, and 2.8∘ for 1150+497. We recall that, for a given Doppler factor , the observing angle must be less than (e.g., Tavecchio et al. 2004).
Interestingly, for these sources we also have independent estimates of the jet power coming from the modeling of the multiwavelength large-scale jet emission. We can therefore compare the power of the jet on two vastly different scales (Tavecchio et al. 2004). The kpc-scale jet power was estimated by us (Sambruna et al. 2002) and is erg s-1, erg s-1, and erg s-1 for 0723+679, 1136–135, and 1150+497, respectively. A comparison with the pc-scale values reported in Table 4 shows that the two powers agree within a factor of 2, confirming previous findings for a group of gamma-ray blazars (Tavecchio et al. 2004). This suggests that the power channeled into the jet is stable on timescales of the order of yrs, and that a negligible fraction of the kinetic power of the jet is dissipated along its path from the innermost regions of the AGN to the 100s-kpc scales.
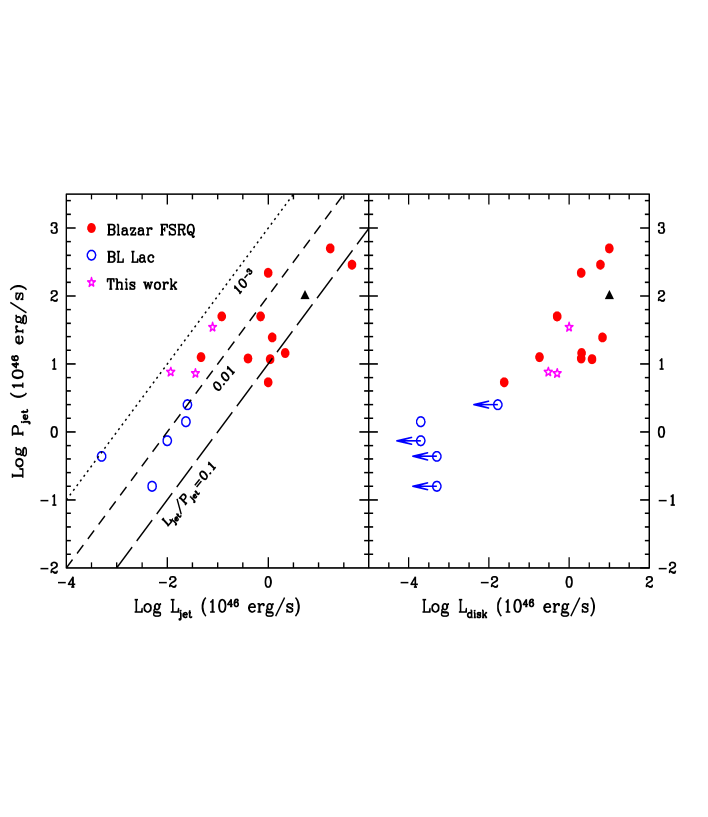
It is quite interesting to compare the jet power derived above with that of jet in other blazars. In Figure 7 the jet power is plotted against the radiative luminosity of the jet (left panel) and the disk luminosity (right panel) for the three sources of this paper, together with the blazars of the sample studied in Maraschi & Tavecchio (2003). The powers of the newly discovered MeV blazar SWIFT J0746.3+2548 (Sambruna et al. 2006a) at are also reported.
In Figure 7, the powers of 0723+679, 1136–135, and 1150+497 are clearly consistent with those of other blazars in both plots. The oblique lines in the left panel mark different jet radiative efficiencies, . It can be seen that the three sources analized here are characterized by smaller radiative efficiencies, , than the majority of blazar jets, which instead are located in .
A possible bias in Figure 7 is related to the fact that the radiative luminosity of the jets in FSRQs with kinetic power similar to 0723+679, 1136–135, and 1150+497 is dominated by the emission in the -ray band, and that the modeling of the SEDs (from which the data in Figure 7 were calculated) are generally done assuming the average flux of the detections obtained by EGRET. Therefore, the data in Figure 7 are representative of states of moderately high activity, and it is likely that the radiative luminosity averaged over the duty cycle of the -ray emission is more similar to that derived for the three sources analized here. Future –ray GeV observations, probing the band where most of the power is released (see Figs. 5 and 6) and better characterizing the -ray duty cycle, will allow us to better assess the total radiative output, greatly improving the estimate of the radiative efficiency estimates.
5 Summary and Conclusions
We presented deep Chandra and XMM-Newton observations of three radio-loud quasars with powerful large-scale X-ray jets. The spatial, timing, and spectral properties of the cores were discussed. The results are:
-
•
Soft X-ray (0.3–2 keV) diffuse emission is present in the ACIS images around the cores of 1150+497 and 1136–135. The diffuse emission scale, 30–40 kpc, and luminosity, L erg s-1, suggest thermal emission from the medium in the host galaxy and/or a galaxy group. The contribution of the diffuse component to the core X-ray emission within 1.5′′ is negligible.
-
•
The X-ray continua of the cores are well described in all cases by a broken power law model, yielding , , and E keV.
-
•
The Fe K emission line is confirmed in 1136–135 and 1150+497, with a rest-frame EW 70 eV. The short useful EPIC exposure of 0723+679 unfortunately hinders confirmation of the Fe K line, previously detected with Chandra.
-
•
Modest (factor 1.2) flux variations are observed in 1150+497 at both soft (0.3–1.5 keV) and hard (1.5–10 keV) energies within a few hours.
-
•
The Fe K line, the shape of the optical/UV continuum, and the Eddington ratios in the three quasars suggest the presence of a standard accretion disk in the core. From the observed EW of a broad Fe K line of 70 eV, we infer that the jet contributes 50% of the total flux in 2–10 keV.
-
•
The SEDs of the three sources are well described by a model including both the jet and the disk contributions. The latter dominates the optical to soft X-ray continuum, while beamed emission is responsible for the radio-to-IR flux and emission at energies 2 keV.
-
•
The jet kinetic power and disk luminosity follow the same trend observed for other powerful blazars, implying that a large fraction of the accretion power is converted into bulk kinetic energy of the jet.
Future coordinated observations, especially at gamma-rays with GLAST, will be necessary to confirm the estimates of the jet power and efficiency. Indeed, in the most powerful blazars the bulk of the total luminosity emerges at GeV energies, making this band of crucial importance for the study of jets.
References
- (1)
- (2) Bregman, J. N., et al. 1986, ApJ, 301, 708
- (3)
- (4) Bridle, A.H. & Perley, R.A. 1984, ARA&A, 22, 319
- (5)
- (6) Cao, X. & Jiang, D.R. 1999, MNRAS, 307, 802
- (7)
- (8) Celotti, A., Ghisellini, G., & Chiaberge, M. 2001, MNRAS, 321, L1
- (9)
- (10) Corbel S., Fender R.P., Tomsick J.A., et al., 2004, ApJ, 617, 1272
- (11)
- (12) Crawford, C.S. & Fabian, A.C. 2003, MNRAS, 339, 1163
- (13)
- (14) Ettori, S. 2000, MNRAS, 311, 313
- (15)
- (16) Fanaroff, B.L. & Riley, J.M. 1974, MNRAS, 167, 31P
- (17)
- (18) Fender, R., & Belloni, T. 2004, ARA&A, 42, 317
- (19)
- (20) Foschini, L. et al. 2006, A&A, in press (astro-ph/0603268)
- (21)
- (22) Fossati, G., Maraschi, L., Celotti, A., Comastri, A., & Ghisellini, G. 1998, MNRAS, 299, 433
- (23)
- (24) Gambill, J.K., Sambruna, R.M., et al. 2003, A&A, 401, 505
- (25)
- (26) Ghisellini, G., Celotti, A., Fossati, G., Maraschi, L., & Comastri, A. 1998, MNRAS, 301, 451
- (27)
- (28) Gliozzi, M., Sambruna, R.M., & Eracleous, M. 2003, ApJ, 584, 176
- (29)
- (30) Grandi, P. & Palumbo, G.C.C. 2004, Science, 306, 998
- (31)
- (32) Hasenkopf, C., Sambruna, R.M., & Eracleous, M. 2002, ApJ, 575, 127
- (33)
- (34) Lacy, M. et al. 2001, ApJ, 551, L17
- (35)
- (36) Liu, F.K. & Xie, G.Z. 1992, A&AS, 95, 249
- (37)
- (38) Maraschi, L. & Tavecchio, F. 2003, ApJ, 593, 667
- (39)
- (40) Mason K.O., Breeveld A., Much R., et al., 2001, A&A 365, L36
- (41)
- (42) Morrison, R. & McCammon, D. 1983, ApJ, 270, 119
- (43)
- (44) Nandra, K. et al. 1997, ApJ, 478, 70
- (45)
- (46) Oshlack, A. Y. K. N., Webster, R. L., & Whiting, M. T. 2002, ApJ, 576, 81
- (47)
- (48) Page, M. et al 2004a, MNRAS, 353, 133
- (49)
- (50) Page, M. et al 2004b, MNRAS, 347, 316
- (51)
- (52) Protassov R. et al. 2002, ApJ, 571, 545
- (53)
- (54) Reeves, J.N, & Turner, M.J.L. 2000, MNRAS, 316, 234
- (55)
- (56) Sambruna, R.M. et al. 2006a, ApJ, in press (astroph/0603829)
- (57)
- (58) Sambruna, R.M. et al. 2006b, ApJ, 421, 717 (S06)
- (59)
- (60) Sambruna, R.M. et al. 2004, ApJ, 608, 698
- (61)
- (62) Sambruna, R.M. et al. 2002, ApJ, 571, 206
- (63)
- (64) Sambruna, R.M., Eracleous, M., & Mushotzky, R.F. 2002, NewAR, 46, 215
- (65)
- (66) Sambruna, R.M., Maraschi, L., & Urry, C.M. 1996, ApJ, 463, 444
- (67)
- (68) Sarazin C.L., 1988, X-ray emission from clusters of galaxies, Cambridge University Press
- (69)
- (70) Shields, G. A., et al. 2003, ApJ, 583, 124
- (71)
- (72) Tavecchio, F., Maraschi, L., Sambruna, R.M., Gliozzi, M., Cheung, C.C., Wardle, J.F.C., & Urry, C.M. 2006, ApJ, in press (astroph/0512389)
- (73)
- (74) Tavecchio, F., Maraschi, L., Sambruna, R.M., Urry, C.M., Cheung, C.C., Gambill, J.K., & Scarpa, 2004, ApJ, 614, 64
- (75)
- (76) Tavecchio, F. et al. 2002, ApJ, 575, 137
- (77)
- (78) Tavecchio, F., Maraschi, L., Sambruna, R.M., & Urry, C.M. 2000, ApJ, 544, L23
- (79)
- (80) Turler M. et al. 2006, A&A, in press (astro-ph/0603579)
- (81)
- (82) Urry, C.M. & Padovani, P. 1995, PASP, 107, 803
- (83)
- (84) von Montigny, C. et al. 1997, ApJ, 483, 161
- (85)
- (86) Woo, J.-H. & Urry, C.M. 2002, ApJ, 579, 530
- (87)
- (88) Zombeck M.V., 1990, Handbook of Space Astronomy and Astrophysics, Cambridge University Press, Cambridge
| Table 1: The Targets | ||||||
| Source | Gal NH | Class. | mV | log LBLR | MBH | |
| (1) | (2) | (3) | (4) | (5) | (6) | (7) |
| 0723+679 | 0.846 | 4.31 | SSRQ | 18.0 | 44.76 | 4.6 |
| 1136–135 | 0.554 | 3.5 | FSRQ | 16.1 | 45.17 | 4.6 |
| 1150+497 | 0.334 | 2.0 | FSRQ | 17.1 | 44.36 | 3.3 |
Explanation of Columns: 1=Source IAU name; 2=Redshift; 3=Galactic column density in cm-2; 4=Radio Classification: Steep Spectrum Radio Quasar (SSRQ), Flat Spectrum Radio Quasar (FSRQ); 5=Core optical V magnitude; 6=Total luminosity of the BLR (Cao & Jiang 1999); 7=Black hole mass in Modot, from Woo & Urry (2002); Oshlack, Webster, & Whiting (2002); Shields et al. (2003).
| Table 2: Best-fit of X-ray Continua | |
|---|---|
| Source | Best-fit Model and Parameters |
| 0723+679 | Broken Power Law |
| = 1.84 0.04 | |
| = 1.65 | |
| E keV | |
| =0.98/602 | |
| F erg cm-2 s-1 | |
| L erg s-1 | |
| 1136–135 | Broken Power Law |
| = 1.91 0.06 | |
| = 1.72 0.06 | |
| E keV | |
| =1.03/257 | |
| F erg cm-2 s-1 | |
| L erg s-1 | |
| 1150+497 | Broken Power Law |
| = 2.10 0.08 | |
| = 1.72 0.05 | |
| E keV | |
| =1.07/324 | |
| F erg cm-2 s-1 | |
| L erg s-1 | |
Explanation of Columns: 1=Source; 2=Description of parameters: for the continuum, and are the photon indices below and above the break energy, respectively; F and L the intrinsic (absorption-corrected) flux and luminosity in 2–10 keV.
| Table 3: Fe K line | |
|---|---|
| 1136–135 | Narrow Gaussian |
| E keV | |
| keV | |
| Flux= ph cm-2 s-1 | |
| /dofs=1.01/254 | |
| EW eV | |
| Broad Gaussian | |
| E keV | |
| keV | |
| /dofs=1.06/254 | |
| Flux= ph cm-2 s-1 | |
| EW eV | |
| 1150+497 | Narrow Gaussian |
| E keV | |
| keV | |
| /dofs=0.89/232 | |
| Flux= ph cm-2 s-1 | |
| EW eV | |
| Broad Gaussian | |
| E keV | |
| keV | |
| /dofs=0.88/232 | |
| Flux= ph cm-2 s-1 | |
| EW eV | |
Explanation of Columns: 1=Source; 2=Description of parameters: Erest and are the Gaussian center energy and width in the source rest-frame, EW the line Equivalent Width, Flux is the line flux.
| Table 4: SEDs Parametersa | |||||||||
| Source | RBLR | Ldisk | Ljet | Pjet | |||||
| (1) | (2) | (3) | (4) | (5) | (6) | (7) | (8) | (9) | (10) |
| 0723+679 | 15 | 100 | 1 | 7 | 2 | 2.0 | 10 | 0.8 | 350 |
| 1136–135 | 15 | 150 | 1 | 1.5 | 2 | 5.2 | 5 | 0.4 | 73 |
| 1150+497 | 20 | 30 | 3 | 1 | 4 | 2.6 | 3 | 0.1 | 76 |
Note (see also column explanations): a=Additional parameters: low energy boundary , broken power law spectral indices =2, =3.5, emission region radius cm.
Explanation of Columns: 1=Source IAU name; 2=Doppler factor; 3=Break energy of the broken-power-law distribution of particles with spectral indices below and above the break (see Note); 4=High energy boundary of the broken power law (in 104); 5=Normalization of the particle distribution (in 104 cm-2 s-1); 6=Magnetic field (in Gauss); 7=Size of the BLR (in cm); 8=Disk luminosity (in erg s-1); 9=Jet luminosity (in erg s-1); 10=Jet power (in erg s-1).