11email: ajc@ast.leeds.ac.uk22institutetext: Astrophysics Research Institute, Liverpool John Moores University, Twelve Quays House, Egerton Wharf, Birkenhead, CH41 1LD, UK
Evidence for variable outflows
in the Young
Stellar Object V645 Cygni
Abstract
Aims. As part of the Red MSX Source Survey of Massive Young Stellar Objects (MYSOs) we have conducted multi-wavelength follow up observations of the well-known object. We present our data on this object, whose near-infrared spectrum is exceptional and place these in context with previous observations
Methods. Our observations of V645 Cyg included near/mid infrared imaging observations, 13CO 2-1 line observations and high signal-to-noise velocity resolved near-infrared spectroscopy.
Results. The spectrum shows P-Cygni hydrogen Brackett emission, consistent with a high velocity stellar wind. A red-shifted emission component to a number of near-IR emission lines was also uncovered. This is associated with a similar component in the H line. V645 Cyg is also found to have variable CO first overtone bandhead emission
Conclusions. The data clearly indicate that the outflow of V645 Cyg is variable. The unidentified feature in a previously published optical spectrum is identified with a receding outflow at 2000 kms-1. The nature of this feature, which is found in hydrogen and helium atomic lines and CO molecular lines remains a puzzle.
Key Words.:
V645 Cyg; early-type; spectroscopy; circumstellar matter; winds,outflows1 Introduction
The variable star V645 Cyg has been subject to detailed study since its identification with the strong infrared source AFGL 2789 by Walker & Price (1975) and Lebofsky et al. (1976). The optical follow up observations of Cohen (1977) revealed the star to be a young O7e type star within a polarised optical nebula. The presence of P-Cygni profile hydrogen recombination lines in the optical spectrum was interpreted as evidence for a stellar wind with velocities as high as 1000 kms-1. Further analysis by Goodrich (1986) and Hamann & Persson (1989) showed the star to have similar P-Cygni profile He i, O i, Si ii and Ca ii transition lines and concluded that the optical spectrum was more typical of a Herbig Ae/Be type star. In addition to the lines associated with the stellar wind, the optical spectrum of V645 Cyg also possesses emission lines of C i, [S ii], K i, Fei, Fe ii and [Fe ii]. The presence of blue-shifted forbidden [S ii] lines had been suggested by Hamann & Persson (1989) to be evidence for a dense circumstellar disc which obscures the receding, red-shifted part of a bipolar flow around V645 Cyg.
Near-IR spectroscopic observations have also been performed on V645 Cyg by Harvey & Lada (1980), Geballe & Persson (1987), Carr (1989) and Biscaya et al. (1997) who found H i emission and that the CO first-overtone bandheads may be variable respectively.
V645 Cyg is located within a high density molecular cloud and has been associated with a low velocity moderately collimated bipolar molecular outflow. The CO millimetre line observations of Rodriguez, Torrelles & Moran (1981) and Verdes-Montenegro et al. (1991) showed the outflow to be oriented in the north-south direction at small scales (15 arcsec), coinciding with the optical outflow observed by Goodrich (1986). Whilst at larger scales (1) the CO outflow is reoriented into the southeast-northwest direction.
Studies of the radio continuum emission found weak (0.8 mJy) extended (10 arcsec) emission in the north-south direction (Curiel et al 1989; Skinner, Brown and Stewart 1993). This emission was also determined to be variable by Girart et al (2002), who speculated that the variability could be due to the episodic ejection of material or recombination of the ionised gas on a very short timescale. The object is also associated with OH (1665 MHz) (Morris & Kazes, 1982), H2O (Lada et al., 1981) and methanol masers (Slysh et al., 1999).
Therefore, the picture of V645 Cyg that has emerged is that of a relatively unembedded young massive star, with a high velocity stellar wind and an associated optical and molecular outflow.
We are currently undertaking a survey aimed at finding massive young stellar objects (MYSOs) in the Galaxy (Lumsden et al. 2002; Hoare et al. 2004), known as the Red MSX Survey (RMS). We have selected the MSX source G094.6028-01.7966 as having infrared colours indicative of a MYSO. This source is identified as V645 Cygni. In order to have complete datasets to study the properties of MYSOs, we conducted a series of follow-up observations. Here, we present millimetre, mid-IR, near-IR and optical observations of V645 Cyg. In Section 2 we describe the observations and the procedure taken to produce the final spectrum, in Section 3 we present the data and discuss the features present and in Section 4 we discuss our observations in the context of previous work.
2 Observations and Data Reduction
2.1 Near-IR imaging
The near-IR imaging observations were obtained using the United Kingdom Infrared Telescope (UKIRT) Fast Track Imaging (UFTI) camera on the 5th of August 2002. UFTI has a 10241024 HgCdTe array with a 0.091 arcsec per pixel plate scale. The band filter with 2.03 to 2.37m coverage was used for the observations. To correct for sky background noise the observations were performed using a standard 9 point jitter pattern. The bias, flat and dark correction together with mosaicing was performed using the ORAC-DR UFTI package111http://www.oracdr.org/. The ORAC-DR pipeline generated final mosaic image was corrected for astrometry by using Two Micron All Sky Survey (2MASS) field sources as references.
2.2 Mid-IR imaging
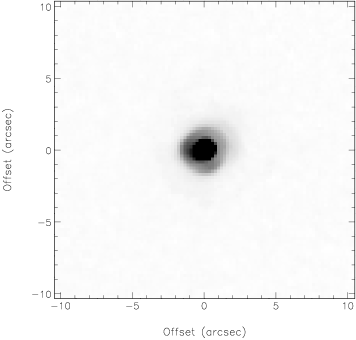
The mid-IR imaging data was obtained using the Mid-Infrared Echelle Spectrometer (Michelle) on UKIRT on the 2nd of August 2002. Michelle is a mid-infrared (8-25 micron) imager and spectrometer with a 320x240 Si:As array. In imaging mode Michelle provides a 67.2 x 50.4 arcsec field of view with a 0.2134 per pixel plate scale. The observations were made using a narrow band (12.5m) filter with a bandwidth of 1.2m. As is standard at these wavelengths, the imaging was performed using an on chip nod and chop procedure. The nodding was performed in Right Ascension with a period of 20.5 sec and the chopping in Declination with a frequency of 6.34 Hz. The chop throw was 20.7 arcsec and the nod separation was 20 arcsec. The airmass during the observations was 1.57. The data were reduced using the ORAC-DR Michelle11footnotemark: 1 package and the nod and chop pairs were median averaged to produce a final 20 arcsec 20 arcsec image. The resulting near- and mid-infrared images are shown in Fig. 1. Note that the central source visible in the K band image, known as N0 is also present in the mid-IR, whereas the N1 component, located to the North-West is not. The astrometry is derived from the data by comparison with standard stars. The mid-IR position of the source is offset to the East by less than 2 arcsec compared to the 2MASS position of N0, and is within UKIRT’s pointing accuracy.
2.3 Near-IR spectroscopy
The spectroscopy data was obtained using the UKIRT 1-5m Imager Spectrometer (UIST) on the night of 12 June 2003. UIST has a 10241024 InSb Array and a 0.12 arcsec per pixel plate scale. The observations were made using a 120 arcsec long slit with a width of 4 pixels. The seeing was stable at 1 arcsec throughout the observations. The HK grism was used, which allowed complete wavelength coverage from 1.4 m to 2.5 m with an approximate spectral resolution of 450. This corresponds to approximately 650 kms-1 at 1.6 m. The slit was aligned to 120o East of North. The observations were nodded along the slit to provide sky subtraction and were preceded by a flat and argon arc exposure for suitable later calibration.
A standard star was observed immediately before the object so that telluric absorption could be corrected for, the standard was within 0.1 airmass of the source observations. The standard star used was BS8246 an AO dwarf whose spectrum only shows hydrogen absorption lines in the observed wavelength range at this spectral resolution.
The initial data reduction of the spectrum (i.e bias, dark and flat correction) was performed using the ORAC-DR11footnotemark: 1 UIST package. The resulting spectral image was then manually cleaned to remove cosmic ray artifacts and bad pixels. To produce a sky subtracted spectrum the positive and negative nod positions were extracted and subsequently subtracted from each other. The region known as N0 (cf. Fig. 1) was extracted (0.80 arsec2). The N1 region (the reflection nebulosity to the north-west) proved too faint for any useful analysis. Wavelength calibration was carried out using the argon arc lamp frames.
To correct the spectrum for atmospheric absorption, it was divided through by that of the standard star. To reduce the impact of the hydrogen recombination Brackett absorption lines on the final object spectrum, any strong absorption lines were removed and replaced with an interpolated continuum prior to division. The interpolation of the underlying continuum was determined via Gaussian or Lorentzian (depending on the shape of the line) fitting to the lines.
We did not flux calibrate the data as the observations were taken through thin cloud and conditions were not photometric. However, the shape of the continuum should be reasonably well reproduced.
All of the data reduction steps described above were performed using the STARLINK package FIGARO. Despite the fact that V645 Cyg is a well-studied object, to our knowledge, the near-infrared spectra under discussion, both in terms of wavelength coverage and resolution, constitute the best data available for this object.
2.4 Optical Spectroscopy
We have obtained intermediate resolution optical spectra of V645 Cyg from the Isaac Newton Group archive222http://archive.ast.cam.ac.uk/ingarch/. The observations of H obtained on the 10th July 1993 and H on the 19th December 1994 were taken with the Intermediate Dispersion Spectrograph (IDS) on the 2.5 metre Isaac Newton Telescope. For the H spectrum the 500mm camera, EEV5 1242x1152 element array and the R632V grating was used. This gave a spectral resolution of 130 kms-1. A similar setup, but now with the Tek3 1024x1024 pixel array and R1200B grating was used for the H observations, which gave a velocity resolution of 80 kms-1.
The data were cosmic ray, bias and flat corrected. Wavelength calibration was provided by CuAr and CuNe arc frames.
3 Results
3.1 Infrared Luminosity
The distance to V645 Cyg has been subject to considerable debate (see Schulz et al 1989 for a full discussion) with values ranging from 3.5 to 6 kpc. From our high sensitivity 13CO 2-1 line spectrum (Busfield, 2006) we determined the radial velocity of V645 Cyg to be VLSRkms-1,which is consistent with previous studies (e.g Harvey & Lada 1980, Schulz et al 1989). Combining this value and a standard galactic rotation curve (Brand & Blitz, 1993) we calculate the kinematic distance to V645 Cyg to be 5.7 kpc (Busfield, 2006). However, V645 Cyg is located within the second quadrant () of our galaxy, where the non-circular motions in the Perseus arm (Humphreys, 1976) are significant. Therefore, after taking into account a proper motion of 10 kms-1 and the uncertainty in the galactic rotation curve, we arrive at a distance of 5.71 kpc. This is on the higher end of the previous distance estimates and consistent with earlier millimetre line data (e.g. Harvey & Lada 1980). After including IRAS photometry, the total infrared luminosity of V645 Cyg can be estimated to be between 27L⊙. This corresponds to an early B-type for the object, even for the lower distance of 3 kpc. Despite the uncertainty in the distance, V645 Cyg is clearly an intrinsically bright source.
3.2 Near/Mid Infrared Imaging
In Figure 1 we present a near-IR and mid-IR band image of V645 Cyg. The band image shows a bright point source (named V645 Cyg N0) with a diffuse nebulosity (V645 Cyg N1) approximately 5 arcsec to the north-west. The N0 component is a factor of 200 brighter than the N1 component, and has a full width at half maximum (FWHM) of approximately 0.48 arcsec. This is comparable to the seeing and N0 can be considered a point source. The band image shows mid-IR emission only from the N0 component, and no emission from N1. A comparison with unresolved (i.e showing an airy disk) objects observed on the same night, indicates the mid-IR emission from V645 Cyg may be slightly resolved in the north-west direction. This emission would most likely arise from hot dust surrounding V645 N0, the other possibility is an ultracompact H ii region but the relative weakness of the radio continuum emission does not support this notion.
The interpretation of previous optical imaging observations (Cohen 1977; Goodrich 1986; Hamann & Persson 1989) was that N0 and N1 are knots of reflection emission from the star which is more deeply embedded within the molecular cloud. However, our infrared imaging observations show the N0 component to be a point source in the near-IR. To within the errors of less than 2 arcsec, the sole source of mid-IR emission is associated with N0 as well. In addition, the slightly lower spatial resolution polarimetric measurements by Minchin et al (1991) show a centro-symmetric polarization pattern pointing toward a source close to N0 being the central source. Given this evidence, it seems clear that the N0 component is the star itself and not simply a knot of reflection nebulosity like N1.

3.3 Near-IR spectroscopy
In Figure 2 we present the final spectrum of V645 Cyg N0. The spectrum is red, and displays a number of emission and absorption lines due to H i, He i, CO, Fe ii, [Fe ii] and Na i. Perhaps most notable of these are the strong CO bandhead emission at 2.3 m, the P-Cygni profiles of the hydrogen recombination lines and the strong blueshifted 2.058m He i absorption line. We discuss the properties of the spectrum in more detail below.

3.3.1 Hydrogen
As can be seen in Fig. 2, the Brackett series hydrogen recombination lines show P-Cygni profiles. Such line profiles have previously been observed in optical hydrogen lines (Cohen 1977; Hamann & Persson 1989; Goodrich 1986), however the velocities implied are nearly double that previously observed. The blue absorption wing extends to velocities of nearly -2000 kms-1. This may imply an increase in the wind velocity or it could simply be an optical depth effect.


3.3.2 Helium
The most obvious He i line in the spectrum is the strongly blue-shifted (again up to -2000 kms-1) absorption line at 2.058 m (plotted together with the 1.70 m line in Fig. 3). The absence of an emission component makes this line notably dissimilar to the P-Cygni profile lines in the spectrum, and is indicative of a much smaller line forming region than the hydrogen lines. The propensity of this He i line to manifest itself in absorption is well known (Drew, Bunn and Hoare, 1993), and is attributable to the metastable character of its lower level.
The other He i line in the spectrum, at 1.70 m, has weak blueshifted absorption, but no obvious emission at the systemic velocity. The emission that is present at the bluest velocities is due to Fe ii, not the He i line itself. As the line is optically thin, it is much weaker in absorption than the 2.058 m line. The emission feature at 1800 kms-1 can not be identified with any known lines listed, instead, we will argue that this is red-shifted helium emission. Using the presence and absence of helium lines in the spectrum, we can spectrally type the object. To this end we compare with the spectral atlas of Hanson, Conti & Rieke (1996). The mere presence of He i absorption argues for an early spectral type, but the complete absence of the He ii 2.19 m puts it towards the later end of the O star spectrum. The absorption of He i 1.70 and 2.058 m lines and weak emission from He i 2.11 m gives the best match for a late O (8.5) supergiant type object. Because the lines are most likely to be formed in the wind, it is not the spectral type of the star itself that we have determined, rather it is more plausible that the wind is optically thick and that the extended, dense, wind creates a pseudo-photosphere with this early type spectrum. This solves the potential puzzle why the outflow velocities are much higher than might be expected from a supergiant, as the embedded object where the flow finds its origin is much smaller. It also implies that we deal with a much hotter object than implied by the spectral type itself.
3.3.3 Variable CO Bandhead Emission
The spectrum shows strong first overtone 12CO bandhead emission, the CO 2-0, 3-1, 4-2 and possibly even 5-3 bands are visible in the spectrum. No evidence for 13CO emission is found. CO emission was first detected, with an equivalent width of 3.8, by Geballe & Persson (1987) in 1985 but the subsequent searches of Carr (1989) in 1986 and Biscaya et al. (1997) in 1997, determined strict 3 upper limits to the equivalent width of 1.3 and 0.79 respectively. This together with our data (equivalent width 5.2) obtained in 2003, indicates that the object has a strong variability in its CO emission. Unfortunately the infrequency of these observations makes it difficult to make any conclusions about the timescale of this variability. However, from the 1985 detection and subsequent 1986 non-detection we can say that the CO emission must switch off relatively quickly.
The CO bandhead emission also shows an unusual profile. Figure 3 zooms in on the CO 2-0 bandhead, and compares this with a “typical” emission line from another of our target stars (Clarke et al. in preparation). The lines appear to have a double peak, the weaker red-shifted peak having a velocity of 1800kms-1. This may be related to the similarly redshifted He i emission, but would rule out rotation as the single cause of the kinematics.
3.3.4 Other metals
Fluorescent Fe ii emission is present at 1.680 m while forbidden [Fe ii] emission at 1.643 m is also present. The latter is blended however with the Brackett 12-4 line. The emission at 1.711 m seems unlikely to be associated with the [Fe ii] line at this approximate wavelength as its intensity should be less than a tenth of the 1.644 m line. This emission is therefore more likely the red-shifted component of the nearby 1.701m He i emission, of which its velocity agrees well. A weak Na i emission line can be also seen at 2.208 m. The Fe ii, [Fe ii] and Na i line profiles all appear unresolved and certainly do not show the same velocity structure as the hydrogen or helium lines. This finding complements the optical studies of Hamann & Persson (1989) which also found no structure in the iron lines.
3.3.5 High Velocity Red-Shifted emission
As already alluded to above, a red-shifted emission component is present in the 1.701m He i line and in the CO bandhead emission lines. The velocity of this component is approximately 1800 kms-1. Br does not display the feature and this would be in apparent contradiction with the fact that we can see it in both lower and higher excitation lines. However, the component may have been observed previously in optical hydrogen lines by Hamann & Persson (1989). They specifically highlight an unidentified emission feature redshifted by 1800 kms-1 from the H line in their optical spectrum of the object. This is in agreement with the features that we find in helium and carbon-monoxide.
In Figure 4 we present H and spectra of V645 N0. The H emission line is notably broader than the H line, and is attributable to the H being optically thick, enhancing the appearance of the electron scattered wings. In this particular spectrum the H line also possesses the red-shifted counterpart with a velocity of approximately 1800 kms-1, this agrees well with the red features in the near-IR CO and He i lines. The equivalent width of the red-shifted H component is 2% of the main line. The spectrum of does not show any evidence for a red-shifted counterpart. The signal-to-noise at H is less than at the redder wavelengths, but this should not necessarily explain the absence of the red-shifted feature. However, as it is not unreasonable to assume that the extinction towards the feature is much higher at the bluer wavelengths, relative strength of the receding component compared to the “main” feature could be much less at H than at H, explaining its non-detection. Based on a similar argument we might expect the detection of this feature at Br where it is most certainly not seen. Pending proper radiative transfer computations this will be difficult to predict, but we note that H is an optically thicker line than Br, enhancing the relative strength of any other, but optically thin, feature from the same line.
4 Discussion and Conclusions
We have presented new multi-wavelength observations of V645 Cyg. Our mid/near infrared imaging data imply that the stellar N0 component of V645 Cyg is the location of the mid infrared emission from this source. N0 is also the exciting star of the diffuse reflection nebulae V645 Cyg N1, as previously shown by Minchin et al (1991).
The P-Cygni like absorption of the Brackett hydrogen lines is consistent with a powerful stellar wind. The velocity of this wind is typical of that expected from a young OB type star but stands out for a massive young stellar object, where much lower outflow velocities are the norm (Drew, Bunn and Hoare (1993): many massive young stellar objects show no P-Cygni features at all). Indeed, when taking the crude spectral classification of an O8.5 supergiant at face value, the spectral class itself would be consistent with low outflow velocities, as typically, supergiants have lower escape velocities than dwarf stars. The fact that the classification is based on absorption lines extending to 2000 kms-1 strongly suggests, however, we are dealing with a rapidly expanding pseudo-photosphere. This notion is corroborated by the luminosity estimate for V645 Cyg, which indicates it to be a high mass object but not a supergiant. For the accepted distances (roughly 3-6 kpc), the luminosity falls within the range 27L⊙. This is consistent with early B/late O star zero-age-main-sequence bolometric luminosities, but not with a supergiant luminosity. The fact that the high excitation He i lines do not show visible emission indicates that the acceleration region is very small, and that the terminal velocities are reached quickly. These high velocities are not often observed in MYSOs. Low outflow velocities in MYSOs can be explained by radiatively driven disk-winds (cf. Drew, Proga and Stone 1998). Were V645 Cyg to belong to the MYSO class, it would would appear that the circumstellar disk has disappeared and the wind is a purely radiatively driven stellar wind. It may thus well be a transitionary object between the MYSO phase and the ensuing H ii region phase. In this case the wind must still be thick enough to absorb the ionising radiation from the central star since there is as yet no evidence for an H ii region being present, and a star of this luminosity should be able to generate such a region (unlike lower mass Herbig type stars). The relatively low extinction towards the source is consistent with this picture of an ‘evolved’ MYSO.
Intriguingly, the spectrum of V645 Cyg shows red-shifted emission components to the He i, hydrogen recombination and CO lines. The velocity of this redshifted component is remarkably similar to the blueshifted velocities measured in the P Cygni absorption troughs. We therefore conclude that the redshifted features correspond to the hitherto unidentified receding part of the flow. The relative weakness of the emission could be explained by obscuration due to a dense disk or simply dust extinction within the nebula.
The observation of variable CO bandhead emission is not particularly unusual, as Biscaya et al. (1997) found many YSO’s show CO bandhead variability on a range of timescales. The variability of CO bandhead emission is related to the special conditions that are required to produce it. The warm, dense and neutral material that is required to produce CO bandhead emission is generally only found in dense rotating disks or mildly shocked regions. The observation of a high velocity red-shifted component to the CO emission would appear to imply that its emission is related to the stellar wind of the star rather than a rotating disk. This introduces another puzzle, as an 1800kms-1 flow shocking the interstellar medium would most likely destroy any molecular CO. It may be possible that we are witnessing the complex transition zone between the stellar wind and the larger scale molecular outflow. In this case the CO emission should be tied strongly to the strength of the stellar wind, and the existing data do suggest this may be true.
V645 Cyg therefore presents a variety of problems as regards its exact nature. Further observations of the clearly variable wind would be helpful in illuminating some of these. Overall it may represent a relatively rare class of transition objects between a genuinely massive young stellar object and a normal young Oe type star in a weak Hii region.
Acknowledgements.
We would like to thank the referee, Rafael Bachiller, for his helpful comments. UKIRT is operated by the Joint Astronomy Centre on behalf of the UK Particle Physics and Astronomy Research Council (PPARC). The James Clerk Maxwell Telescope is operated by the joint Astronomy Centre on behalf of the Particle Physics and Astronomy Research Council of the United Kingdom, the Netherlands Organisation for Scientific Research and the National Research Council of Canada. The Issac Newton Telescope is operated on the island of La Palma by the Isaac Newton Group in the Spanish Observatorio del Roque de los Muchachos of the Institutio de Astrofisica de Canarias. This publication makes use of data products from the Two Micron All Sky Survey, which is a joint project of the University of Massachusetts and the Infrared Processing and Analysis Center/California Institute of Technology, funded by the National Aeronautics and Space Administration and the National Science Foundation.References
- Biscaya et al. (1997) Biscaya, A.M., Rieke, G.H., Narayanan, G., Luhman, K.L. & Young, E.T. 1997, ApJ, 491, 359
- Brand & Blitz (1993) Brand J., Blitz L., 1993, A&A, 275, 67
- Busfield (2006) Busfield A.L. 2006, PhD Thesis, University of Leeds, U.K.
- Carr (1989) Carr, J.S. 1989, ApJ, 345, 522
- Cohen (1977) Cohen, M. 1977, ApJ, 215, 533
- Cutri et al. (2003) Cutri R.M., Skrutskie M.F., van Dyk S., et al. 2003 2MASS All-Sky Catalog of Point Sources
- Curiel et al (1989) Curiel S., Rodriguez L.F., Canto, J., Bohigas, J., Roth, M., Torrelles, J.M. 1989, Astron. Lett. Comm. 27, 299
- Drew, Bunn and Hoare (1993) Drew J.E., Bunn J.C., Hoare M.G., 1993, MNRAS, 265, 12
- Drew, Proga and Stone (1998) Drew J.E., Proga D., Stone J.M., 1998, MNRAS, 296, L6
- Geballe & Persson (1987) Geballe, T.R., & Persson S.E. 1987, ApJ, 312, 297
- Girart et al (2002) Girart J. M., Curiel S., Rodríguez L.F., Cantó J., 2002, RMxAA, 38, 169
- Goodrich (1986) Goodrich R.W. 1986, ApJ, 311, 882
- Hamann & Persson (1989) Hamann, F., & Persson, S.E. 1989, ApJ, 339, 1078
- Hanson, Conti & Rieke (1996) Hanson M.M., Conti P.S., Rieke M.J. 1996, ApJS 107, 281
- Harvey & Lada (1980) Harvey P.M., & Lada C.J. 1980, ApJ, 237, 61
- Hoare et al. (2004) Hoare, M.G., Lumsden, S.L., Oudmaijer, R.D., Busfield, A.L., King, T.L., & Moore, T.L.J. 2004, ASPC, 317, 156
- Humphreys (1976) Humphreys R. M., 1976, ApJ, 206, 114
- Koornneef (1983) Koornneef J., 1983, A&A, 128, 84
- Lada et al. (1981) Lada, C.J., Blitz, L., Reid, M.J., & Moran, J.M. 1981, ApJ 243, 769
- Lumsden et al. (2002) Lumsden, S.L., Hoare, M.G., Oudmaijer, R.D., Richards, D. 2002, MNRAS, 336, 621
- Lebofsky et al. (1976) Lebofsky, M.J., Kleinmann, S.G., Reike, G.H., & Low, F.J. 1976, ApJ (Letters) 206, L157
- Minchin et al (1991) Minchin N.R., Hough J.H., Burton M.G., Yamashita T., 1991, 251, 522
- Morris & Kazes (1982) Morris, M., Kazes, I., 1982, A&A, 111, 239
- Rodriguez, Torrelles & Moran (1981) Rodriguez, L.F., Torrelles, J.M., & Moran J.M. 1981, ApJ, 86, 1245
- Schulz et al (1989) Schulz, A., Black J.H., Lada C.J., Ulich B.L., Martin R.N., Snell R.L., Erickson N.J., 1989, ApJ, 341, 288
- Skinner, Brown and Stewart (1993) Skinner, S.L., Brown A., Stewart R.T., 1993, ApJSS, 87, 217
- Slysh et al. (1999) Slysh, V.I., Val’tts, E., Kalenskii, S.V, et al. 1999, A&AS, 134, 115
- Verdes-Montenegro et al. (1991) Verdes-Montenegro L., Gomez J.F., Torrelles, J.M., Anglada G., Estallela R., Lopez R., 1991, A&A, 244, 84
- Walker & Price (1975) Walker, R.G. & Price, S.D. 1975, AFCRL Infrared Sky Survey, Vol. 1, AFCRL Enviromental Research Paper, No. 522
- Acke and van den Ancker (2004) Acke B., van den Ancker M. E., 2004, A&A, 426, 151