Consistency of the black hole mass determination in AGN from the reverberation and the X-ray excess variance method
Abstract
Values of black hole masses are frequently determined with the help of the reverberation method. This method requires a specific geometrical factor related to the distribution of the orbits of the Broad Line Region clouds. Onken et al. determined the value from the black hole mass - dispersion relation. In this paper we determine this factor using an independent mass determination from the X-ray variance method for a number of Seyfert 1 galaxies and comparing them with the reverberation results by Peterson et al. We obtain mean value , consistent with Onken et al. Both values are larger than the value 0.75 corresponding to a spherical geometry. It indicates that most probably all values of the black hole masses obtained with the use of the Kaspi et al. formulae should be multiplied by a factor of 1.7. This also shows that the Broad Line Region is rather flat, and hints for a dependence of the factor on a source inclination seem to be present in the data.
keywords:
galaxies:active - galaxies:Seyfert - X-rays:galaxies1 Introduction
The value of the black hole mass is one of the key parameters in the description of the accretion process in an active galactic nucleus (AGN). Much effort was devoted to develop reliable and efficient methods of mass determination from the observational data. Current popular methods include the reverberation mapping (Blandford & McKee 1982; Wandel, Peterson & Malkan 1999; Kaspi et al. 2000; Onken & Peterson 2002; Vestergaard 2002), the stellar and gas kinematics (Kormendy & Richstone 1995; Nelson & Whittle 1995; Ferrarese & Merritt 2000; Gebhardt et al. 2000; Woo & Urry 2002; Tremaine et al 2002; Verolme et al. 2002; Peterson et al. 2004; Onken et al. 2004), determination via water maser emission (Miyoshi et al. 1995; Greenhill et al. 2003), the method based on BH mass – bulge mass or bulge – luminosity relation (Magorrian et al. 1998; Kormendy & Gebhardt 2001; McLure & Dunlop 2002; Häring & Rix 2004), based on the disk luminosity estimation (Tripp, Bechtold & Green 1994; Collin et al. 2002) or just the line analysis (Green & Ho 2005). These methods were recently supplemented by the methods based on X-ray variability: power spectrum break (Papadakis 2004; McHardy et al. 2005) and excess variance (Nikolajuk et al. 2004; O’Neill et al. 2005).
Each of the methods require the knowledge of a certain normalization factor, and is biased by some systematic errors, so the comparison of two independent methods is extremely important.
In the present paper we compare the results of the reverberation approach with the results of the X-ray excess variance for several Seyfert 1 galaxies. The methods of mass determination and the approach to their comparison is given in Section 2, the results for mean normalization factors and the dependence on the source inclination are shown in Section 3, and we discuss the results in Section 4.
2 Method
2.1 Selected sample of Seyfert galaxies
We consider a sample of Seyfert 1 galaxies which were both a subject of optical and X-ray monitoring (see Table 1). We do not include Narrow Line Seyfert 1 galaxies since there are many indications of peculiar properties of these sources in comparison to normal Seyfert 1 objects (smaller black hole mass to bulge mass ratio, Wandel 1999; Mathur, Kuraszkiewicz & Czerny 2001, higher variability amplitude, Bian & Zhao 2003; Nikolajuk, Papadakis & Czerny 2004; Markowitz & Edelson 2004). In particular, we do not include NGC 4395 since it might be a NLS1 galaxy (FWHM of H line 1500 km s-1; Kraemer et al. 1999). This leaves us with 13 sources with black hole masses in the range .
We use the reverberation results of Peterson et al. (2004) since they are based on the most advanced analysis of the line profiles. Most of the X-ray variability data were taken from RXTE and ASCA databases (see Nikolajuk et al. 2004). For F9 we take the excess variances and the durations of all 7 observations from Turner et al. (1999). Turner et al. give both the full duration of the observation and the effective time actually covered by the data. We use the full duration as since gaps in the data affect less the variance than the extension of the monitoring. This is related to the steep power spectrum and the dominance of the lower frequencies in variability.
Measurements of the inclination angles of the sources were taken mostly from Nandra et al. (1997b). For IC 4329A, NGC 5548 and NGC 4593 we took inclinations from Mushotzky et al. (1995) and Guainazzi et al. (1999), correspondingly. These measurements are based on the shape of the iron Fe K line. For 3C 120 and 3C 390.3 we adopted the values estimated by Eracleous & Halpern (1998) and Ballantyne et al. (2004) from observations of radio jets.
2.2 Black hole mass from the reverberation method
Reverberation method allowed to measure the mass directly in several Seyfert galaxies (Wandel et al. 1999; Kaspi et al. 2000). The basic formula underlying the reverberation method reads
| (1) |
where is the black hole mass, – the gravitational constant, – the radius of the Broad Line Region, – the Full Width Half Maximum (FWHM) of line and is the squared geometrical factor describing the distribution of the orbits of Broad Line Region (hereafter BLR) clouds. In a recent more sophisticated approach of Peterson et al. (2004) to the line profile analysis the was replaced with the dispersion :
| (2) |
where is the centroid of the cross-correlation function, is the light velocity. In the sample of Peterson et al. statistically there is a relation between the two factors
| (3) |
Onken et al. (2004) determined the scaling coefficient in equation (2) from the correlation between the black hole mass and the bulge/spheroid stellar velocity dispersion. Their value of was adopted by Peterson et al. (2004). We use their results in our inclination-independent approach. In this approach there is no space for any anisotropy of the BLR.
However, BLR is unlikely to be spherically symmetric (e.g. Done & Krolik 1996; Krolik 2001, Collin & Kawaguchi 2004). Most plausible geometry, particularly for the Low Ionization Line Region, is a disk-like wind (Collin-Souffrin et al. 1986; Chiang & Murray 1996; Hutchings et al. 2001; Kollatschny 2003). Unfortunately, the theoretical predictions of the shape of an emission line is quite sensitive to the assumptions about the optical depth of the wind and the distribution of the emissivity (Murray & Chiang 1997).
Therefore, we consider, as a possibility, that the BLR velocity may be represented by a combination of a random isotropic component, , and a component only in plane of the disc, (Wills & Browne 1986; McLure & Dunlop 2001). Therefore, the masses of the black hole in AGNs can be represented by
| (4) |
where . It differs by a factor of two in front of from the formula of Krolik (2001) and of Collin & Kawaguchi (2004).
This relation means that is not an inclination-independent coefficient but
| (5) |
If , the value determined by Onken et al. (2004) corresponds to a representative inclination angle .
The use of this formula requires the knowledge of and for every object separately, and the exact dependence on the inclination angle is not well justified. However, it is useful for search of any possible traces of anisotropy.
2.3 Black hole mass from the X-ray variability
| Name | Type | (ref.) | |||||||||
|---|---|---|---|---|---|---|---|---|---|---|---|
| () | () | (eV) | (deg) | (deg) | (deg) | ||||||
| 3C 120 | S1.5 | 43.95† | 1.79 | 70 | (1,2) | ||||||
| 3C 390.3 | S1.5 | 44.20† | (2) | ||||||||
| Ark 120 | S1.0 | 43.88 | |||||||||
| IC 4329A | S1.2 | 43.59 | 1.70 | 80 | (3) | ||||||
| Mrk 509 | S1.5 | 44.03 | 1.76 | 70 | |||||||
| NGC 3227 | S1.5 | 41.66 | 1.52 | 120 | |||||||
| NGC 3516 | S1.5 | 43.08 | 1.74 | 90 | |||||||
| NGC 3783 | S1.5 | 42.90 | 1.54 | 115 | |||||||
| NGC 4151 | S1.5 | 42.62 | 1.55 | 100 | |||||||
| NGC 4593 | S1.0 | 42.98 | 1.78 | 90 | (4) | ||||||
| NGC 5548 | S1.5 | 43.41 | 1.75 | 90 | (3) | ||||||
| NGC 7469 | S1.5 | 43.25 | 1.78 | 130 | |||||||
| F 9 | S1.2 | 43.91 | 1.83 | 120 |
Col. (1) lists the object name and type (S1.0-S1.5 denote Seyferts galaxies). Col. (3) shows the masses of black holes obtained from reverberation method by Peterson et al. (2004), who take the geometrical factor . Col. (4) shows the black holes masses obtained from the variance method. The ratios of the two masses are given in Col. (5). Col. (6) Log of 2-10 keV luminosity in units of erg s-1. All luminosities are given for: km s-1 and . The values with the superscript † were taken from Green et al. (1993) and transformed to this cosmology. The other values were directly taken from O’Neill et al. (2005). In Col. (7) and (8) are power-law index and equivalent width of Fe K line, respectively. All values were taken from Nandra et al. (1997b). Col. (9) shows the inclination angles given by Nandra et al. (1997b). Col. (10) shows the same quantity but taken from other papers. The superscripts (a) and (b) in Col. (10) denote inclination obtained from observation of the Fe K line and the radio jet correspondingly. The numbers in parentheses correspond to the following references: (1) Ballantyne et al. (2004), (2) Eracleous & Halpern (1998), (3) Mushotzky et al. (1995), (4) Guainazzi et al. (1999). Col. (11) shows the inclination angle calculated from equation (12) under the assumptions .
We determine the black hole mass using the excess variance method. The method is based on assumptions that (i) the high frequency tail of the power spectrum has a slope of -2 (ii) the high frequency break scales inversely with the black hole mass (iii) the value of the power times frequency at the high frequency break is universal for all objects, independent from mass. In this paper we improve slightly this method, in comparison to the method described by Nikolajuk et al. (2004). We change: (i) the method of obtaining the final value of for a given object from results for individual lightcurves (ii) the method of calculation of the errors (iii) the value of the normalization constant present in our method.
The X-ray variance method (Nikolajuk et al. 2004) is based on the scaling of the normalized variance of X-ray light curves, , with black hole mass
| (6) |
Here is the duration of a single X-ray light curve in seconds and is its bin size in seconds, as well. is in units of (rms/mean)2. cannot be longer than the time scale defined by the high frequency break of the power spectrum. Longer light curves can be chopped and used to determine several independent values of the variance. The normalized excess variance, , is defined as in Nandra et al. (1997a) and Turner et al. (1999).
From each light curve of a given object we obtain the th individual black hole masses , using equation (6). In order to calculate the final value of from several lightcurves, we fit this set of individual . For each lightcurve we calculate the coefficient
| (7) |
and the final coefficient is calculated as a weighted mean from the values of , with the weight coefficient given by , i.e.
| (8) |
Here and are results from several measurements. The number of the lightcurves is .
The final black hole mass in the object is derived directly from the obtained value of and equation (6)
| (9) |
The value of the constant in equation (6) must be determined by applying the method to the source with a known mass. Cyg X-1 was selected as a reference in the work of Nikolajuk et al. (2004). The mass of the black hole in Cyg X-1 was assumed to be 10 M⊙ and the value of the constant M⊙ s-1 was derived. However, recent careful study of the evolutionary history of this binary star showed that the most likely value for the mass of the black hole in the system is M⊙. Therefore, we assume 20 M⊙ as the best estimate of the black hole mass in Cyg X-1, and the constant in equation (6) is consequently two times higher: M⊙ s-1. The error of this value is predominantly connected with uncertainty of the Cyg X-1 black hole mass.
The accuracy of the black hole mass determination in the X-ray variability method depends strongly on the effect of statistical error of variance measurement and power leaking from long timescales. Therefore, in our analysis we estimate the error by performing Monte Carlo simulations for each source separately. A few hundred sets of artificial data were generated for each of the sources, using the Timmer & König (1995) algorithm, exponent of the lightcurve was calculated to account for the log-normal distribution (see Uttley, McHardy & Vaughan 2005), and each set was analyzed like the data, thus giving a distribution of the values of , so its error was determined from the dispersion of the resulting distribution. The mass error was determined from the error of .
The error in the normalization constant was discussed separately since the results of Peterson et al. (2004) also did not include the coefficient error.
2.4 Comparison of the two methods and search for inclination effects
Assuming the absence of any inclination-dependent trend in BLR by calculating the ratio of the two mass measurements for all objects in our sample separately:
| (10) |
where is the black hole mass measured by the excess variance method and is taken from Peterson et al. (2004). We next calculate the mean and the median values from the obtained distribution. If the obtained mean value is consistent with 1 within observational error, the two methods statistically give consistent results.
Next we allow for an anisotropy of the BLR. We assume that the excess variance method is independent on the source inclination but for the reverberation results we adopt the coefficient given by equation (5) instead of a fixed factor of 5.5. Under this assumption the ratio of the two measurements should follow a relation
| (11) |
We check the possible presence of such trend using an independent measurements of the sources inclinations (see Section 2.1).
We also show the results of a complementary approach, following the general method of Wu & Han (2001). We adopt the relation given by equation (11), we determine the inclination angle of each object from the formula
| (12) |
and we compare them to independent measurements of the inclination. Errors of the calculated inclination angle are based on the error propagation theory (Bevington & Robinson, 1969).
3 Results
3.1 Mass measurements
The values of the black hole masses, , determined by Peterson et al. (2004) with are given in the third column of Table 1. In fourth column we give the masses determined with the excess variance method, as described in Section 2.3. Generally, the two measurements correlate quite nicely, as shown in Fig. 1 and Fig. 2.
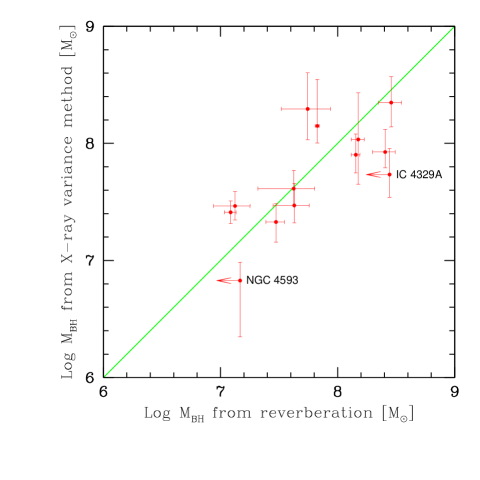
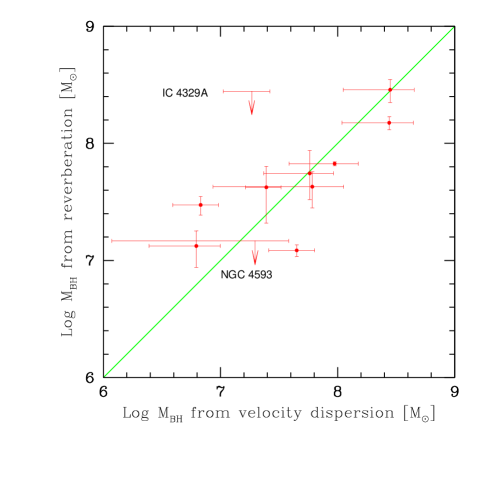
Statistical measurement errors are usually smaller in the case of reverberation method. On the other hand, in two cases (IC 4329A and NGC 4593) reverberation method gave only upper limits while the excess variance method gave both the upper and lower limits, consistent within two sigma error with the results from the velocity dispersion method.
In fifth column of Table 1 we give the mass ratio . The distribution shows significant scatter, with the minimum value obtained for Fairall 9 and the maximum value obtained for 3C 120. Therefore, we calculate the mean and the median value. In calculations of the weighted mean we exclude IC 4329A and NGC 4593, because of the upper limits in the determination of from those galaxies. The weighted mean is equal to . The given error is only statistical one sigma error. This indicates that both methods are normalized rather accurately and there is no strong need to introduce the systematic errors due to and constants. This is very encouraging since the level of disagreement is much lower than allowed for by systematic errors entering the two methods as errors of the normalization constants: and M⊙ s-1. It also means that indeed statistical errors are likely to be dominating individual measurements in both methods.
No apparent trend with the black hole mass is present, so probably no large systematic error related to the black hole mass is involved.
3.2 Search for BLR anisotropy
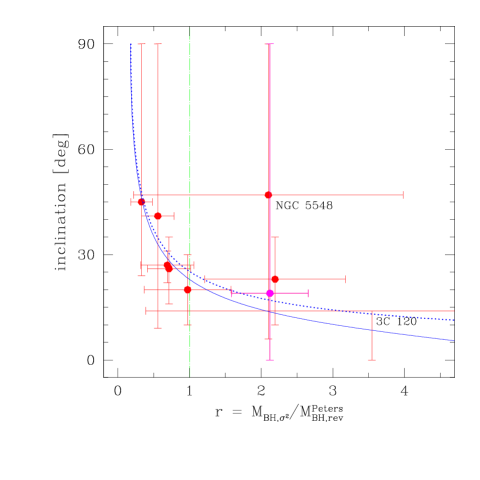
If the BLR is anisotropic this anisotropy is likely to show up in a different way in the two black hole mass measurement methods. Therefore, in Fig. 3 we show the relation between the mass ratio, , and the inclination angles measured independently (see Section 2.1). Errors are large but the two quantities seem to be correlated: larger mass measurement ratios are more likely to be derived for lower source inclination. The Spearman rank correlation test for all ten pairs does not confirm this impression (). However, if the inclination angle of NGC 5548 (47∘) from Nandra et al. (1997b) is replaced with the value of 26.5∘ (mean value from Mushotzky et al. 1995, see column (10) of Table 1, also from the iron line profile), the presence of the correlation is confirmed (). Without this object, the correlation is excellent ().
In order to investigate an importance of our correlation we check up if the mass ratio correlated with power law index, , or with line equivalent width, . We take the appropriate values in Nandra et al. (1997b), and we include them in Table 1. If we do not find any correlation between and and/or between and then our correlation, the mass ratio-inclination angles, is more believable. For the sample of our objects we do the Spearman rank correlation test and in both cases we do not confirm any correlation. In the case of - a Spearman Correlation Coefficient . In the second case, where we test - once again the coefficient does not show any correlation ().
Uttley and McHardy (2005), McHardy et al. (2005) have suggested that the deviation from linear scaling between the high frequency break and may by a function of accretion rate. In order to check this hypothesis and its possible influence to our mass estimation, , we examine a new correlation. We check whether correlate with the ratio (i.e. the ratio of 2-10 keV luminosities divided by ). We use sample of eleven objects (all those objects, which have calculated ) and find an appropriate values of in papers of O’Neill et al. (2005) and Green et al. (1993). The cosmological parameters which we use are: km s-1 and . The Spearman Correlation Coefficient , which we obtained, is equal to -0.54. We can say that probably slightly anticorrelates with the ratio . Nevertheless, it is difficult clearly confirm this hypothesis, because only (for the sample of 11th pairs) indicates the presence of the correlation at the 95% level of confidence.
Assuming a BLR model outlined in Section 2.4 we expect the inclinations to follow the equation (12). Since in equation (12) is unknown, we attempted to determine it from the requirement of the best fit to the data. We searched for a minimum of the function:
| (13) |
where included both the measurement error of the inclination angle (given in Table 1) and the error in prediction of from equation (12) due to an error in the measurement of . Resulting is lowest for but the errors are so large that is also acceptable. We show both fits to the data in Fig. 3.
One object (3C 120) shows significant departure from the overall mean. High value of the is likely to be due to an extreme value of the viewing angle. Small inclination angle decreases the line widths (see equation 5). 3C 120 is most probably viewed face on since it shows superluminal motion (e.g. Homan et al. 2001).
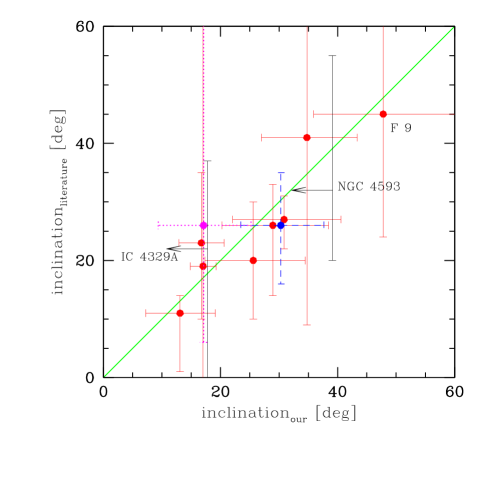
In Fig. 4 we compare the determination of the inclination from equation (12) (Table 1, last column) with the results (mostly) from the shape of the iron line (see Section 2.1). The agreement between the two methods is encouraging. It both supports the existence of the anisotropic part in the velocity field of BLR and the correctness of the inclination determination by Nandra et al. (1997b). Recent results from XMM-Newton telescope frequently do not support the existence of the broad relativistically smeared iron line (e.g. Mkn 509, Page et al. 2003; NGC 3227, Gondoin et al. 2003; NGC 4151, Schurch et al. 2003; NGC 5548, Pounds et al. 2003; NGC 3783, Reeves et al. 2004; NGC 4593, Reynolds et al. 2004; NGC 3516, Turner et al. 2005). It is possible that high quality data is sensitive to the departures of the actual line from the fitted shape and reject the presence of such feature. This departure may be, for example, related to the warm absorber effect since narrow absorption features superimposed onto a broad line modify the shape of the line making it more symmetric, almost two-Gaussian (Różańska et al. 2006).
We were also able to determine the inclination for Ark 120 (no previous inclination measurements were done for this object). Measured value is quite reasonable for a Seyfert 1 galaxy. It will be interesting to see whether future independent determinations will confirm our result.
4 Discussion
4.1 Consistency of black hole mass measurement methods
We compare two methods of black hole mass determination: reverberation method and X-ray excess variance method. Both methods include important scaling factors.
Reverberation method is based on determination of the width of the broad lines and the delay in their response to variable continuum. It requires an assumption about the BLR geometry, in a form of a specific value of the geometrical factor. Onken et al. (2004) obtained this factor by using the black hole mass measurements derived from the velocity dispersion measurements. This factor was used by Peterson et al. (2004) for the reverberation measurements used in our paper.
Excess variance method is based on a scaling of the X-ray power spectra with black hole mass. It requires an a priori knowledge of black hole mass in a reference object. It is convenient to use the Galactic X-ray source Cyg X-1 in its hard state to scale the method. The best current determination of the black hole mass in this object is (Ziółkowski 2005), and we adopt this value in the present analysis.
We also attempted to use another Galactic source, GX 339-4, as a reference. We have extracted power spectra from the hard state during the rise of the 2002/2003 outburst (observations 0–24 from Belloni et al. 2005) from the PCA onboard RXTE. We have corrected the spectra for the Poisson noise and dead time effects of the instrument. Then, we integrated them between 10 and 128 Hz in order to determine the constant . We have assumed the mass of 10 M⊙ (Zdziarski et al. 2004) and found M⊙ s-1, by averaging over all observations. It is interesting to note that the value of for individual observations remained roughly constant throughout the wide range of observed luminosities (count rate 400–900 per one PCA detector). The resulting constant is less than the value of M⊙ s-1, found in Section 2.3, but uncertainties due to mass estimation are large. In particular, the mass of GX 339–4 is not known very well, with only the lower limit from the mass function, (Hynes et al. 2003), firmly established. Higher mass would give higher . We conclude that the value of constant if likely to be between 1 and 2, though finding its more exact value would require thorough investigation of many X-ray binary sources. We plan to do this in the forthcoming paper.
We showed that the two methods of black hole mass determination, with the scaling adopted as described, are statistically in agreement. The mean value of the mass ratios is (one sigma error), consistent with 1. Recent determination of the black hole mass in NGC 4151 ( M⊙) by Metzroth, Onken, Peterson (2006), based on reverberation, agrees even better with our values (based on excess variance) than the value given by Peterson et al. (2004) quoted in Table 1. This means that normalization factors used by the two methods were determined correctly, and their corresponding errors are perhaps even smaller than the conservatively estimated error. Therefore, black hole masses can be measured rather accurately, using any of the two methods if the requested data for an object is of appropriate quality.
4.2 Mean geometrical factor
Since more discussions in the literature usually concerned the squared geometrical factor , as introduced in equation (1), we convert for convenience the discussed results . The normalization obtained by Onken et al. (2004) corresponds to . Our results from the X-ray excess variance method gave slightly lower values of the black hole masses so they effectively correspond to (median value) and 1.12 0.20 (weighted mean). However, recently Collin et al. (2006) have obtained from the reverberation method.
Kaspi et al. (2000) use equation (1) and adopt the value corresponding to a isotropic distribution of randomly oriented orbits (Netzer 1990). They also show that a convenient scaling exists between the continuum luminosity at Å which is produced in accretion disc and the size of the BLR, . This scaling was used later in many papers (e.g. Woo & Urry 2002; Willot, McLure & Jarvis 2003, Wu et al. 2004, Warner, Hamann & Dietrich 2004, Czerny, Różańska & Kuraszkiewicz 2004) for estimation of the black hole mass without a need for time-consuming monitoring. Again, the factor was assumed.
Results based on the excess variance support the conclusion of Onken et al. (2004) that is certainly too low, and the appropriate value is by a factor higher than that.
This will increase black hole masses derived with the use of Kaspi et al. (2000) formulae, and in consequence it will decrease the estimated value of the Eddington ratio. It will (at least partially) reduce the problem of the highly super-Eddington accretion rates in some quasars (Collin et al. 2002).
Normalization higher by a factor of 2 than in the original formula of Kaspi et al. (2000) also leeds to estimates of the quasar radiation efficiency in better agreement with the timescales of the black hole growth (Wang et at. 2006).
4.3 Broad Line Region Geometry
Attempts of the direct determination of the BLR geometry from the reverberation studies of the line profiles in NGC 5548 (Done & Krolik 1996) showed that none of the simple models reproduced the velocity field of the clouds. It is possible that the Keplerian motion dominates but the disk clumpiness is responsible for the observed complexity of the picture (Shapovalova et al. 2004).
Our weighted mean value of thus can be inverted into a mean value of the inclination angle, , as done by Wu & Han (2001). If we neglect the random/wind component of the velocity (i.e. for ), mean value of corresponds to the inclination angle , and the median value of is equivalent to . Both values are reasonable, taking into account that large viewing angles are obscured by the dusty/molecular torus and active nuclei with large inclinations are classified as type 2 objects.
5 Conclusions
-
•
We determine the squared geometrical factor present in the reverberation method using black hole masses determined from X-ray variance method as a reference. Our value of the geometrical factor, 1.12, is consistent with the value 1.37 obtained by Onken et al. (2004) from the black hole mass - stellar dispersion relation, and applied by Peterson et al. (2004), and in agreement with of Colin et al. (2006). Such values are intermediate between the expected values for a spherical and a flat geometry of the BLR.
-
•
The values of the black hole masses given by the formulae of Kaspi et al. (2000) are most probably systematically underestimated by a factor of 1.7-1.8.
-
•
complementary use of the reverberation and excess variance methods is a promising tool to constrain the inclination of an AGN
Acknowledgments
We would like to thank Andrzej Sołtan for helpful comments and useful discussions. Part of this work was supported by grants 1P03D00829 and PBZ-KBN-054/P03/2001 of the Polish State Committee for Scientific Research.
References
- [] Ballantyne D. R., Fabian A. C., Iwasawa K., 2004, MNRAS, 354, 839
- [] Belloni T., Homan J., Casella P., van der Klis M., Nespoli E., Lewin W. H. G., Miller J. M., Méndez M., 2005, A&A, 440, 207
- [] Bevington P. R., Robinson D. K., 1969, Data Reduction and Error Analysis for The Physical Sciences, (2nd ed.; New York: McGraw-Hill)
- [] Bian W., Zhao Y., 2003, MNRAS, 343, 164
- [] Blandford R. D., McKee C.F., 1982, ApJ, 255, 419
- [] Chiang J., Murray N., 1996, ApJ, 466, 704
- [] Collin S.. Boisson C., Mouchet M., Dumont A.-M., Coupé S., Porquet D., Rokaki, E., 2002, A&A, 388, 771
- [] Collin S., Kawaguchi T., 2004, A&A, 426, 797
- [] Collin S., Kawaguchi T., Peterson B. M., Vestergaard M. 2006, preprint (astro-ph/0603460)
- [] Collin-Souffrin S., Joly M., Pequinot D., Dumont A.-M., 1986, A&A, 166, 27
- [] Czerny B., Różańska A., Kuraszkiewicz J., 2004, A&A, 428, 39
- [] Done C., Krolik J.H., 1996, ApJ, 463, 144
- [] Eracleous M., Halpern J. P., 1998, ApJ, 505, 577
- [] Ferrarese L., Merritt D., 2000, ApJL, 539, L9
- [] Gebhardt K., et al. 2000, ApJL, 539, L13
- [] Gondoin P., Orr A., Lumb D., Siddiqui H., 2003, A&A, 397, 883
- [] Green J. E., Ho L. C., 2005, preprint (astro-ph/0508335)
- [] Green A. R., McHardy I. M., Lehto H. J., 1993, MNRAS, 265, 664
- [] Greenhill L. J., Kondratko P. T., Lovell J. E. J., Kuiper T. B. H., Moran J. M., Jauncey D. L., Baines, G. P., 2003, ApJ, 582, L11
- [] Guainazzi M., Perola G. C., Matt G., Nicastro F., Bassani L., Fiore F., dal Fiume D., Piro, L., 1999, A&A, 346, 407
- [] Häring N., Rix H., 2004, ApJL, 604, L89
- [] Homan D. C., Ojha R., Wardle J. F. C., Roberts D. H., Aller M. F., Aller H. D., Hughes P. A., 2001, ApJ, 549, 840
- [] Hutchings J. B., Kriss G. A., Green R. F., Brotherton M., Kaiser M. E., Koratkar A. P., Zheng, W., 2001, ApJ, 559, 173
- [] Hynes R. I., Charles P. A., Casares J., Haswell C. A., Zurita C., Shahbaz T., 2003, MNRAS, 340, 447
- [] Kaspi S., Smith P. S., Netzer H., Maoz D., Jannuzi B. T., Giveon U., 2000, ApJ, 533, 631
- [] Kollatschny W., 2003, A&A, 407, 461
- [] Kormendy J., Gebhardt K., 2001, in AIP Conf. Proc. 586: 20th Texas Symposium on relativistic astrophysics, Edited by J. C. Wheeler and H. Martel, p. 363
- [] Kormendy J., Richstone D., 1995, ARA&A, 33, 581
- [] Kraemer S. B., Ho L. C., Crenshaw D. M., Shields J. C., Filippenko A. V., 1999, ApJ, 520, 564
- [] Krolik J.H., 2001, ApJ, 551, 72
- [] Magorrian J., Tremaine S., Richstone D., 1998, AJ, 115, 2285
- [] Markowitz A., Edelson R., 2004, ApJ, 617, 939
- [] Mathur S., Kuraszkiewicz J., Czerny B., 2001, NewA, 6, 321
- [] McHardy I. M., Gunn F.K., Uttley P., Goad M. R., 2005, MNRAS, 359, 1469
- [] McLure R. J., Dunlop S. J., 2001, MNRAS, 327, 199
- [] McLure R. J., Dunlop S. J., 2002, MNRAS, 331, 795
- [] Metzroth K. G., Onken C. A., Peterson B. M., 2006, preprint (astro-ph/0605038)
- [] Miyoshi M., Moran J., Herrnstein J., Greenhill L., Nakai N., Diamond P.,Inoue M., 1995, Nature, 373, 127
- [] Murray N., Chiang J., 1997, ApJ, 474, 91
- [] Mushotzky R. F., Fabian A. C., Iwasawa K., Kunieda H., Matsuoka M., Nandra K., Tanaka Y., 1995, MNRAS, 272, L9
- [] Nandra K., George I. M., Mushotzky R. F., Turner T. J., Yaqoob T., 1997a, ApJ, 476, 70
- [] Nandra K., George I. M., Mushotzky R. F., Turner T. J., Yaqoob T., 1997b, ApJ, 477, 602
- [] Nelson C. H., Whittle M., 1995, ApJS, 99, 67
- [] Netzer H., 1990, in Active Galactic Nuclei, ed. T. J.-L. Courvoisier & M. Major (Berlin: Springer), 57
- [] Nikolajuk M., Papadakis I. E., Czerny B., 2004, MNRAS, 350, L26
- [] O’Neill P. M., Nandra K., Papadakis I. E., Turner T. J., 2005, MNRAS, 358, 1405
- [] Onken C. A., Peterson B. M., 2002, ApJ, 572, 746
- [] Onken C. A., Ferrarese L., Merritt D., Peterson B. M., Pogge R. W., Vestergaard M., Wandel, 2004, ApJ, 615, 645
- [] Page M. J., Davis S. W., Salvi N. J., 2003, MNRAS, 343, 1241
- [] Papadakis I. E., 2004, A&A, 425, 1133
- [] Peterson B. M., et al. 2004, ApJ, 613, 682
- [] Pounds K. A., Reeves J. N., Page K. L., Edelson R., Matt G., Perola G. C., 2003, MNRAS, 341, 953
- [] Reeves J. N., Nandra K., George I. M., Pounds K. A., Turner T. J., Yaqoob T., 2004, ApJ, 602, 648
- [] Reynolds Ch. S., Brenneman L. W., Wilms J., Kaiser M. E., 2004, MNRAS, 352, 205
- [] Różańska A., Goosmann R., Dumont A.-M., Czerny B., 2006, A&A, 452, 1
- [] Schurch, N. J., Warwick R. S., Griffiths R. E., Sembay S., 2003, MNRAS, 345, 423
- [] Shapovalova A. I., et al., 2004, A&A, 422, 925
- [] Timer J., König M., 1995, A&A, 300, 707
- [] Tremaine S., et al. 2002, ApJ, 574, 740
- [] Tripp T. M., Bechtold J., Green R. F., 1994, ApJ, 433, 533
- [] Turner T.J., George I. M., Nandra K., Turcan D., 1999, ApJ, 524, 667
- [] Turner T. J., Kraemer S. B., George I. M., Reeves J. N., Bottorff M. C., 2005, ApJ, 618, 155
- [] Uttley P., McHardy I. M., 2005, MNRAS, 363, 586
- [] Uttley P., McHardy I. M., Vaughan S., 2005, MNRAS, 359, 345
- [] Verolme E. K., et al., 2002, MNRAS, 335, 517
- [] Vestergaard M., 2002, ApJ, 571, 733
- [] Wang J.-M., Chen Y.-M., Ho L. C., McLure R. J., 2006, ApJ, 642, 111
- [] Wandel A., 1999, ApJL, 519, L39
- [] Wandel A., Peterson B. M., Malkan M. A., 1999, ApJ, 526, 579
- [] Warner C., Hamann F., Dietrich M., 2004, ApJ, 608, 136
- [] Willot C. J., McLure R. J., Jarvis M. J., 2003, ApJ, 587, L15
- [] Wills B. J., Browne I. W. A., 1986, ApJ, 302, 56
- [] Woo J.-H., Urry C. M., 2002, ApJ, 579, 530
- [] Wu X.-B., Han J. L, 2001, ApJ, 561, L59
- [] Wu X.-B., Wang R., Kong M. Z., Liu F. K., Han J. L., 2004, A&A, 424, 793
- [] Zdziarski A. A., Gierliński M., Mikołajewska J., Wardziński G., Smith D. M., et al., 2004, MNRAS, 351, 791
- [] Ziółkowski J., 2005, MNRAS, 358,851
This paper has been processed by the authors using the Blackwell Scientific Publications LaTeX style file.