Super-Solar Super Lyman Limit Systems
Abstract
We present abundance measurements for two super Lyman Limit systems (SLLS; quasar absorption line systems with ) selected from a set of metal-strong absorbers in the Sloan Digital Sky Survey quasar database. After applying estimate corrections for photoionization effects, we derive gas-phase metallicities of M/H= dex for the SLLS at toward SDSS0927+5621 and M/H= dex for the SLLS at toward SDSS0953+5230. The former exhibits among the highest gas metallicity of any astrophysical environment and its total metal surface density exceeds that of nearly every known damped Ly system. The properties of these absorbers – high metallicity and large velocity width () – resemble those of gas observed in absorption in the spectra of bright, star-forming galaxies at high redshift. We discuss the metal mass density of the SLLS based on these observations and our ongoing SLLS survey and argue that a conservative estimate to the total metal budget at is greater than of the total, suggesting that the metal-rich LLS may represent the dominant metal reservoir in the young universe.
Submitted to ApJL; Revised June 22 2006
1 Introduction
With the recent successes of high redshift galaxy surveys, the star formation history of the young universe is revealing itself (Madau et al., 1996; Giavalisco et al., 2004). Although debate continues on various aspects of the measurements (e.g. dust extinction, sample selection, sample variance), it is evident that the star formation rate at was substantially higher than the current epoch. Accordingly, the massive stars which light up these galaxies must have produced copious metals and redistributed them via supernovae to the galaxy and surrounding medium. A valuable test of this picture, therefore, is to obtain an accurate census of metals at and compare against the amount predicted by the integrated the star formation history (Pagel, 2002; Pettini, 2004; Bouché, Lehnert & Péroux, 2005). In the following, we will adopt a metal mass density at of based on the work of Bouché, Lehnert & Péroux (2006).
Prior to these galaxy surveys, analysis of heavy metals in quasar absorption line (QAL) systems – the gas within and in between high galaxies – demonstrated that star formation was ubiquitous at (Tytler et al., 1995; Wolfe et al., 1994; Pettini et al., 1994). Metals are present in excess of the primordial value throughout much of the universe (Schaye et al., 2003; Simcoe, Sargent & Rauch, 2004; Bergeron & Herbert-Fort, 2005) and a direct census of the intergalactic medium (IGM) adds up to of (Pettini, 2004; Schaye et al., 2003). Regarding the interstellar medium of galaxies, the damped Ly systems (QAL systems with ) offer the most direct means of measurement (Pettini et al., 1994; Prochaska et al., 2003). Surveys of these absorption systems have demonstrated that the metals associated with H I gas in DLAs contribute as comparable a fraction as the IGM probed through the Ly forest. The metals in stars can be estimated from the luminosity functions and metallicity estimates of galaxy surveys; Bouché, Lehnert & Péroux (2006) estimates this contributiotn to be at . Altogether the census of metals in the IGM, the ISM probed by DLA, and stars falls short by as much as 70% of .
At present, there are several suggested explanations for this discrepancy. These include: (1) a significant portion of the metals are within dusty neutral gas (possibly molecular) which obscures any background quasar avoiding detection (Fall & Pei, 1993; Vladilo & Péroux, 2005), (2) a significant fraction of metals are sequestered within a hot, diffuse, collisionally ionized gas, which is difficult to probe with rest-frame ultraviolet transitions (Ferrara, Scannapieco & Bergeron, 2005), (3) metals (primarily O VI) are locked in warm–hot gas (Simcoe, Sargent & Rauch, 2002), or (4) metals are located in high metallicity “feedback” systems (Simcoe et al., 2006). All of these phases are certain to contribute, some to a larger extent than others, and it is possible that a complete solution will include significant contributions from each.
In this paper, we wish to highlight another reservoir of metals: highly photoionized, yet optically thick absorption systems. Specifically, we wish to examine the possible contribution from the Lyman Limit systems (LLS; absorbers with and restricted here to have ), the heretofore neglected sibling of the QAL systems. While the intergalactic medium examines gas arising in regions with overdensity and the damped Ly systems describe gas in overdense () galactic regions, the LLS are likely to represent the interface between dense galactic and tenuous intergalactic gas. It is reasonable to speculate that these absorbers probe gas related to galactic feedback processes and could therefore be a significant metal reservoir. The IGM and DLA systems have been surveyed extensively for metals (Schaye et al., 2003; Simcoe, Sargent & Rauch, 2004; Prochaska et al., 2003) but analysis of the LLS has been limited to a few systems (Prochaska, 1999; Prochaska & Burles, 1999) and a small survey of super Lyman limit systems (SLLS), systems with (Dessauges-Zavadsky et al., 2003; Péroux et al., 2003, 2005). Because even the SLLS outnumber DLA by approximately a factor of four, the LLS could easily contribute a significantly larger metal mass than the DLA.
To make a direct comparison, one must consider the frequency distribution, ionization state, and mean metallicity of the LLS, all of which are poorly constrained. In this Letter, we will consider the current constraints and highlight the prospective importance of the SLLS. Péroux et al. (2006) have recently presented measurements on a low redshift SLLS which shows a super-solar metallicity111One notes that Rao, Turnshek & Nestor (2006) measured this absorber to have and therefore identified it as a DLA system. Our analysis of the HST/STIS spectra gives . and the authors proposed that similar absorbers at high redshift could contain an important fraction of the metal budget. Here, we report on two super-solar SLLS at drawn from our survey of metal-strong DLA candidates (Herbert-Fort et al., 2006) and an on-going survey of LLS. The more extreme of the two systems exhibits greater than 5 times solar metallicity and has a metal surface density which matches all of the DLA with metallicity measurements at to 2.2. We will argue that the LLS are likely to account for at least of the metal budget at high redshift and possibly the remainder of ‘missing’ metals.
2 Observations and Chemical Abundances
Herbert-Fort et al. (2006) have recently published a survey for QAL systems
with very large metal-line column densities (termed metal-strong DLA
candidates) from the
Sloan Digital Sky Survey database (Abazajian et al., 2005).
The overwhelming majority of these absorbers are metal-strong
damped Ly systems (MSDLA), yet follow-up observations have revealed
that a small fraction have .
Two examples include the SLLS at toward quasars
SDSSJ0927+5621 and
SDSSJ0953+5230 (hereafter, SLLS0927+5621 and
SLLS0953+5230).
We observed the quasars SDSSJ0927+5621 and
SDSSJ0953+5230 on UT 13 April 2005
and 17 March, 2005 for total exposure times of 7200s and 8400s
respectively with the upgraded HIRES spectrometer
(Vogt et al., 1994) on the Keck I telescope. In each case, we
employed the C5 decker ( wide) giving a
FWHM resolution and chose a cross-disperser angle which
gave wavelength coverage Å.
We reduced the 2D images with the HIRES Redux
pipeline222http://www.ucolick.org/xavier/HIRedux/index.html
and extracted, coadded and normalized the 1D spectrum with the software.
The spectra have a signal-to-noise ratio of per 2.6km s-1 pixel
at 3400Å.
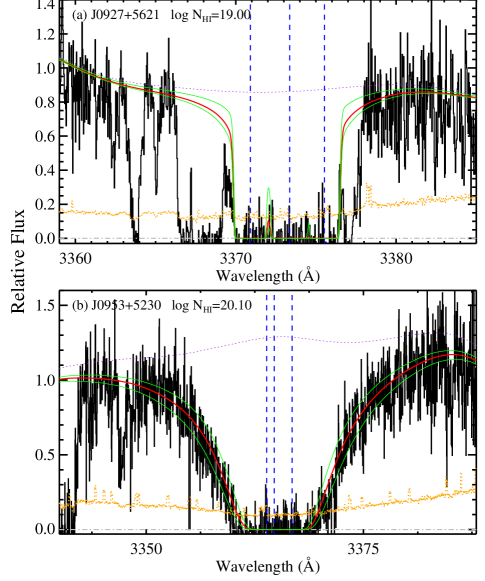
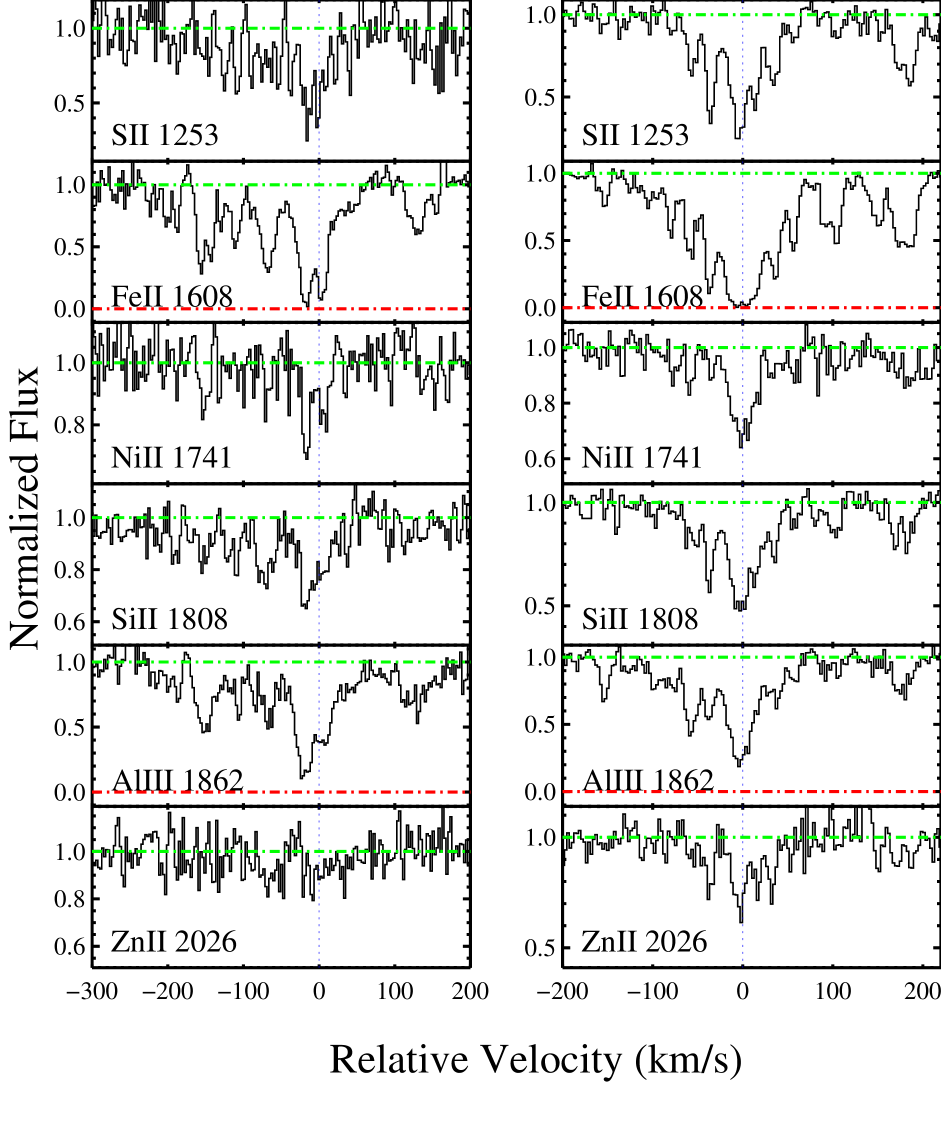
We have measured the H I column density of these SLLS by fitting Voigt profiles to the Ly transitions (Figure 1). For SLLS0953+5230 (Figure 1b), damping wings are obvious and a precise evaluation of is straightforward, albeit subject to uncertainty dominated by continuum placement. In the case of SLLS0927+5621, the absence of significant damping wings limits . In Figure 1a, we present a fit constructed by distributing the neutral hydrogen according to the observed metal-line profiles. The best-fit total hydrogen column density is , but we caution that a significantly lower column density is permitted by the data. Figure 2 presents a subset of the metal-line transitions observed for the two absorbers. We have measured column densities for all the transitions using the apparent optical depth method (Savage & Sembach, 1991) and list the values and errors in Table 1. At HIRES resolution, the profiles are well resolved and there is no indication of ‘hidden’ line saturation from column density measurements of multiple transitions of the same ion.
| Ion | J0927+5621 | J0953+5230 | |||||
|---|---|---|---|---|---|---|---|
| flga | flga | ||||||
| H I | 1215.67 | 1 | 19.00 | 1 | 20.10 | ||
| C II | 1334.532 | 3 | 3 | ||||
| C IV | 1548.195 | 2 | 2 | ||||
| C IV | 1550.770 | 2 | 2 | ||||
| N I | 1199.550 | 3 | |||||
| N V | 1242.804 | 0 | |||||
| O I | 1302.168 | 3 | 3 | ||||
| O I | 1355.598 | 5 | |||||
| Al II | 1670.787 | 3 | 3 | ||||
| Al III | 1854.716 | 2 | |||||
| Al III | 1862.790 | 0 | 0 | ||||
| Si II | 1264.738 | 4 | 4 | ||||
| Si II | 1304.370 | 3 | 3 | ||||
| Si II | 1526.707 | 3 | 3 | ||||
| Si II | 1808.013 | 1 | 1 | ||||
| Si III | 1206.500 | 2 | 2 | ||||
| Si III | 1892.030 | 4 | 4 | ||||
| Si IV | 1393.755 | 2 | 2 | ||||
| Si IV | 1402.770 | 2 | 2 | ||||
| P II | 1152.818 | 3 | |||||
| P II | 1532.533 | 5 | 5 | ||||
| S II | 1250.584 | 1 | |||||
| S II | 1253.811 | 1 | 1 | ||||
| Cr II | 2056.254 | 5 | 1 | ||||
| Cr II | 2066.161 | 5 | |||||
| Fe II | 1608.451 | 3 | 3 | ||||
| Fe II | 1611.200 | 1 | 9 | ||||
| Ni II | 1370.131 | 1 | |||||
| Ni II | 1454.842 | 1 | 1 | ||||
| Ni II | 1709.604 | 1 | |||||
| Ni II | 1741.553 | 1 | 1 | ||||
| Ni II | 1751.916 | 1 | |||||
| Zn II | 2026.136 | 5 | 1 |
The metallicity of the SLLS may be derived by comparing the metal column densities against . In gas that is predominantly neutral (e.g. the majority of DLA), an accurate metallicity value is calculated through a direct comparison of low-ion species, e.g. Si/H . In systems with predominantly photoionized gas, however, one must consider ionization corrections to the low-ion ratios (Howk & Sembach, 1999; Vladilo et al., 2001; Prochaska et al., 2002). To gauge the ionization state, ideally one compares multiple ionization levels of a single element. Unfortunately, the relatively low redshift of these SLLS places several key transitions (e.g. Fe III 1122, N II 1083) below the atmospheric cutoff. One can, however, make a first crude estimate based on the values. At , the extragalactic background radiation field is sufficiently intense to photoionize the majority of absorbers with (Viegas, 1995; Prochaska & Wolfe, 1996). Therefore, we expect that SLLS0927+5621 is predominantly ionized with ionization fraction , perhaps with an ionization state comparable to the SLLS at toward Q2231–00 (; Prochaska, 1999). At , SLLS0953+5230 is nearly a DLA and one expects it to have a much lower ionization fraction than SLLS0927+5621.
The observations place an additional constraint on the ionization fraction. First, we have measured values from the Al III 1862 transitions and set an upper limit on the Al++/Al+ ratios based on the saturated Al II 1670 profile (Table 2). These values, unfortunately, are not very constraining and allow for both large and small values. Vladilo et al. (2001) have shown that the Al++/Si+ ratio is a useful diagnostic of photoionization. The observed Al++/Si+ value for SLLS0927+5621 is twice as large as that for any DLA whereas the value for SLLS0953+5230 is comparable to that for DLA with low value (Vladilo et al., 2001). Therefore, the values are consistent with a significant ionization fraction for SLLS0927+5621 and predominantly neutral gas for SLLS0953+5230. As such, we estimate the ionization corrections for SLLS0953+5230 are negligible.
For SLLS0927+5621, we have considered the ionization corrections in greater depth. Specifically, we have performed a series of Cloudy calculations (v05.07.06 Ferland, 2003) assuming a constant density cloud with to , solar metallicity and two input radiation fields: (i) an updated extragalactic UV background (EUVB) model (HM; Haardt & Madau, 1996) and (ii) the output from a Starburst 99 calculation (SB99; Leitherer et al., 1999) for a galactic starburst with age of 100 Myr. As discussed below, the latter radiation field is motivated by the fact that these SLLS absorbers resemble the gas associated with bright Lyman break galaxies (Steidel et al., 1999; Pettini et al., 2002). We considered a range of intensities parameterized by the ionization parmeter with the number density of ionizing photons. For the HM model and , the upper limit to Al++/Al+ implies upper limits to the ionization corrections for Si+ and Fe+ of 0.6 dex and 0.2 dex respectively. We note, however, that the Al II 1670 profile is highly saturated and a more reasonable upper limit to is dex implying ionization corrections of less than 0.3 dex for all of the low-ions considered here. To be conservative, we have adopted 0.3 dex corrections, i.e. (X/H) = (Xi/H I) , for all low-ions Xi.
If one were to assume a lower value for SLLS0927+5621, the ionization correction is larger but the corrected gas metallicity is also larger (the increased ionization correction is smaller than the decrease in ). Similarly, if we adopt the S99 spectrum which is softer than the EUVB field one also finds slightly larger corrections (0.1 to 0.2 dex). However, the corrections for are still only dex for Si+ and S+ relative to H I. We caution again that one should avoid drawing firm conclusions on the ionization state of the gas from Al++ and Al+ alone because of uncertainties in the recombination rates of these ions. Unfortunately, a more accurate assessment of the ionization corrections must await observations at Å.
| J0927+5621 | J0953+5230 | |
| zSLLS | 1.775 | 1.768 |
| 19.00 | 20.10 | |
| Si/H]a | ||
| S/H] | ||
| Zn/H] | ||
| S/Fe] | ||
| log(Al++/Al+) | ||
| log(Al++/Si+) | ||
| 0.9 |
relative to Solar abundance. We have assumed low-ion species and
ionization corrections of 0.3 dex for
SLLS0927+5621 and 0 dex for SLLS0953+5230.
and Al++ values.
Table 2 presents the gas-phase abundances relative to solar (Grevesse, Noels & Sauval, 1996) based on the low-ion ratios with our adopted ionization corrections. The Zn333Note that Zn is a trace element and even a enhancement would not require a large metallicity., Si, and S values for SLLS0927+5621 are all consistent with the absorber having solar abundance. At present, the gas has the highest, precise metallicity measurement in any astrophysical environment (e.g. Dietrich et al., 2003; Jenkins et al., 2005; Péroux et al., 2006; Gratton et al., 2006; Pilyugin et al., 2006). Again, we note that the H I column density could be significantly less than the value adopted here. If we adopted a lower value we would derive a higher ionization fraction and ionization correction, yet also a higher gas metallicity. For SLLS0953+5230, the metallicity is marginally super-solar. The observations demonstrate that super-solar gas exists at high redshift, even apart from the direct vicinity of quasars.
3 Discussion
Before commenting on the implications for metals in the young universe, let us consider the physical origin of this gas. It is notable that both absorbers exhibit relatively wide absorption line profiles revealing a velocity field of several hundred km s-1 . While this is partly the effect of selection bias (large velocity width yields larger EW), the MSDLA candidate sample (Herbert-Fort et al., 2006) focused primarily on Si II 1808 and Zn II 2026 which are optically thin in these systems. We suggest that the kinematics are indicative of feedback processes correlated with star formation. Indeed, these absorbers may represent sightlines which pass through the gas observed in absorption in the spectra of bright Lyman break galaxies (Steidel et al., 1999; Pettini et al., 2002). The systems also exhibit very large C IV column density. Current measurements of the frequency distribution of C IV column densities show a dependence with to C IV column densities of (Songaila, 2005). Therefore, the mass density of C+3 ions is dominated by the largest column density absorbers. We suspect that LLS like the ones presented here contain the majority of C+3 ions at all redshifts. Again, this is an assertion we will test through a large sample of LLS observations. It would be valuable to compare the observations of the super-solar SLLS with models of outflows from star-forming galaxies.
The detection of two super-solar SLLS underscores the prospect for LLS to contain a substantial fraction of the metal mass in the high universe. Consider the results for SLLS0927+5621 alone. The total metal column density of the gas is given by where is the total hydrogen column density and M/H is the mean metallicity of the gas. Taking () and five times solar abundance, we find that the metal column density is larger than any DLA at . In fact, the value roughly matches the total of the DLA with metallicity measurements at to 2.2 (Prochaska et al., 2003). Because SLLS outnumber DLA by times (O’Meara et al., 2006), even if systems like SLLS0927+5621 represent only 1% of the SLLS population, their contribution would match the entire DLA population. This remains true even if the other 99% of SLLS were primordial!
To better illustrate the contribution of LLS (specifically SLLS) on the cosmological metal budget, consider the following calculation. First, define the mass density of metals in the DLA relative to the critical density
| (1) |
where is the mean metallicity in mass units (i.e. is the Solar metallicity). Adopting the results from Prochaska, Herbert-Fort & Wolfe (2005) and Prochaska et al. (2003) , we derive , i.e. a few percent of .
Consider the metal mass density of the SLLS, , motivated by observational considerations:
| (2) |
where is the ionization fraction of the LLS (likely a function of ), is the frequency distribution, and is the mean metallicity of the gas. Currently, all of the expressions in the integrand of Equation 2 are poorly constrained and so we will proceed conservatively. First, we adopt our new measurement of for the SLLS at (O’Meara et al., 2006): . Second, we will adopt a value to the mean metallicity based on the Péroux et al. (2003) survey () and assume the value is independent of value. In light of the results presented in this paper, we consider this to be a conservative lower limit to . Even though super-solar SLLS are very rare they will contribute significantly to the mean if they represent of the sample.
The most uncertain quantity in this calculation is the ionization fraction which undoubtedly varies with column density (and possibly metallicity). Photoionization calculations estimate that at the DLA threshold and increases to at with strongest dependence on the gas density and intensity of the radiation field (e.g. Vladilo et al., 2001; Prochaska et al., 2002). Péroux et al. (2003) and Dessauges-Zavadsky et al. (2003) stressed that ionization corrections are small for their SLLS sample and gave the misleading impression that the gas is predominantly neutral. Indeed, this is not the case (Dessauges-Zavadsky, priv. comm.); we also find that the SLLS can be significantly ionized (Prochaska 1999; Prochter et al. in prep.). For the following, we will parameterize with an empirical motivation: where can be varied to reduce/increase the degree of photoionization.
Evaluating Equation 2, we derive for and for . These values are significantly in excess of the metal mass density implied by the damped Ly systems and the IGM. We believe this calculation is reasonably conservative because (i) we have neglected the contribution of LLS with and (ii) the mean metallicity of the SLLS could easily be 1/3 or 1/2 solar. Therefore, the LLS may contain the majority of metals at high . In future papers, we will derive empirical measurements of the ionization fraction and metallicity of a large sample of LLS to directly determine the LLS contribution.
References
- Abazajian et al. (2005) Abazajian, K. et al. 2005, AJ, 129, 1755.
- Bergeron & Herbert-Fort (2005) Bergeron, J. and Herbert-Fort, S. 2005, in IAU Colloq. 199: Probing Galaxies through Quasar Absorption Lines, ed. P. Williams, C.-G. Shu, and B. Menard, 265.
- Bouché, Lehnert & Péroux (2005) Bouché, N., Lehnert, M. D., and Péroux, C. 2005, MNRAS, 364, 319.
- Bouché, Lehnert & Péroux (2006) Bouché, N., Lehnert, M. D., and Péroux, C. 2006, MNRAS, 367, L16.
- Dietrich et al. (2003) Dietrich, M., Hamann, F., Shields, J. C., Constantin, A., Heidt, J., Jäger, K., Vestergaard, M., and Wagner, S. J. 2003, ApJ, 589, 722.
- Dessauges-Zavadsky et al. (2003) Dessauges-Zavadsky, M. et al. 2003, MNRAS, 345, 447.
- Fall & Pei (1993) Fall, S. M. and Pei, Y. C. 1993, ApJ, 402, 479.
- Ferland (2003) Ferland, G.J. 2003, ARA&A, 41, 517.
- Ferrara, Scannapieco & Bergeron (2005) Ferrara, A., Scannapieco, E., and Bergeron, J. 2005, ApJ, 634, L37.
- Giavalisco et al. (2004) Giavalisco, M. et al. 2004, ApJ, 600, L103.
- Gratton et al. (2006) Gratton, R., Bragaglia, A., Carretta, E., and Tosi, M. 2006, ApJ, 642, 462.
- Grevesse, Noels & Sauval (1996) Grevesse, N., Noels, A., and Sauval, A. J. 1996, in ASP Conf. Ser. 99: Cosmic Abundances, ed. S. S. Holt and G. Sonneborn, 117.
- Haardt & Madau (1996) Haardt, F. & Madau, P. 1996, ApJ, 461, 20
- Herbert-Fort et al. (2006) Herbert-Fort, S., Prochaska, J. X., Dessauges-Zavadsky, M., Ellison, S.L., Howk, J.C., Wolfe, A.M., and Prochter, G. 2006, PASP, Submitted.
- Howk & Sembach (1999) Howk, J. C. and Sembach, K. R. 1999, ApJ, 523, L141.
- Jenkins et al. (2005) Jenkins, E. B., Bowen, D. V., Tripp, T. M., and Sembach, K. R. 2005, ApJ, 623, 767.
- Leitherer et al. (1999) Leitherer, C. , Schaerer, D., Goldader, J. D., Delgado, R. M. G., Robert, C., Kune, D. F., de Mello, D. F., Devost, D., and Heckman, T. M. 1999, ApJS, 123, 3.
- Madau et al. (1996) Madau, P. et al. 1996, MNRAS, 283, 1388.
- O’Meara et al. (2006) O’Meara, J., Prochaska, J. X., Burles, S.M., Prochter, G., and Bernstein, R. 2006, ApJ, submitted
- Pagel (2002) Pagel, B. E. J. 2002, in ASP Conf. Ser. 253: Chemical Enrichment of Intracluster and Intergalactic Medium, ed. R. Fusco-Femiano and F. Matteucci, 489.
- Péroux et al. (2003) Péroux, C. et al. 2003, MNRAS, 345, 480.
- Péroux et al. (2005) Péroux, C. et al. 2005, MNRAS, 363, 479.
- Péroux et al. (2006) Péroux, C. et al. 2006, ArXiv Astrophysics e-prints.
- Pettini (2004) Pettini, M. 2004, in Cosmochemistry. The melting pot of the elements, ed. C. Esteban, R. García López, A. Herrero, and F. Sánchez, 257.
- Pettini et al. (1994) Pettini, M. et al. 1994, ApJ, 426, 79.
- Pettini et al. (2002) Pettini, M., Rix, S. A., Steidel, C. C., Adelberger, K. L., Hunt, M. P., Shapley, A. E. 2002, ApJ, 569, 742.
- Pilyugin et al. (2006) Pilyugin, L. S., Thuan, T. X., and Vílchez, J. M. 2006, MNRAS, 367, 1139.
- Prochaska (1999) Prochaska, J. X. 1999, ApJ, 511, L71.
- Prochaska & Burles (1999) Prochaska, J. X. and Burles, S. M. 1999, AJ, 117, 1957.
- Prochaska et al. (2003) Prochaska, J. X. et al. 2003, ApJ, 595, L9.
- Prochaska, Herbert-Fort & Wolfe (2005) Prochaska, J. X., Herbert-Fort, S., and Wolfe, A. M. 2005, ApJ, 635, 123.
- Prochaska et al. (2002) Prochaska, J. X. et al. 2002, ApJ, 571, 693.
- Prochaska & Wolfe (1996) Prochaska, J. X. and Wolfe, A. M. 1996, ApJ, 470, 403.
- Rao, Turnshek & Nestor (2006) Rao, S. M., Turnshek, D. A., and Nestor, D. B. 2006, ApJ, 636, 610.
- Savage & Sembach (1991) Savage, B. D. and Sembach, K. R. 1991, ApJ, 379, 245.
- Schaye et al. (2003) Schaye, J. et al. 2003, ApJ, 596, 768.
- Simcoe, Sargent & Rauch (2002) Simcoe, R. A., Sargent, W. L. W., and Rauch, M. 2002, ApJ, 578, 737.
- Simcoe, Sargent & Rauch (2004) Simcoe, R. A., Sargent, W. L. W., and Rauch, M. 2004, ApJ, 606, 92.
- Simcoe et al. (2006) Simcoe, R. A. et al. 2006, ApJ, 637, 648.
- Songaila (2005) Songaila, A. 2005, AJ, 130, 1996.
- Steidel et al. (1999) Steidel, C. C. et al. 1999, ApJ, 519, 1.
- Tytler et al. (1995) Tytler, D. et al. 1995, in QSO Absorption Lines, Proceedings of the ESO Workshop Held at Garching, Germany, 21 - 24 November 1994, edited by Georges Meylan. Springer-Verlag Berlin Heidelberg New York. Also ESO Astrophysics Symposia, 1995., p.289, ed. G. Meylan, 289.
- Viegas (1995) Viegas, S. M. 1995, MNRAS, 276, 268.
- Vladilo et al. (2001) Vladilo, G. et al. 2001, ApJ, 557, 1007.
- Vladilo & Péroux (2005) Vladilo, G. and Péroux, C. 2005, A&A, 444, 461.
- Vogt et al. (1994) Vogt, S. S. et al. 1994, in Proc. SPIE Instrumentation in Astronomy VIII, David L. Crawford; Eric R. Craine; Eds., Volume 2198, p. 362, 362.
- Wolfe et al. (1994) Wolfe, A. M. et al. 1994, ApJ, 435, L101.