The prompt optical/near-infrared flare of GRB 050904: the most luminous transient ever detected
Abstract
With a redshift of , GRB 050904 is the most distant gamma-ray burst ever discovered. It was an energetic event at all wavelengths and the afterglow was observed in detail in the near-infrared bands. We gathered all available optical and NIR afterglow photometry of this GRB to construct a composite NIR light curve spanning several decades in time and flux density. Transforming the NIR light curve into the optical, we find that the afterglow of GRB 050904 was more luminous at early times than any other GRB afterglow in the pre-Swift era, making it at these wavelengths the most luminous transient ever detected. Given the intrinsic properties of GRB 050904 and its afterglow, we discuss if this burst is markedly different from other GRBs at lower redshifts.
Subject headings:
Gamma rays: bursts — Gamma rays: individual: GRB 0509041. Introduction
The detection of an extremely bright prompt optical flash accompanying GRB 990123 (Akerlof et al., 1999) highlighted the possibility of using GRB afterglows as backlighting sources to probe the high-redshift universe and the reinonization era (Lamb & Reichart, 2000; Inoue et al., 2004; Totani et al., 2006). This promise was finally fulfilled with the discovery of GRB 050904 by the Swift satellite (Cusumano et al., 2006a, b), lying at a redshift of (Kawai et al., 2006). Not only was a bright NIR afterglow discovered for this GRB (Haislip et al., 2006; Tagliaferri et al., 2005), a prompt flash contemporaneous to the -ray emission was seen by the robotic 25cm TAROT telescope (Böer et al., 2006).
Had the prompt optical flash of GRB 990123 been at a redshift of and had it been unextinguished by any dust, it would have peaked at an apparent magnitude111In this paper, we use WMAP concordant cosmology with km s-1 Mpc-1, , (Spergel et al., 2003). For , this leads to a distance modulus of mag. (Kann et al., 2006, henceforth K06). This corresponds to an absolute -band magnitude (, assuming the color for a G2V star from Ducati et al., 2001), making this the most luminous optical source ever detected at that time. In this paper, we compile all available data on the afterglow of GRB 050904 and construct a synthetic light curve for a hypothetical perfectly ionized universe showing no Lyman dropout up to the redshift of the GRB. We then derive light curve parameters and use the spectral energy distribution (SED) of the afterglow to extrapolate the afterglow light curve into the band assuming . We find that the prompt flash of GRB 050904 was the most luminous optical/NIR transient ever detected, even exceeding the -band luminosity of GRB 990123 at peak by more than one magnitude.
| fitaaThe first fit uses data from 0.1 to 3 days after the burst, while the second fit uses only data after 0.3 days. H06 denotes the results from Haislip et al. (2006), and T05 those of Tagliaferri et al. (2005). | d.o.f. | bbThe apparent -band magnitude at the respective break time is denoted as (cf. Z06, Eq. 1). | ccThe break at which the forward shock afterglow begins to dominate over the prompt flash emission is , while denotes the jet break time. Break times are given in units of days after the burst trigger. | dd and are the break smoothness parameters of the first and second breaks, respectively. | ||||||
|---|---|---|---|---|---|---|---|---|---|---|
| 1 | 59.2 | 17 | ||||||||
| 2 | 59.7 | 17 | ||||||||
| H06 | ||||||||||
| T05 |
2. The composite light curve of the GRB 050904 afterglow
2.1. Data mining and fitting methods
The optical/NIR afterglow of GRB 050904 was observed by different telescopes over almost five decades in time and more than six decades in flux density. Due to its very high redshift, it was not detected at wavelengths shorter than the band. We compiled all data from the following papers: Haislip et al. (2006), Tagliaferri et al. (2005), Böer et al. (2006), Kawai et al. (2006), Gendre et al. (2006) and Berger et al. (2006). All data were corrected for Galactic extinction assuming (Schlegel et al., 1998), and then transformed into AB magnitudes (Oke & Gunn, 1983). To transform the magnitudes into flux densities, we used the zero points given in Haislip et al. (2006) to transform their data and standard zero points for all other data. Data in Kawai et al. (2006), Berger et al. (2006) and data from Tagliaferri et al. (2005) are already AB magnitudes.
The highest data density is available in the band. Therefore, we started with the band to construct a synthetic light curve by achromatically shifting the other bands to the -band light curve. This method is justified, as no systematic color evolution was found in the data set. For the normal forward shock evolution of the afterglow (once the cooling frequency has passed the optical/NIR bands) such achromacy is expected. While the early steep-to-shallow transition at days may be chromatic, we only have band data at this time anyway. In the following, we will always assume an achromatic evolution of the afterglow.
We fitted the -band data with a broken power-law (for more details on the fitting procedure, see Zeh et al., 2006, henceforth Z06). As Haislip et al. (2006) have noted, the early -band data before 0.3 days are brighter than the extrapolation of later data to these times, indicating the steeper decline from what could be a reverse shock flash. Initially, we excluded these early data from our fit. We used the derived light curve parameters from the fit to the -band light curve as a reference light curve and fitted the -band data with this reference curve. We thus found a color . Assuming , we shifted the -band data to the zero point, merging the light curves. We then fitted the combined light curve again and shifted the -band data points in small increments until is minimized, thus deriving the true color and the light curve parameters of the joint light curve which spans a longer time range (0.3 to 12 days in the observer frame) and gives a better constraint on the post-jet break (after 2.6 days) decay slope (it is ). The -band data (where we make no distinction between , and ) and the -band data were added in the same way. These additional shifts were not larger than 0.03 mag.
We transformed the HST NICMOS F160W (AB) data point from Berger et al. (2006) to (AB) by using the conv_AB value from the package222http://webast.ast.obs-mip.fr/hyperz/ (Bolzonella et al., 2000), . As the final HST data point is corrected for host contribution, we also corrected the other data points in the same way. From the synthetic host spectrum presented in Berger et al. (2006), we derived for the host galaxy a -band flux density of 0.055 Jy, which transforms into . We assumed conservative errors of 0.3 mag. The effect of host subtraction is very small, at most 0.03 mag, since the last afterglow data point at 5 days is still 4 magnitudes brighter than the host galaxy.
2.2. Fitting the light curve
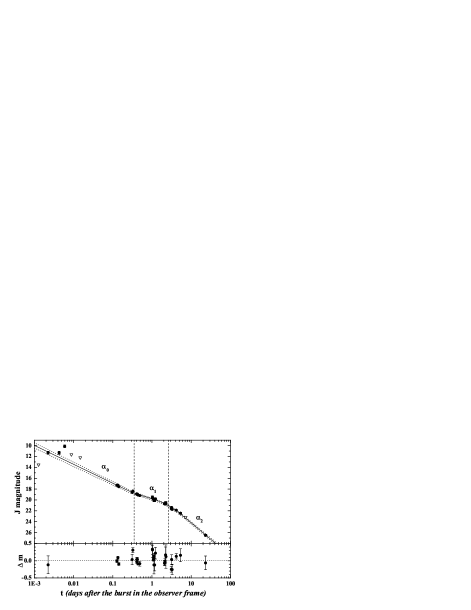
The composite light curve consists of an early steep decay (Haislip et al., 2006), which goes over into a typical afterglow decay, followed by a further break, which is identified as a jet break (Tagliaferri et al., 2005). We fitted the two breaks separately, using the equation from Z06 (fixing the host flux to zero as the data have been corrected for host contribution). For the first fit, we excluded all data beyond 3 days from the fit. The break smoothness parameter (cf. Z06) had to be fixed to (a negative value, as the break is from steep to shallow). The jet break was fitted with left as a variable in the fit. For this fit, data earlier than 0.3 days were excluded. We thus derived three decay constants, which we label (the steep early decay), and (the typical pre- and post-jet break decay). We then transformed all data from AB back to Vega magnitudes using standard zero points.
The data (Böer et al., 2006; Haislip et al., 2006; Tagliaferri et al., 2005; Kawai et al., 2006) are already affected by Ly damping. While we used the composite reference light curve to find the color, we did not implement the data in the derivation of the light curve parameters. We also did not implement the subluminous measurement from Haislip et al. (2006). Böer et al. (2006) give the TAROT measurements both as flux density at 9500 Å and as magnitudes. We used the flux density and transformed it to magnitudes. Comparing these with the magnitudes of Böer et al. (2006), we find mag. This is in very good agreement with the color of 2.48 mag derived from late afterglow data at 1.2 days, where is the VLT FORS2 -band filter (for details on the and filters, see Tagliaferri et al., 2005). The color derived at late times was then used to shift all data points to the zero point (as always, we assume achromacy, i.e., a constant spectral slope). The result is a final composite light curve which includes all data from the early prompt emission to the late HST detection. In the following, when we speak of the -band light curve, we always refer to this composite light curve.
2.3. Results of the light curve fitting
The results of the light curve fits using the light curve are given in Table 1, and the complete composite light curve is shown in Fig. 1. As expected, derived from the two different fits (cf. §2.2) agrees within errors. There is some scatter in the light curve data which leads to the high values of . This is either due to additional measurement uncertainties or small deviations from a power-law decay, as it has been found that the X-ray afterglow was extremely variable (Cusumano et al., 2006a, b; Watson et al., 2006). The values we derived are in full agreement with those of other authors (Table 1). These light curve parameters are typical for afterglows (see Z06 for a compilation of light curve parameters of all pre-Swift afterglows). The light curve steepening is high but also not extraordinary (Z06, their Fig. 3). We note that this is one of the few light curves that allow the smoothness of the jet break to be fitted as a free parameter, and the result is in full agreement with the potential relationship between and found by Z06 (their Fig. 8).
For our fit, the extrapolation to very early times meets the earliest TAROT detection at 0.002 days, similar to what Böer et al. (2006) find. However, the following plateau phase around 0.001 days and the flare are much brighter than the extrapolated light curve (1 and almost 3 magnitudes, respectively). This implies that the decay after the optical flare must be steep. Taking into account the upper magnitude limit at 0.09 days (Gendre et al., 2006), we find . Such a steep decay implies that the flare could be either due to reverse shock emission or internal shocks from late central engine activity (Böer et al., 2006; Gendre et al., 2006; Wei et al., 2006; Zou et al., 2006). Since this is even steeper than , an additional break must exist, but no data are available during this time span. In particular, we find that the afterglow peaks333 The exposure time of the data point is 140 seconds (Böer et al., 2006). Possibly, the afterglow was even brighter on shorter timescales. at , which is among the brightest NIR afterglows ever detected and is a first hint at its extreme luminosity.
3. The luminosity of the prompt flash
3.1. Results of the spectral energy distribution fitting
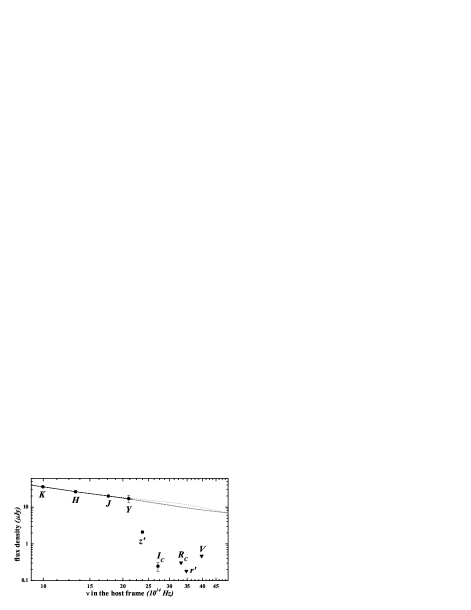
To construct the SED, we used the colors , and that were derived in §2.1 (, , and data are not affected by Lyman damping). The SED is fitted as described in K06. First, we find an observed spectral slope . Then the SED was fitted with an additional dust extinction curve, using dust models for the Milky Way, the Large and the Small Magellanic Cloud (Pei, 1992). This gives us the extinction in the band in the host galaxy frame and an intrinsic spectral slope , corrected for the host extinction.
To extend the SED further into the optical bands (in the observer frame), we used reported upper limits. By shifting the composite light curve to these limits, we produced additional , and colors which are lower limits on these colors. Instead of a flat or downward curved SED, we actually found a slight upward curvature, mainly due to the -band data (which have large errors) being slightly too bright (Fig. 2, this can also be seen in Figs. 2 and 3 of Haislip et al., 2006). This results in a fit with SMC dust, which is typically favored for GRB host galaxies (K06, and references therein), finding a negative extinction, which is unphysical. The best result is actually obtained for Milky Way dust, even though this does not imply that the host galaxy of GRB 050904 has dust resembling that of the Milky Way. While SMC dust is characterized by strong far-ultraviolet extinction, MW dust has a much flatter extinction curve at these wavelengths. Indeed, Maiolino et al. (2004) have found dust with flat FUV extinction in a quasar at almost the same redshift as GRB 050904, and Stratta et al. (2005) find that the optical and X-ray afterglow of GRB 020405 can be explained by dust with similar properties, although this GRB lies at a much closer redshift. The characteristic 2175 Å bump of MW dust is not visible due to the very low extinction value we derive. We thus conclude that the extinction in the host galaxy is very low and the dust is dissimilar to SMC-type dust. In the following, we will use the values derived from the MW dust fit, deeming this as a conservative approach.
The results of the SED fitting are given in Table 2. Once again, our fits are in good agreement with those of other authors, except for Price et al. (2006), who ascribe the low value they derive to possible short term fluctuations. Haislip et al. (2006) and Tagliaferri et al. (2005) also note that while source frame dust extinction may be present, it must be low. The hydrogen column density along the line of sight in the host galaxy derived via optical spectroscopy is large (log , Kawai et al., 2006). Coupled with the very low extinction, this implies a dust-to-gas ratio that is even lower than for the SMC. The result is similar to GRB 990123, and in this case also, the prompt flash may have burned dust along the line of sight (cf. Fig. 6 in K06, and references therein).
3.2. The circum-burst environment of GRB 050904
Knowledge of the light curve parameters and the intrinsic spectral slope allows us to derive conclusions on the nature of the circum-burst environment via closure relations (Price et al., 2002; Berger et al., 2002). We find that using and , a model is strongly favored where the cooling break frequency lies redward of the source frame ultraviolet after 0.4 days. This is substantiated by the spectral slope of the late X-ray afterglow, which is identical to that in the ultraviolet within errors. Watson et al. (2006) find , Cusumano et al. (2006a, b) find . Furthermore, Frail et al. (2006) used their radio detections of the afterglow of GRB 050904 to perform broadband modeling and arrived at the same conclusion. In this case, one cannot draw any conclusion on whether the GRB environment is of constant density (ISM) or is shaped by a progenitor wind. The observed very soft jet break (, Table 1) may be indicative of a wind environment (Chevalier & Li, 1999), whereas Frail et al. (2006) use an ISM model. Finally, Gendre et al. (2006) propose that the afterglow passes through a termination shock somewhere before 0.5 days in the observer frame, switching from an early wind medium to a late ISM medium. Given the location of redward of the optical/NIR bands, an electron spectral index of is found, which is typical for GRB afterglows (e.g., Zhang & Mészáros, 2004, and references therein). The standard fireball model predicts (Zhang & Mészáros, 2004), consistent with the we find within (Table 1).
3.3. Derivation of the -band light curve
In the observer frame band, the afterglow was unobservable due to Lyman damping. Typically, GRB afterglows have the highest data density in the band, and all afterglows that were examined in K06 were -band afterglows. Because of the synchrotron nature of the afterglow radiation (described by a power-law, , with being the spectral slope), and assuming const., we can construct the -band light curve from the -band light curve. The spectral slope we derived from the observer frame NIR data can be extrapolated into the observer frame optical, allowing us to find a color without the damping influence of Lyman . For this purpose, we used the observed spectral slope that has not yet been corrected for host galaxy extinction, . Since the host galaxy extinction is very low, the spectral curvature is negligible and we can use a simple power-law for the extrapolation. This power-law has an error from the fitting process, which we added in quadrature to the measurement errors of the data points.
3.4. The -band luminosity of the prompt flash
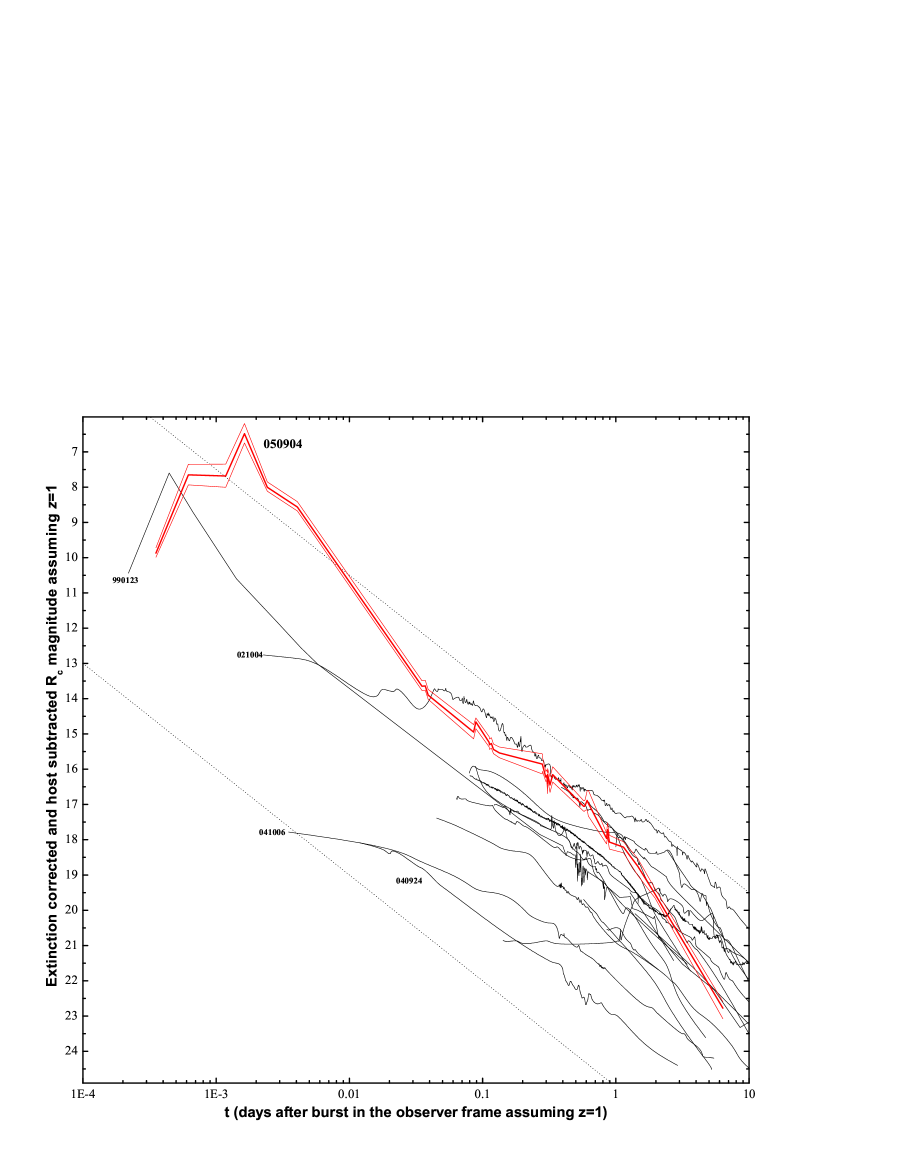
In order to place the afterglow of GRB 050904 in the context of the afterglow sample discussed in K06, we shifted the afterglow to a redshift . Using the derived intrinsic spectral slope , the source frame extinction (both from the MW dust fit) and the redshift, we computed the magnitude shift denoted in K06. This shift takes into account the extinction correction, the redshift difference and cosmological -corrections (Sandage, 1988) when moving the source from its original redshift to . The magnitude shift creates a further error (from and ) which we again added in quadrature to the errors of the data. We find mag, which is higher than any value found in K06. Applying this correction to the -band afterglow, we finally arrive at our main result: had GRB 050904 lain at and been unaffected by any line-of-sight extinction (including Lyman damping), the optical flare detected by TAROT would have peaked at , almost visible to the naked eye. This is more than one magnitude brighter than the reverse shock peak of GRB 990123 (the flux density is higher by a factor of 2.8), making the afterglow of GRB 050904 the most luminous optical transient ever detected. Böer et al. (2006), neglecting -correction, find a peak flux density of 1080 mJy (in the band) for the afterglow of GRB 990123 and 1300 mJy (in the band) for the afterglow of GRB 050904 after scaling it to the redshift of GRB 990123, but do not remark upon this further except to call the two events comparable. For , the absolute -band magnitude is (), making the afterglow in the band alone between 60 and 600 times brighter than the intrinsic bolometric luminosity of the gravitationally lensed hyperluminous BAL quasar APM 08279+5255, the most luminous persistent source known (Ibata et al., 1999).
The complete composite band light curve is shown in comparison with other afterglows in Fig. 3. It is immediately apparent that the optical afterglow of GRB 050904 was much brighter than any other afterglow over almost two decades in time. At the peak of the prompt flash, it was six magnitudes brighter than GRB 021004, which is the brightest afterglow at late times, and another six magnitudes brighter than GRB 041006, one of the faintest GRBs in the sample. This span is much larger than at one day after the GRB, where the afterglow luminosities tend to cluster (K06; Liang & Zhang, 2006; Nardini et al., 2006). At later times, though, it resembles other afterglows. At one and four days after the burst (Fig. 3), we find and , respectively, which transforms to absolute magnitudes and , respectively (cf. K06, their Figs. 9 and 10). This ranks it among the brightest afterglows at one day, but it is not the brightest, as it has also been noted by Tagliaferri et al. (2005). At four days after the burst, it lies close to the center of the luminosity distribution.
3.5. The spectral slope during the flare
Since no multi-color data for the prompt emission phase are available, we shifted the early optical emission achromatically, assuming no spectral changes between this phase and the late afterglow phase (where no color evolution is evident). The assumption of achromacy for the first 100 seconds after a GRB is surely an oversimplification. Strong spectral changes are expected within this time (Sari et al., 1998). However, does this imply that the true luminosity of the flare was actually lower than what we have derived?
The spectral slope of the late optical/NIR afterglow, consistent with the cooling break lying at longer wavelengths than the optical, is very steep, . During the prompt emission, the forward shock afterglow is expected to be in the fast cooling phase (Wu et al., 2005, and references therein). If the medium surrounding the GRB progenitor is of constant density (ISM model), the optical band lies between the cooling frequency (at longer wavelengths) and the peak frequency , the expected spectral slope is . In case even the cooling frequency has not yet passed the optical bands, the spectral slope in the optical actually rises, with (Zhang & Mészáros, 2004, and references therein). A similar situation would be seen if the early optical emission is dominated by the low energy tail of the prompt emission, a situation which was seen for GRB 041219A and GRB 050820A (Vestrand et al., 2005, 2006). This has also been suggested for GRB 050904 (Wei et al., 2006), although the optical flux in the flare is much brighter than the extrapolation of the X-ray spectrum for GRB 050904 (Böer et al., 2006), in contrast to the cases of GRB 041219A and GRB 050820A (Vestrand et al., 2005, 2006). We thus conclude that the spectrum in the optical bands during the prompt emission was not steeper than at late times, and possibly shallower, i.e. .
On the one hand, this implies that the magnitude of the afterglow at would be brighter than what we derived with the spectral slope of the late afterglow. On the other hand, when we apply the cosmological shift to , the shift would become smaller. We find mag for and mag for (also correcting for the small host extinction), resulting in and , respectively. Thus, for , the extrapolated -band magnitude at of the flare would be comparable to that of GRB 990123. However, we should also note that the same argument may apply to the flare of GRB 990123, so that the flare of GRB 050904 truly is brighter with a high probability.
4. Is GRB 050904 different from other long GRBs?
In the literature on GRB 050904, consensus is not reached on whether GRB 050904 is, apart from its redshift, a special event. Let us review some aspects of both the prompt emission and the afterglow:
In many ways, GRB 050904 does not differ from the typical mean values found for GRBs. In the source frame, seconds, with -ray emission detected up to 69 seconds after the trigger, including the flare seen prominently in the X-rays and the optical (Böer et al., 2006; Cusumano et al., 2006a, b). The intrinsic luminosities of the X-ray (Watson et al., 2006), the late optical (as shown in this work) and the radio afterglow (Frail et al., 2006) are typical, as are the light curve decay parameters and the jet break time in the rest frame (Z06, K06).
But some aspects of GRB 050904 do stand out. The peak energy lies beyond the Swift BAT energy range. From joint fitting of Swift BAT and Suzaku WAM data, Sugita et al. (2006) report a preliminary keV, translating into keV in the rest frame. This peak energy is the highest found in the compilation of 56 bursts (Amati, 2006), only GRB 050717 (observer frame keV, time-integrated spectrum, Krimm et al., 2006) very probably has a higher peak energy (the redshift is not known but assumed to be high). The isotropic energy is not exactly known, Cusumano et al. (2006a, b) derive erg. The upper end of the range is higher than for any other burst, including GRB 990123 (Amati, 2006), and even the lower value is higher than for most GRBs with well-determined . Using a jet break time of days, Tagliaferri et al. (2005) derive log (erg). This is the second highest beaming-corrected energy ever found (Friedman & Bloom, 2005), after GRB 050820A (log (erg), Cenko et al., 2006).The X-ray afterglow is the most variable ever seen by Swift (Cusumano et al., 2006a, b; Watson et al., 2006), implying that, in the source frame, the central engine was active for several hours after the burst (Zou et al., 2006). We have shown in this paper that the early optical/NIR emission is brighter than for any other GRB detected so far. Frail et al. (2006) derive a high circum-burst density of 680 cm-3 from broadband afterglow modeling, noting that a density typical for GRB environments (10 cm-3) is ruled out by the absence of a bright early radio afterglow.
There is no aspect of GRB 050904 that exceeds the typical GRB parameters so much that one could claim that the progenitor of GRB 050904 was markedly different from those of all other long GRBs, e.g. a Population III star. However, it is clear that GRB 050904 is one of the most extreme GRBs ever observed, comparable only to GRB 990123 (cf. Böer et al., 2006), and exceeding even this seminal event in some aspects.
5. Conclusions and Outlook
We have shown that the early flare of GRB 050904 detected by the TAROT telescope is the most luminous optical/NIR transient ever detected, exceeding even the peak magnitude of the prompt optical flash of GRB 990123. While GRB 050904 is not markedly different from other GRBs in any single aspect, it is among the most extreme GRBs ever detected.
So far, only a single GRB at the end of the reionization era has been detected. It is thus not possible to decide whether GRB 050904 is typical for GRBs at a very high redshift, or if it is simple observational bias that the first GRB to be found at is one of the most extreme events ever detected. More typical events would not have sufficient follow-up to determine the necessary parameters, especially the redshift. The Swift satellite, with its high sensitivity in an energy band that is typical for highly redshifted hard bursts and its possibility of long-duration image triggers, is a very powerful instrument for detecting these very distant events. Probably, more very high redshift GRBs will be detected during the lifetime of Swift, possibly even breaking the redshift records for quasars (Fan et al., 2003) and galaxies (Iye et al., 2006). Indeed, a GRB at a higher redshift than GRB 050904 may have already been found, GRB 060116 (Grazian et al., 2006)444However, see also Piranomonte et al. (2006) and Tanvir et al. (2006)..
While the detection of a GRB by Swift is the first and most important step, most parameters characterizing the event can only be obtained by ground-based telescopes. The determination of the true burst energetics depends on the measurement of the redshift and the jet break time, and GRBs at are bright only in the NIR. While optical spectroscopy is still feasible to , any higher redshifts will move the metal lines that are used for an exact determination of beyond the typical limit of optical spectroscopy (and the region beyond m is already strongly affected by sky lines). NIR spectroscopy even at large facilities needs bright sources, and thus far, NIR spectroscopy of a GRB afterglow has never been successful in detecting any lines. The dilemma is that observing time at large facilities is precious and observations would only be triggered in case there is already a strong suspicion that the event lies at a very high redshift. This implies the need for rapid photometric redshift determinations that use the Lyman trough, as it has been successfully applied to GRB 050904 (Haislip et al., 2006; Tagliaferri et al., 2005; Price et al., 2006). One telescope that is already in use and has the capability for rapid multi-color photometry is the MAGNUM telescope, which also observed GRB 050904 (Price et al., 2006). A key element would be the deployment of more moderately large robotic NIR telescopes such as PAIRITEL (Bloom et al., 2005) and REM (Zerbi et al., 2001), which also has an optical camera.
More rapid follow-up of high redshift bursts will finally allow GRBs to fulfill their promise as the ultimate probes of the very early universe.
References
- Akerlof et al. (1999) Akerlof, C. et al. 1999, Nature, 398, 400
- Amati (2006) Amati, L. 2006, MNRAS, 372, 233
- Bloom et al. (2005) Bloom, J. S., Starr, D. L., Blake, C. H., Skrutskie, M. F., & Falco, E. E. 2005, Proc. ”Astronomical Data Analysis Software & Systems XV” (editors C. Gabriel, C. Arviset, D. Ponz and E. Solano), submitted (astro-ph/0511842)
- Berger et al. (2002) Berger, E. et al. 2002, ApJ, 581, 981
- Berger et al. (2006) Berger, E. et al. 2006, ApJ, submitted (astro-ph/0603689)
- Böer et al. (2006) Böer, M. 2006, ApJ, 638, L71
- Bolzonella et al. (2000) Bolzonella, M., Miralles, J.-M., & Pelló, R. 2000, A&A, 363, 476
- Cenko et al. (2006) Cenko, S. B. et al. 2006, ApJ, in press (astro-ph/0608183)
- Chevalier & Li (1999) Chevalier, R. A., & Li, Z.-Y. 1999, ApJ, 520, L29
- Cusumano et al. (2006a) Cusumano, G. et al. 2006, Nature, 440, 164
- Cusumano et al. (2006b) Cusumano, G. et al. 2006, A&A, in press (astro-ph/0610570)
- Ducati et al. (2001) Ducati, J. R., Bevilacqua, C. M., Rembold, S. B., & Ribeiro, D. 2001, ApJ, 558, 309
- Fan et al. (2003) Fan, X. et al. 2003, AJ, 125, 1649
- Frail et al. (2006) Frail, D. A. et al. 2006, ApJ, 646, L99
- Friedman & Bloom (2005) Friedman, A. S., & Bloom, J. S. 2005, ApJ, 627, 1
- Gendre et al. (2006) Gendre, B. et al. 2006, A&A, in press (astro-ph/0603431)
- Grazian et al. (2006) Grazian, A. et al. 2006, GCN 4545, http://gcn.gsfc.nasa.gov/gcn/gcn3/4545.gcn3
- Haislip et al. (2006) Haislip, J. B. et al. 2006, Nature, 440, 181
- Ibata et al. (1999) Ibata, R. A., Lewis, G. F., Irwin, M. J., Lehár, J. & Totten, E. J. 1999, AJ, 118, 1922
- Inoue et al. (2004) Inoue, A. K., Yamazaki, R., & Nakamura, T. 2004, ApJ, 601, 644
- Iye et al. (2006) Iye, M. et al. 2006, Nature, 443, 186
- Kann et al. (2006) Kann, D. A., Klose, S., & Zeh, A. 2006, ApJ, 641, 993 (K06)
- Kawai et al. (2006) Kawai, N. et al. 2006, Nature, 440, 189
- Krimm et al. (2006) Krimm, H. A. et al. 2006, ApJ, 648, 1117
- Lamb & Reichart (2000) Lamb, D. Q., & Reichart, D. E. 2000, ApJ, 536, 1
- Liang & Zhang (2006) Liang, E., & Zhang, B. 2005, ApJ, 638, L67
- Maiolino et al. (2004) Maiolino, R. et al. 2004, Nature, 431, 533
- Nardini et al. (2006) Nardini, M. et al. 2006, A&A, 451, 821
- Oke & Gunn (1983) Oke, J. B., & Gunn, J. E. 1983, ApJ, 266, 713
- Pei (1992) Pei, Y. C. 1992, ApJ, 395, 130
- Piranomonte et al. (2006) Piranomonte, S. et al. 2006, GCN 4583, http://gcn.gsfc.nasa.gov/gcn/gcn3/4583.gcn3
- Price et al. (2002) Price, P. A. et al. 2002, ApJ, 572, L51
- Price et al. (2006) Price, P. A. et al. 2006, ApJ, 645, 851
- Sandage (1988) Sandage, A. 1988, ARA&A, 26, 561
- Sari et al. (1998) Sari, R., Piran, T., & Narayan, R. 1998, ApJ, 497, L17
- Schlegel et al. (1998) Schlegel, D. J., Finkbeiner, D. P., & Davis, M. 1998, ApJ, 500, 525
- Spergel et al. (2003) Spergel, D. N. et al. 2005, ApJS, 148, 175
- Stratta et al. (2005) Stratta, G. et al. 2005, A&A, 441, 83
- Sugita et al. (2006) Sugita, S. et al. 2006, poster shown at the meeting of the Royal Astronomical Society, London, September 2006
- Tagliaferri et al. (2005) Tagliaferri, G. et al. 2005, A&A, 443, L1
- Tanvir et al. (2006) Tanvir, N., Levan, A. J., Priddey, R. S., Fruchter, A. S., & Hjorth, J. 2006, GCN 4602, http://gcn.gsfc.nasa.gov/gcn/gcn3/4602.gcn3
- Totani et al. (2006) Totani, T. et al. 2006, PASJ, 58, 485
- Vestrand et al. (2005) Vestrand, W. T. et al. 2005, Nature, 435, 178
- Vestrand et al. (2006) Vestrand, W. T. et al. 2006, Nature, 442, 172
- Watson et al. (2006) Watson, D. et al. 2006, ApJ, 637, L69
- Wei et al. (2006) Wei, D. M., Yan, T., & Fan, Y. Z. 2006, ApJ, 636, L69
- Wu et al. (2005) Wu, X. F., Dai, Z. G., Huang, Y. F., Lu, T. 2005, ApJ, 619, 968
- Zeh et al. (2006) Zeh, A., Klose, S., & Kann, D. A. 2006, ApJ, 637, 889 (Z06)
- Zerbi et al. (2001) Zerbi, R. M. et al. 2001, Astron. Nachr., 322, 275
- Zhang & Mészáros (2004) Zhang, B., & Mészáros, P. 2004, Int.J.Mod.Phys. A19 (2004), 2385
- Zou et al. (2006) Zou, Y. C., Xu, D., & Dai, Z. G. 2006, ApJ, 646, 1098