Thermal Emission from a Hot Cocoon Surrounding the Jet of XRF 060218
XRF 060218 was detected with the Swift/Burst Alert Telescope (BAT) on 2006 February 18.149 UT. Swift slewed autonomously to the burst and the X-ray telescope (XRT) began to collect data 159 s after the burst trigger. We analyze the XRT data in the first orbit ( seconds since the burst trigger). We reduce the data with the Swift/XRT tools and process the spectrum with the Xspec software package. We first fit the time-integrated spectrum with a combined model of a single-temperature () black body model (BB model) normalized to its apparent area at a given distance and a single power law (; PL model), incorporating the neutral hydrogen absorbtion in both our Galaxy and the GRB host galaxy. The observed effective” black body radius” () could be inferred from the normalization term () of this model, km, where is the source distance in units of 10 kpc. The of our Galaxy[¡20¿] for this burst is cm-2. We find that the fitting results depend on the initial guess value of . If is assigned an initial guess value less than 1 keV, one can get the best fit results with keV, the thermal component identified by Campana et al.[¡9¿]. However, we also find marginally acceptable fitting results with a high- component with keV, if the initial guess value of is assigned greater than keV. We replace the single power law component with a broken power law model (BKNPL model) in our fitting, and find that the high- component stands out and the two photon indices of the broken power law are (fixed) and , respectively, with a break energy at keV. The photon spectrum with roughly agrees with a black body spectrum, being consistent with the low- component. This likely indicates that there exists two thermal components in the XRT data, with keV and keV, respectively. We then use a combined model with two thermal and one power law components (BB+BB+PL model) to fit the spectrum. The comparison of the fitting results with the BB+PL model and the BB+BKNPL model is shown in Table 1. It is found that besides the previous reported thermal component with (low- component)[¡9¿], a new thermal component (high- component) with keV is indeed present in the XRT data. Figure 1 shows the accumulated overall X-ray spectrum during the first orbit (159-2740 seconds since the burst trigger), with the contributions from the two thermal components marked. We derive the effective blackbody radii of the two thermal components as cm and cm, respectively, suggesting that the two thermal components are from two distinct emission regions.
The existence of two thermal components is also supported by a time-dependent spectral analysis of the X-ray data. The PL component derived from the BB+PL model shows an unreasonable hard-to-soft evolution feature, with the photon index continuously increasing from to since seconds (Fig.2). This implies a very peculiar electron distribution. The PL photon index derived from the BB+BB+PL model, on the other hand, does not show a significant evolution, with an average index of (Fig.2). The unexpected softening derived in the BB+PL model is therefore an artifact due to the contribution of the soft photons in the high- thermal component.
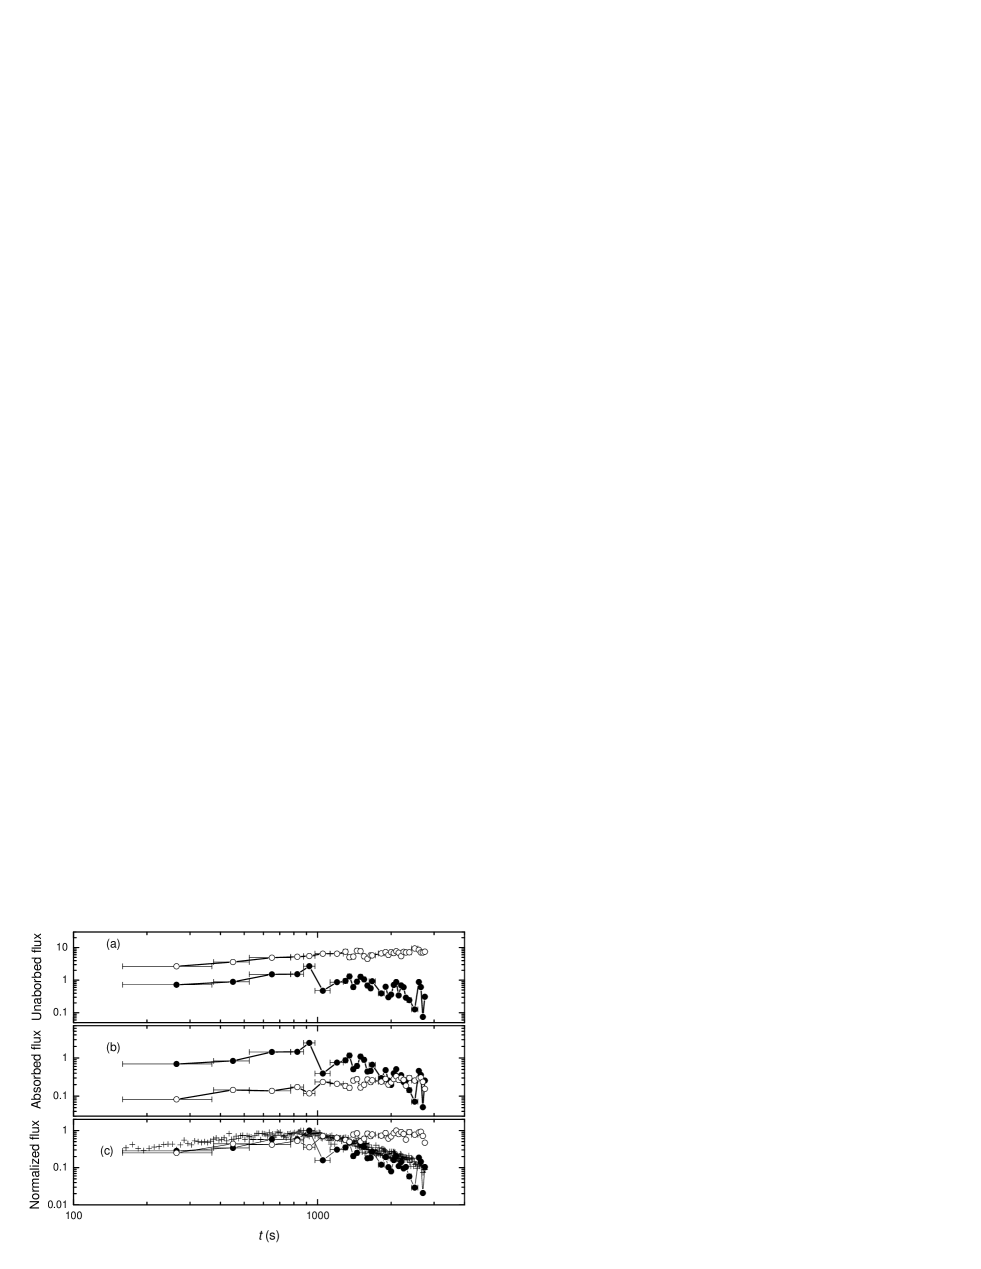
Our time-resolved spectral analysis reveals the evolution of the two thermal components. Figure 3 displays the temporal evolution of the temperatures and the effective blackbody radii of the two components. The high- component expands rapidly with and cools rapidly as , while the low- component expands more slowly with and only cools mildly as . We note, however, that the peak flux of the low- component is right at the low end of the XRT energy band where the absorption is very strong. It would be difficult to robustly measure the temperature evolution of this component. In Figure 4 we show both the unabsorbed and absorbed lightcurves of the two thermal components along with the non-thermal hard X-ray lightcurve in the 5-10 keV band. It is evident that the two components evolve independently. While the observed flux of the low- component increases with time, the flux of the high- component traces the non-thermal component. This suggests that the high- component is directly related with the GRB jet.
Numerical simulations of a relativistic jet propagating in the stellar envelope of a collapsing star reveals a hot cocoon surrounding the jet[¡4¿], which is the waste heat from the jet enclosed by the dense envelope. When the jet, which may be mildly relativistic inside the star, first penetrates through the stellar envelope, the associated cocoon also breaks out and their thermal photons leak out. This hot thermal ring surrounding the jet then subsequently expands, both forwardly and in sideways, as the rest of jet bores its way out, The cocoon luminosity should roughly trace the non-thermal emission luminosity of the jet. This picture is in good agreement with the data of the high- thermal component. Combined with the low- component that has been interpreted as the shock breakout emission of the global supernova [¡9¿], our result clearly suggests that there exist three components during the explosion of a dying massive star. Besides the more isotropically expanding supernova ejecta, there are indeed a collimated jet breaking through the envelope and producing the non-thermal emission and a hot thermal cocoon component associated with it.
Assuming that the radius of the low- component cm is also roughly the radius of the exploding star, the high- component then opens a very small solid angle of . The radius of the star may be smaller than , but in any case, it is unlikely that this solid angle reflects the solid angle of the relativistic jet, which should be very broad according to the late afterglow data[¡15¿, ¡21¿] and population studies[¡22¿, ¡14¿]. A possible picture is that the cocoon surrounding the jet forms a thin ring with a small solid angle. This is much narrower than the predicted values in numerical simulations[¡4¿]. However, XRF 060218 has a much lower luminosity than the modelled typical collapsars. With much less waste heat surrounding an under-luminous jet, the cocoon could be in principle much thinner.
| Model | cm-2) | (keV) | (keV) | ||||||
|---|---|---|---|---|---|---|---|---|---|
| BB+PL | 1.55 | - | - | ||||||
| BB+BB+PL | 1.53 | - | - | ||||||
| BB+BKNPL | 1.52 | - | - | (fixed) |
References
- [¡1¿] Woosley, S. E., et al. Gamma-ray bursts from stellar mass accretion disks around black holes. Astrophys. J. 405, L273-L277 (1993)
- [¡2¿] Paczýnski, B. Are Gamma-Ray Bursts in Star-Forming Regions? Astrophys. J. 494, L45-L48 (1998)
- [¡3¿] MacFadyen, A. I.& Woosley, S. E. Collapsars: Gamma-Ray Bursts and Explosions in “Failed Supernovae”. Astrophys. J. 524, 262-289 (1999)
- [¡4¿] Zhang, W., Woosley, S. E., MacFadyen, A. I. Relativistic Jets in Collapsars. Astrophys. J. 586, 356-371 (2003)
- [¡5¿] Galama, T. J. et al. An unusual supernova in the error box of the gamma-ray burst of 25 April 1998. Nature 395, 670-672 (1998)
- [¡6¿] Kulkarni, S. R., et al. Radio emission from the unusual supernova 1998bw and its association with the gamma-ray burst of 25 April 1998. Nature 395, 663-669 (1998)
- [¡7¿] Stanek, K. Z., et al. Spectroscopic Discovery of the Supernova 2003dh Associated with GRB 030329. Astrophys. J. , 591, L17-L20 (2003)
- [¡8¿] Hjorth, J., et al. A very energetic supernova associated with the gamma-ray burst of 29 March 2003. Nature 423, 847-850 (2003)
- [¡9¿] Campana, S., et al. The shock break-out of GRB060218/SN2006aj. Nature , in press (2006)
- [¡10¿] Modjaz, M., et al. early-time photometry and spectroscopy of the fast evolution SN 2006aj associated with GRB 060218. Astrophys. J. , in press (astro-ph/0603377)(2006)
- [¡11¿] Pian, E., et al. Gamma-Ray Burst associated Supernovae: Outliers become Mainstream. Nature , submitted (2006)
- [¡12¿] Sollerman, J., et al. Supernova 2006aj and the associated X-Ray Flash 060218. Astron. Astrophys. , in press(astro-ph/0603495)(2006)
- [¡13¿] N. Mirabal, Halpern, J. P. , An, D., Thorstensen, J. R., & Terndrup, D. M. GRB 060218/SN 2006AJ: a gamma-ray burst and prompt supernova at z = 0.0335. Astrophys. J. , in press(astro-ph/0603686)(2006)
- [¡14¿] Cobb, B. E., Bailyn, C. D., van Dokkum, P. G., Natarajan, P. SN 2006aj and the nature of low-luminosity gamma-ray bursts. Astrophys. J. , in press (astro-ph/0603832)(2006) .
- [¡15¿] Soderberg, A. M. , et al. Relativistic ejecta from XRF 060218 and the complete census of cosmic explosions. Nature , submitted(astro-ph/0604389)(2006)
- [¡16¿] Woosley, S. E., Eastman, R. G., Schmidt, B. P. Gamma-Ray Bursts and Type IC Supernova SN 1998BW. Astrophys. J. 516, 788-796 (1999)
- [¡17¿] Mészáros, P.& Rees, M. J. Collapsar Jets, Bubbles, and Fe Lines. Astrophys. J. 556, L37-40 (2001)
- [¡18¿] Ramirez-Ruiz, E., Celotti, A., Rees, M. J. Events in the life of a cocoon surrounding a light, collapsar jet, MNRAS 337, 1349-1356(2002)
- [¡19¿] Waxman, E. & Mészáros, P. Collapsar uncorking and jet eruption in gamma-ray bursts. Astrophys. J. 584, 390-398 (2003)
- [¡20¿] Dickey, J. M.& Lockman, F. J. HI in the Galaxy. ARA&A 28, 215-261 (1990)
- [¡21¿] Fan, Y. Z., Piran, T., & Xu D. The Interpretation and Implication of the Afterglow of GRB 060218. astro-ph/0604016
- [¡22¿] Liang, E. W., Zhang, B., & Dai, Z. G. Low Luminosity Gamma-Ray Bursts as a Unique Population: Luminosity Function, Local Rate, and Beaming Factor, Astrophys. J. , submitted (astro-ph/0605200) (2006)
Figure 1 The observed spectra of the XRT data accumulated in the first orbit (150-2740 seconds since the burst trigger) and of the contributions from the two thermal components derived from the BB+BB+PL model fitting.
Figure 2 The evolution of the power law photon indices () in the BB+PL model (open circle) and the BB+BB+PL model (solid circle), respectively. While the BB+PL case shows a strong evolution of , no apparent evolution is revealed in the BB+BB+PL case, with an average .
Figure 3 The evolution of the blackbody emission radii () and temperatures () of the low- (open circles) and high- (solid circles) components, respectively, derived from the time-resolved spectral analysis. The solid and dashed lines are the regression lines for the high- and low- components, respectively. In our spectral analysis we first divide the XRT data into 50 temporal segments. Each segment covers seconds. We generally require that the spectral bins are doe each segment. Some segments have a significantly smaller number of spectral bins. We then merge these segments with their adjacent ones. We finally obtain 32 temporal segments. The error bar in the time axis marks the time interval of each segment. We fit the spectrum with the BB+BB+PL model. In the time-resolved spectral analysis the of the host galaxy is taken as cm-3 without considering its temporal evolution.
Figure 4 The unabsorbed (a) and absorbed (b) light curves of the two thermal components derived from the time-resolved spectral analysis with the BB+BB+PL model and their comparisons with the light curve of the non-thermal component in 5-10 keV band (c). The fluxes are in units of erg cm-2 s-1.


Correspondence and requests for materials should be addressed to Enwei Liang (lew@physics.unlv.edu) and Bing Zhang (bzhang@physics.unlv.edu).