First observations with CONDOR, a 1.5 THz heterodyne receiver
Abstract
Context. The THz atmospheric “windows,” centered at roughly 1.3 and 1.5 THz, contain numerous spectral lines of astronomical importance, including three high-J CO lines, the [N II] line at 205 m, and the ground transition of para-H2D+. The CO lines are tracers of hot (several 100 K), dense gas; [N II] is a cooling line of diffuse, ionized gas; the H2D+ line is a non-depleting tracer of cold (20 K), dense gas.
Aims. As the THz lines benefit the study of diverse phenomena (from high-mass star-forming regions to the WIM to cold prestellar cores), we have built the CO N+ Deuterium Observations Receiver (CONDOR) to further explore the THz windows by ground-based observations.
Methods. CONDOR was designed to be used at the Atacama Pathfinder EXperiment (APEX) and Stratospheric Observatory For Infrared Astronomy (SOFIA). CONDOR was installed at the APEX telescope and test observations were made to characterize the instrument.
Results. The combination of CONDOR on APEX successfully detected THz radiation from astronomical sources. CONDOR operated with typical T K and spectral Allan variance times of 30 s. CONDOR’s “first light” observations of CO 13-12 emission from the hot core Orion FIR4 (= OMC1 South) revealed a narrow line with T K and km s-1. A search for [N II] emission from the ionization front of the Orion Bar resulted in a non-detection.
Conclusions. The successful deployment of CONDOR at APEX demonstrates the potential for making observations at THz frequencies from ground-based facilities.
Key Words.:
Instrumentation: detectors – Methods: observational – Submillimeter – Stars: formation – HII regions – Orion FIR41 Introduction
CONDOR (CO N+ Deuterium Observations Receiver) is currently one of the very few instruments that can observe at Terahertz (THz) frequencies. The scarcity of astronomical data in the THz frequency regime (1-10 THz, 300-30m) is due to the difficulty of building receivers for these frequencies, and – for ground-based observatories – also due to the poor transmission of the Earth’s atmosphere (e.g., Pardo et al. pardo (2004)).
Currently, the only astronomical, heterodyne data above 1 THz obtained from the ground are from the Heinrich Hertz Telescope (HHT) at 1.0 THz (Kawamura et al. 2002) and the Receiver Laboratory Telescope (RLT) at 1.0 and 1.5 THz (Marrone et al. 2004, 2006). In addition, [N II] emission (1.5 THz) was detected with moderate spectral resolution by the South Pole Imaging Fabry-Perot Interferometer (SPIFI) from the Antarctic Submillimeter Telescope and Remote Observatory (AST/RO) (Stacey 2005). There is also a 1.3 THz and 1.5 THz heterodyne receiver for APEX under construction at Chalmers University. The Kuiper Airborne Observatory (KAO) pioneered FIR spectroscopy, initially with incoherent instruments and moderate velocity resolution (e.g. Stutzki et al. 1988, Petuchowski et al. 1994) and later with a heterodyne receiver (e.g., Boreiko & Betz 1993). The Infrared Space Observatory (ISO) observed numerous lines in many galactic and extragalactic sources at low velocity resolution (e.g., van Dishoeck 2004 and references therein) and the Cosmic Background Explorer (COBE) (e.g., Fixsen, Bennett, & Mather 1999) demonstrated the large extent of several of the important cooling lines of the ISM.
These observations have demonstrated that studies of many astronomical phenomena greatly benefit from data at THz frequencies. In order to explore the universe at THz frequencies and encouraged by both advances in mixer technology and the capabilities of the Atacama Pathfinder Experiment (APEX111This publication is based on data acquired with the Atacama Pathfinder Experiment (APEX). APEX is a collaboration between the Max-Planck-Institut für Radioastronomie, the European Southern Observatory, and the Onsala Space Observatory.) (Güsten et al. 2006) we have built CONDOR.
2 The CONDOR Receiver
The realization of CONDOR faced two major technological challenges. First, local oscillators (LOs) that are stable and have sufficient power are difficult to build. Second, for these high frequencies, the most sensitive mixers are Hot Electron Bolometers (HEBs), but these are difficult to operate.
CONDOR has two exchangeable solid state LO’s. Radiometer Physics GmbH manufactured a LO consisting of a Gunn oscillator ( GHz) followed by a tripler and a quadrupler. The LO fabricated by Virginia Diode Inc. uses a YIG signal around 20 GHz that is doubled, amplified, and then multiplied by a factor of 36. Both deliver a signal of a few W, enough to pump the mixer if little power is lost. A Martin-Puplett (MP) interferometer was used to overlay the signal with the LO beam, thus transmitting % of the LO power.
We employed a superconducting HEB mixer designed and fabricated at the Universität zu Köln (Muñoz et al. 2004). The NbTiN HEB was fabricated on a thin membrane substrate, which is mounted in a waveguide mixer block. The mixer covers a broad radio frequency (RF) band of 200 GHz and has no tuning elements. A theoretical analysis suggests a side band ratio of about 1, as the HEB looks resistive to the RF input and has no high-Q matching. Measurements of the intermediate frequency (IF) bandwidth do not show a roll-off up to 2 GHz. However, currently, CONDOR’s IF bandwidth is limited to 1.1–1.8 GHz by a partially dysfunctional isolator placed between the HEB and the first amplifier to improve the impedance matching. Ultimately, CONDOR can be tuned to frequencies between 1.250–1.530 THz.
CONDOR is the first receiver to cool a HEB in a closed-cycle system, in order to enable easy operation at a remote site such as the Atacama desert. HEBs are very sensitive to temperature variations, as well as mechanical vibrations, which cause LO power fluctuations. Since a Pulse Tube Cooler has less mechanical vibration than, e.g., a Gifford McMahon refrigerator, it was chosen for CONDOR. To reduce the vibrations further, the mixer mount was decoupled with flexible straps. By inserting heat barriers, the short term (1 min) thermal fluctuations could be reduced below 1 mK (Wieching et al. in prep.). A more detailed description of CONDOR and all laboratory tests will be given in Wiedner et al. (in prep).
3 CONDOR on APEX
Installation of CONDOR on APEX: In November 2005, CONDOR was installed in the Nasmyth-A cabin at APEX. CONDOR’s optics were aligned to APEX by tracing the THz beam with a cold load at various locations along the optical path. The APEX synthesizer, which includes the Doppler tracking correction, was used to lock CONDOR’s Phase Lock Loop (PLL). CONDOR’s IF was upconverted and analyzed by APEX’s Fast Fourier Transform Spectrometer (FFTS). The FFTS has 16383 channels covering 1 GHz bandwidth (Klein et al. 2006).
Performance at the telescope: The DSB receiver temperature across the IF band was 1600 K (upper panel in Figure 1). The spectroscopic Allan variance was calculated from 40 neighboring channels, each 1 MHz wide. The Allan variances had minimum times of 25-30 s (lower panel in Figure 1), so that the optimum on- and off-source integration times are also of this order (Schieder & Kramer 2001).

Beam: A main beam size of 4.3″ was calculated from the measured edge taper on the secondary (-16.8dB) and the dish size (12 m) (Goldsmith 1998). Because the individual panels (0.7 m) of the APEX dish are fabricated to an accuracy of 5m, which is much higher than the rms of 18m of the entire dish, the CONDOR beam is expected to consist of a main beam of 4.3″ and an error beam of 72″ FWHM. (For a discussion of the beams at different frequencies see Güsten et al. 2006.)
Pointing & Focusing: From drift scans of Mars, we estimate a pointing accuracy better than 7″ for Orion. The beam focus was set by adjusting APEX’s secondary mirror to the position that maximized the flux measured from Mars.
Calibration: To set the temperature scale of the observations, we used the APEX facility calibration unit with an ambient and a cold load. Because the cold load window transmits imperfectly at 1.5 THz, the cold load temperature was first calibrated with an external liquid nitrogen load.
We determined the atmospheric transmission using a sky/hot/cold-measurement at the observing frequency. We estimate an error of 20% for the transmission.
In the last step, the coupling of the telescope beam to sources of different sizes (sky, the Moon and Mars) was determined. From sky dips a forward efficiency (Feff) of 0.8 was deduced. We define a source coupling efficiency = T Feff / J(Tsource), where J(Tsource) is the RJ temperature of the source. For the Moon (using J(TMoon)=342 K for the full Moon) we obtain a coupling efficiency of 0.4. The individual Mars (J(TMars)=204 K) scans have low signal to noise and may suffer from anomalous refraction. Depending on which scans are averaged we obtain an antenna temperature (T) between 24 and 32 K. This results in coupling and main beam efficiencies (here these are very similar because Mars is small) between 0.09 and 0.13 and aperture efficiencies of 0.07 to 0.10 (Kramer 1997). In this paper, we will use the lower Mars coupling efficiency of 0.09. This gives an upper limit to the source brightness temperature. Sources larger than Mars (18.2″ ) will couple better to the telescope, and calculations with the Moon efficiency give lower limits on their brightness temperatures.
Due to the uncertainties in the THz transmission of the atmosphere and the difficulties in determining the beam shape and the efficiencies, we cannot exclude that the calibration may be inaccurate by a factor of 2 for these first test observations.
4 Observations
CONDOR’s first observations on a scientific target were made on 2005 November 20 under excellent weather conditions. Atmospheric transmission at the elevation of the source (57∘) was 19%. The CO 13-12 emission line at THz (Müller, et al. 2005) was detected from a hot core in OMC-1 with a total on-source time of 5.8 min. The core, centered at R.A.(J2000), Dec(J2000) , is known alternatively as Orion~FIR4 (Mezger et al. 1990), Orion~S (Ziurys & Friberg 1987), and S6 (Batrla et al. 1983) and lies either at or near the interface of the Orion A (M42) H II region and a region of compressed molecular material. The broad widths of numerous molecular emission lines (e.g. Batrla et al. 1983, Mundy et al. 1986) indicate that Orion FIR4 is a site of high mass star formation. Emission from both FIR fine-structure lines (Herrmann et al. 1997) and high-J CO lines (Schmid-Burgk et al. 1990b) identify a hot gas component with T K. Estimates of the density of the core range from cm-3 to cm-3. The lower values come from radiative transfer models of the [O I] and [C II] emission (Herrmann et al. 1997), as well as models of the SiO and C34S emission (Ziurys et al. 1990); the upper values are based upon 1.3 mm dust emission (Mezger et al. 1990). The shock-stimulated SiO emission (Ziurys & Friberg 1987; Ziurys et al. 1990) shows Orion FIR4 at the vertex of a system of outflows with a velocity range of km s-1 (Schmid-Burgk et al. 1990a, Wilson et al. 2001, McMullin et al. 1993).
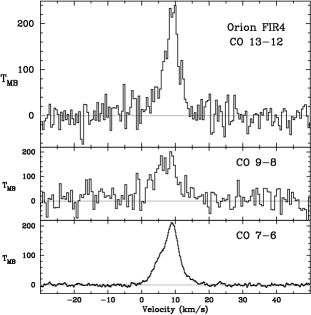
The CONDOR spectrum of Orion FIR4 (Figure 2) is smoothed to a velocity resolution of 0.49 km s-1 and has an rms noise level of 22 K. The temperature scale is set by assuming a main beam efficiency equal to the coupling efficiency to Mars (). A single Gaussian function fitted to the emission line has a peak of T K, a FWHM of km s-1, and a central velocity of V km s-1.
The width of the CO 13-12 line is less than the widths of mid-J CO lines observed from Orion FIR4, and there is little evidence for extended line wings (e.g. Rodríguez-Franco et al. 1999), suggesting that the CO 13-12 emission is more likely energized by radiation from the embedded protostar(s) than from interactions with outflows. In addition, the CO line is unlikely to stem from molecular formation in the post shock phase of a C-type shock, as the CO abundance hardly increases (Bergin, Neufeld & Melnick 1998)). The CO 13-12 line width matches the “quiescent” component ( km s-1) identified in CO 7-6 emission by Wilson et al. (2001) throughout the OrionKL/Orion FIR4 region, but the CO 7-6 line from an 18″ beam centered at Orion FIR4 (see Figure 2) is wider and asymmetrical. The CO 9-8 emission from Orion FIR4 (8.5″ beam) has a width of 8.5 km s-1 (see Figure 2), but Kawamura et al. (2002) identify this line as a blend of two components at V and 6.0 km s-1. In the CO 13-12 spectrum, a second Gaussian at V km s-1 could have a maximum of 10% of the intensity of the component at V km s-1.
To estimate the physical properties of the emitting region, we used the fluxes from multiple CO transitions as input to the escape probability code developed by Stutzki and Winnewisser (1985). The code models line fluxes as a function of density, kinetic temperature, and molecular column density. We assumed a width of 5 km s-1 for all lines, and for the (velocity-resolved) CO 7-6 and CO 9-8 spectra we used only the contribution to the flux (determined from a Gaussian fit) from a component at V km s-1. Based on the maps of Wilson et al. (2001) and Marrone et al. (2004), the CO 7-6 and CO 9-8 emission fills the respective beams (see above). In addition, we assumed (initially) that the emission from the higher-J CO lines fills the 80″ ISO beam (Sempere et al. 2000). The range of CO 13-12 fluxes shown in Figure 3 is set by the range of main beam efficiencies: the lower limit comes from using the coupling efficiency of the Moon (), the upper from that of Mars ().
Although the code indicated a range of possible fits, the most likely fit corresponded to a density of cm-3, a temperature of T K, and total CO column density of cm-2. The assumption that the ISO beam is filled means that the value for is a minimum; in tests where we considered only partial filling of the ISO beam ( down to 0.1), the best-fit density increased to cm-3. This range of values lies within the range ( cm-3) determined from the other CO line studies.

Our attempt to detect [N II] emission was unsuccessful. We observed a position along the ionization front of the Orion Bar (R.A.(J2000), Dec(J2000) , offset ) on 2005 November 29. The transmission at the mean source elevation (66∘) was 18% at the [N II] line frequency, THz (Brown et al. 1994). A spectrum from 30 min of on-source integration time, smoothed to a channel width of 0.5 km s-1, yielded a rms noise level of 2.8 K. In contrast to the Orion FIR4 spectrum, the temperature scale was set by assuming a main beam efficiency equal to the Moon coupling efficiency (). To estimate the significance of the non-detection, we assume that the [N II] emission fills the main beam and first error beam. If we further assume that the [N II] line width is equivalent to the widths of the C91 recombination line (2.5 km s-1, Wyrowski et al. 1997), a detection would correspond to an integrated flux of . Thus, the [N II] flux from the Orion Bar cannot be much greater than that from the H II region G333.6-0.2, where a flux of was detected with the KAO (Colgan et al. 1993). If, instead, the [N II] line width is represented by the widths of e.g. the [O III] 5007 Åtransition (20 km s-1), Seema 1996), then the spectrum can be smoothed to a resolution of 4.0 km s-1 to reduce the noise to 1.2 K and the detection corresponds to an integrated flux of .
5 Summary and Conclusions
CONDOR has been successfully deployed on the APEX telescope. CONDOR operated with typical T K and spectral Allan variance times of 30 s. CONDOR’s first light observations detected CO 13-12 emission from Orion FIR4. The line has a peak of 210 K and a width of 5 km s-1 Uncertainties in the beam shape and source extent make the temperature scaling uncertain, but the line width is clearly smaller than that of lower-J CO lines. The core density and temperature indicated by the CO 13-12 emission are consistent with values determined from other CO observations. The narrow width of the high-J line indicates that the excitation of this warm, dense material is due to photo-heating rather than shocks. CONDOR failed to detect [N II] emission from the Orion Bar.
Acknowledgements.
We thank the APEX team for their enormous support. Only with their efforts was the success of CONDOR on APEX possible. We also thank J. Kawamura and T. Wilson for allowing us to present their CO 9-8 and CO 7-6 data of Orion FIR4. The CONDOR receiver was built by the Nachwuchsgruppe of the Sonderforschungsbereich 494, which is funded by the Deutsche Forschungsgemeinschaft (DFG).References
- (1) Bergin, E. A., Neufeld, D. A., & Melnick, G. J. 1998, ApJ, 499, 777
- Batrla et al. (1983) Batrla, W., Wilson, T. L., Bastien, P., & Ruf, K. 1983, A&A, 128, 279
- Brown et al. (1994) Brown, J. M., Varberg, T. D., Evenson, K. M., & Cooksy, A. L. 1994, ApJ, 428, L37
- Boreiko & Betz (1993) Boreiko, R. T., & Betz, A. L. 1993, ApJ, 405, L39
- Colgan et al. (1993) Colgan, S. W. J., Haas, M. R., Erickson, E. F., Rubin, R. H., Simpson, J. P., & Russell, R. W. 1993, ApJ, 413, 237
- Fixsen, Bennett, & Mather (1999) Fixsen, D. J., Bennett, C. L., & Mather, J. C. 1999, ApJ, 526, 207
- (7) Goldsmith, F. 1998, Quasioptical Systems, IEEE Press, New York
- (8) Güsten, R. et al. 2006, A&A this issue
- Herrmann et al. (1997) Herrmann, F., Madden, S. C., Nikola, T., Poglitsch, A., Timmermann, R., Geis, N., Townes, C. H., & Stacey, G. J. 1997, ApJ, 481, 343
- Kawamura et al. (2002) Kawamura, J., Hunter, T. R., Tong, C.-Y. E., Blundell, R., Papa, D. C., Patt, F., Peters, W., Wilson, T. L., Henkel, C., Gol’tsman G., & Gershenzon, E. 2002, A&A, 394, 271
- (11) Klein, B. et al. 2006, A&A, this issue
- Kramer (1997) Kramer, C. 1997, IRAM Memo
- Marrone et al. (2004) Marrone, D. P., Battat, J., Bensch, F. B., Blundell, R., Diaz, M., Gibson, H., Hunter, T., Meledin, D., Paine, S., Papa D. C., Radford, S., Smith, M., & Tong, E. 2004, ApJ, 612, 940
- Marrone et al. (2006) Marrone, D. P., Blundell, R., Tong, E., Paine, S. N., Loudkov D., Kawamura, J. H., Lühr, D., & Barrientos, C. 2006, in IEEE 16th Int’l Symp. on Space THz Tech., eds. J. Stake, H. Merkel (Göteborg: Chalmers)
- McMullin, Mundy, & Blake (1993) McMullin, J. P., Mundy, L. G., & Blake, G. A. 1993, ApJ, 405, 599
- Mezger, Wink, & Zylka (1990) Mezger, P. G., Wink, J. E., & Zylka, R. 1990, A&A, 228, 95
- Müller, et al. (2005) Müller, H. S. P., Schlöder, F., Stutzki, J, & Winnewisser, G. 2005, J. Mol. Struct., 742, 215
- Mundy et al. (1986) Mundy, L. G., Scoville, N. Z., Baath, L. B., Masson, C. R., & Woody, D. P. 1986, ApJ, 304, L51
- Muñoz et al. (2004) Muñoz, P. P., Bedorf, S., Brandt, M., Tils, T., Honingh, N., Jacobs, K. 2004, SPIE, 5498, 834
- Petuchowski et al. (1994) Petuchowski, S. J., Bennett, C. L., Haas, M. R., Erickson, E. F., Lord, S. D., Rubin, R. H., Colgan, S. W. J., Hollenbach, D. J. 1994, ApJ, 427, L17
- Rodríguez-Franco, Martín-Pintado, & Wilson (1999) Rodríguez-Franco, A., Martín-Pintado, J., & Wilson, T. L., 1999, A&A, 344, L57
- (22) Pardo, J. R. Wiedner, M. C., Serabyn, E., Wilson, C. D., Hills, R. E., & Cernicharo, J. 2004, ApJS, 153, 363
- Ruze (1966) Ruze, R. 1966, Proc. IEEE, 54, No. 4, 633
- Schieder & Kramer (2001) Schieder, R. & Kramer, C. 2001, A&A, 373, 746
- Schmid-Burgk et al. (1990a) Schmid-Burgk, J., Güsten, R., Mauersberger, R., Schulz, A. & Wilson, T. L. 1990a, ApJ, 362, L25
- Schmid-Burgk et al. (1990b) Schmid-Burgk, J., Röser, H. P., Schwaab, G. W., & Titz, R. U. 1990b, Proc. 29th Liège Int’l Astroph. Conf., 193
- (27) Seema, P. 1996, PASP, 108, 461
- Sempere et al. (2000) Sempere, M. J., Cernicharo, J., Lefloch, B., González-Alfonso, E., & Leeks, S. 2000, ApJ, 530, 123
- Stutzki et al. (1988) Stutzki, J., Stacey, G. J., Genzel, R., Harris, A. I., Jaffe, D. T., Lugten, J. B. 1988, ApJ, 332, 379
- (30) Stacey, G. 2005, private communication
- Stutzki & Winnewisser (1985) Stutzki, J. & Winnewisser, G. 1985, A&A, 144, 13
- van Dishoeck (2004) van Dishoeck, E. F. 2004, ARA&A, 42, 119
- (33) Wieching, G. et al. in prep.
- (34) Wiedner, M. C. et al. in prep.
- Wilson et al. (2001) Wilson, T. L., Muders, D., Kramer, C., & Henkel, C. 2001, ApJ, 557, 240
- Wyrowski et al. (1997) Wyrowski, F., Schilke, P., Hofner, P., & Walmsley, C. M. 1997, ApJ, 487, 171
- Ziurys & Friberg (1987) Ziurys, L. M., & Friberg, P. 1987, ApJ, 314, L49
- Ziurys, Wilson, & Mauersberger (1990) Ziurys, L. M., Wilson, T. L., & Mauersberger, R. 1990, ApJ, 356, L25