Water masers in the Local Group of galaxies
We compare the number of detected 22 GHz H2O masers in the Local Group galaxies M31, M33, NGC 6822, IC 10, IC 1613, DDO 187, GR8, NGC 185, and the Magellanic Clouds with the water maser population of the Milky Way. To accomplish this we searched for water maser emission in the two Local Group galaxies M33 and NGC 6822 using the Very Large Array (VLA) and incorporated results from previous studies. We observed 62 Hii regions in M33 and 36 regions with H emission in NGC 6822. Detection limits are 0.0015 and 0.0008 L⊙ for M33 and NGC 6822, respectively (corresponding to 47 and 50 mJy in three channels with 0.7 km s-1 width). M33 hosts three water masers above our detection limit, while in NGC 6822 no maser source was detected. We find that the water maser detection rates in the Local Group galaxies M31, M33, NGC 6822, IC 1613, DDO 187, GR8, NGC 185, and the Magellanic Clouds are consistent with expectations from the Galactic water masers if one considers the different star formation rates of the galaxies. However, the galaxy IC 10 exhibits an overabundance of masers, which may result from a compact central starburst.
Key Words.:
1 Introduction
Galactic water maser emission, discovered by ?), is mainly associated with star forming regions and late type stars. In star forming regions the masers are found in the vicinity of compact Hii regions (Genzel & Downes (1977)). Observations of these maser sources trace extremely dense (cm-3) and warm ( K) molecular gas and yield important information about physical and dynamical properties of their environments. They can also be used to measure accurate annual parallaxes and proper motions of star forming regions using Very Long Baseline Interferometry (VLBI) (e.g. Hachisuka et al. (2006)). While more than one thousand water masers are known in the Milky Way Valdettaro et al. (2001), only a small number are known in other Local Group galaxies.
The first extragalactic water maser was discovered by ?) in IC 133, a star forming region in the Local Group galaxy M33. Further water masers in Local Group galaxies were found towards the Magellanic Clouds (e.g. Scalise & Braz (1981)) and IC 10 (e.g. Becker et al. (1993)). Searches toward M31 Greenhill et al. (1995); Imai et al. (2001) and other Local Group galaxies Huchtmeier et al. (1980); Greenhill et al. (1990) have not yet yielded a detection. Beyond the Local Group, water masers are found mainly toward active galactic nuclei (see Zhang et al. (2006), and Kondratko (2006) for a list, and http://www.cfa.harvard.edu/wmcp/surveys/survey.html for an updated list).
Proper motion measurements and accurate distances of Local Group galaxies are important for our understanding of the dynamics and evolution of the Local Group. With the NRAO111The National Radio Astronomy Observatory is operated by Associated Universities, Inc., under a cooperative agreement with the National Science Foundation. Very Long Baseline Array (VLBA) ?) measured the proper motions of two regions of water maser activity on opposite sides of M33. The comparison of the relative proper motion between the two regions and the expected motion from the known rotation curve and inclination of M33 led to a determination of a rotational parallax (730 168 kiloparsecs) of this galaxy. This distance is consistent with recent Cepheid and tip of the red giant branch estimates (Lee et al. (2002); McConnachie et al. (2005)) and earlier distance estimates using the internal motions of water masers in IC 133 Greenhill et al. (1993); Argon et al. (2004). Since the proper motion measurements were made relative to a distant extragalactic background source, the proper motion of M33 itself could also be determined. This measured proper motion of M33 is a first important step towards a kinematical model of the Local Group and was used to constrain the proper motion of the Andromeda Galaxy M31 Loeb et al. (2005).
The interpretation of the proper motions of water masers in Local Group galaxies may be limited by the unknown three dimensional peculiar motions of the star forming regions. In the Milky Way, peculiar motions of star forming regions can be 20 km s-1 as seen in W3(OH) (Xu et al. (2006)). Hence it is important to use multiple regions of maser activity for proper motion studies to constrain the systematic effect of peculiar motions. This lead us to search for water vapor masers towards 62 Hii regions in M33 with the NRAO Very Large Array (VLA).
A detection of maser sources in other Local Group galaxies would allow us to extend such studies considerably. Since the strongest maser emission from high-mass star froming regions in our Galaxy is typically 100 times stronger than emission from late-type stars, we targeted NGC 6822, a northern Local Group member with prominent star formation activity.
2 Observations
2.1 M33
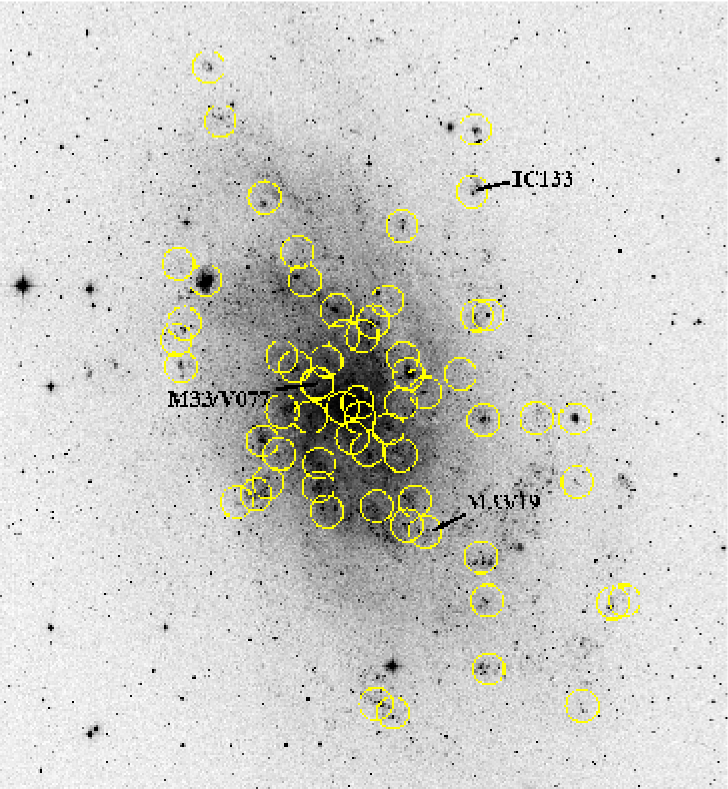
We selected Hii regions which also have Hii velocity measurements (Zaritsky et al. (1989)) and are also identified through their radio continuum emission by ?) with flux densities above 0.5 mJy at 1.4 GHz. We also added NGC 588 and six Hii regions from ?) that are either bright at radio frequencies (1.8 mJy) or are located in the outer parts of M33 (the last six sources in Table 2). The two maser sources in M33 from our VLBA observations Brunthaler et al. (2005), M33/19 and IC 133 , were observed to ensure correct telescope and receiver operation and to investigate time variabilty. The 62 observed fields are listed in Tables 2 and 3 and are shown in Fig. 1. Here the source name M33/V001 stands for source 001 from the source list in ?).
The observations were made with the VLA in A-configuration on 15 September and 18 November 2004 and lasted 7.5 and 6 hours, respectively. The source 3C 48 was the primary flux density calibrator. We used fast switching, spending 120 seconds on the target and 60 seconds on a reference source (3C 48) for a total of 12 minutes for each source in the first observation and 9 minutes in the second observation. The integration time was 3 seconds. The observations were made with a total bandwidth of 6.25 MHz and 128 spectral channels corresponding to a channel spacing of 0.7 km s-1. The band was centered at the velocity of the Hii gas for sources listed in ?). For sources with no velocity information, we calculated the expected radial velocity using the rotation model of M33 by ?). The uncertainty of the model is less than 15 km s-1 (see discussion in Brunthaler et al. (2005)) and much smaller than the covered velocity range of 84 km s-1.
2.2 NGC 6822
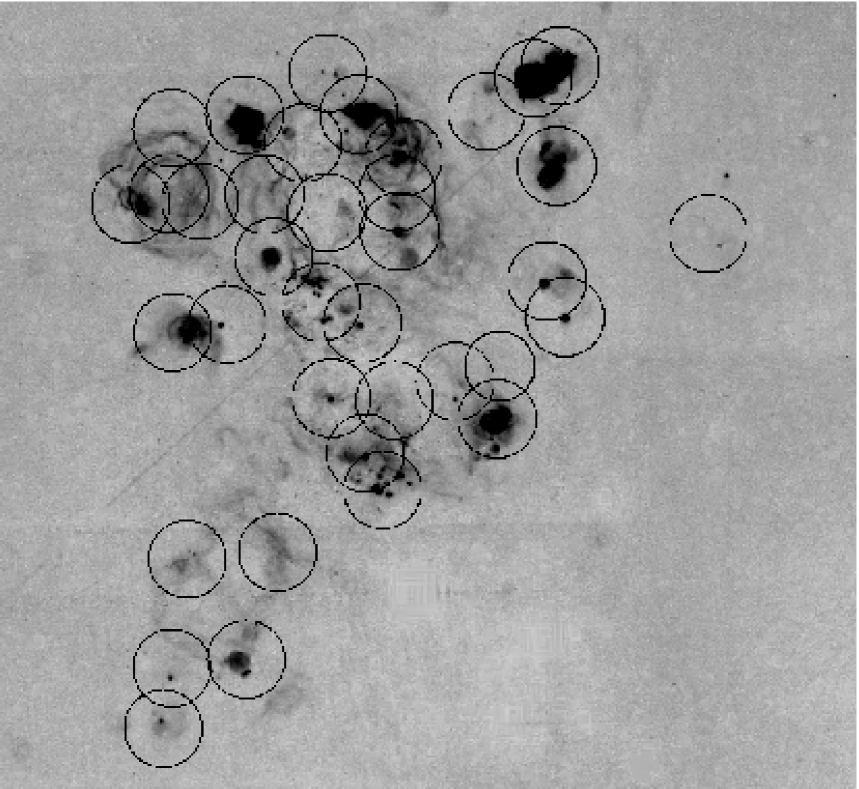
NGC 6822 was observed with the VLA in A-configuration on 13 March (2 hours), 25 March (2.5 hours), 31 March (2.5 hours), 10 April (2 hours), and 17 April 2006 (2.5 hours). We observed a total of 36 regions with H emission (Fig. 2 and Table 4). 3C 48 was also the primary flux density calibrator. The observations were similar to the observations of M33 with fast switching between the target (120 seconds) and the reference source 1939-154 (60 seconds) for a total of 12 minutes. We used the H I data from ?) to estimate the radial velocities of the gas at the different pointings.


3 Data Reduction and Results
The data for both galaxies were edited and calibrated with standard techniques in the Astronomical Image Processing System (AIPS). We used a source model generated by the AIPS task CALRD for the phase calibration on 3C 48 and a point source model for 1939-154. The primary beam of the VLA antennas at a frequency of 22 GHz has a full-width at half-maximum of 2 arcminutes. We mapped all frequency channels for each telescope pointing to half-power response of the primary beam with 40964096 pixels of 0.03”. The resulting data cubes were then searched for emission. We considered emission as real only if detected in at least three contiguous frequencies channels with a signal to noise ratio of or in a single channel at .
3.1 M33


We observed maser emission in two well known Hii regions, namely M33/V028 (IC 133), and M33/V033 (M33/19). These two maser sources have been studied in detail previously (see Greenhill et al. (1993); Argon et al. (2004); Brunthaler et al. (2005)). Other tentative water maser detections were reported in ?) and ?), of which we only confirm emission from M33/V077 (listed as M33/50 in Huchtmeier et al. (1988)). For this source we obtain a position of:
| (1) |
with an uncertainty of 0.1 arcseconds.
For all other regions we derived upper limits between 37 and 65 mJy per 0.7 km s-1 (see Tables 2 and 3) depending on the observing time and amount of flagged data, with an average value of 47 mJy. We did not detect a maser in M33/16 that was reported based on Effelsberg single-dish data in ?). M33/16 is located less than 30 arcseconds from the known maser in M33/19, so that an interferometer is needed to clearly discriminate between the two sources. The maser in M33/2 at km s-1 Huchtmeier et al. (1978, 1980) can not be confirmed.
In IC 133 the emission is found in two spatially distinct regions separated by 0.3 arcseconds, IC 133-Main and IC 133-West. The spectra of all detected sources are shown in Figs. 3, 4, 5, and 6. IC 133 and M33/V077 were observed in both observing periods, while M33/19 was observed only during the second period. IC 133 and M33/V077 show variability between the two observations. The peak flux densities of both sources dropped by 25%. For individual channels we find variations between 0 and % in IC 133 and between +70 and % in M33/V077. The large differences between individual channels show clearly that a major part of the variations are intrinsic to the maser sources and not caused by instrumental effects. Similar variations are common in Galactic water maser sources (e.g. Brand et al. (2005)) or in IC 10, where even intraday variations were found (Argon et al. (1994)) although interstellar scintillation can not be ruled out in IC 10.
The spectrum of IC 133-Main has a peak near km s-1 and a one-sided broad wing extending down to 240 km s-1 wich is similar to published spectra in the literature (see e.g. Huchtmeier et al. (1988) for several spectra between 1976 and 1985). The peak flux densities vary between 1 and 2 Jy and new features appear in the broad wing towards lower radial velocities on timescales of months to years. However, in the first epoch we detect weak emission with flux densities of 65 and 79 mJy (7.4 and 7.2 )at km s-1 and km s-1, respectively (see Fig 7). This weak emission is almost symmetrical to the strongest peak at km s-1. The detection of emission at km s-1 is to our knowledge the first time that emission at significantly higher radial velocities than the strong peak near km s-1 has been seen.


Fig. 8 shows the positions of the detected maser features in each velocity channel relative to the position of the brightest channel. In M33/19 and M33/V077 the emission in all frequency channels was found less than 20 miliarcseconds from the position of the brightest channel. In IC 133-Main one can clearly see that the emission is spatially extended with an extension towards the south east. Higher resolution VLBI observations of IC 133-Main have shown that IC 133-Main consists of two spatially separated regions of maser activity Greenhill et al. (1990); Brunthaler (2004, 2005), one with the strong emission at km s-1 and one is located 0.02 arcseconds towards the south-east with emission at velocities of to km s-1. The emission at km s-1 and km s-1 are located in the south-eastern and north-eastern tip of the region with maser emission, respectively.
In M33/V077 we also detect a weaker component at km s-1 that was not seen before. Follow-up VLBI observations will be needed to see whether or not this component originates toward the same region on scales of a few milliarcseconds as the km s-1 complex.
3.2 NGC 6822
No maser was detected in NGC 6822. We derived 5 upper limits between 36 and 78 mJy. On 31 March 2006 we detected an 8 peak in one frequency channel towards NGC 6822-S13. However, we do not consider this a firm detection, since it was found in only one channel and not confirmed in the observation of 10 April 2006. Please note that 5-7 peaks were found in almost every source, because of the large number () of independent beams for each pointing, while in the case of the high velocity components in IC 133 we have one additional constraint – the position.
4 Discussion
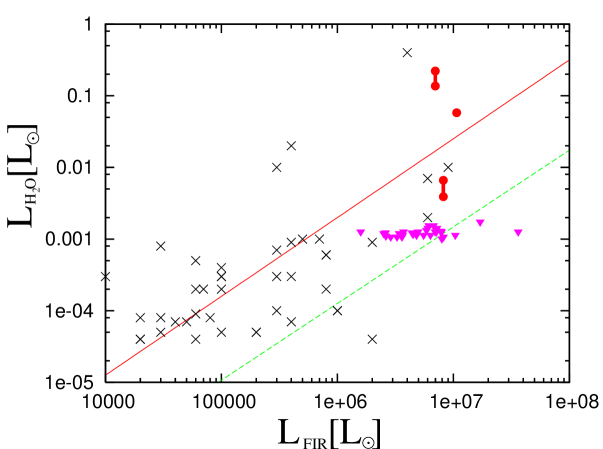
In Fig. 9, we plot the maser luminosity (isotropic emission assumed) versus the far-infrared (FIR) luminosity for the sources in our observations of M33. The FIR luminosities of the Hii regions were taken from ?). The FIR data in ?) has a spatial resolution of 240-400 pc in the 60-170 m range. Also plotted are the correlations found for Galactic water maser sources from ?). The solid line shows the correlation for detected maser sources. The dashed line shows the correlation if one considers also the Galactic non detections. Comparing the FIR luminosities of sources in M33 with Galactic sources is difficult, because of the low angular resolution of the FIR data from M33. The FIR luminosities will be overestimated if several Hii regions are blended within one beam. Using higher resolution (i.e. Spitzer) data might therefore move the points in Fig. 9 to the left. Hence, the FIR luminosity values in Fig. 9 are upper limits. Nevertheless, our results are in rough agreement with the brigthest masers of the Milky Way, given the large scatter of more than one magnitude in the Milky Way.
The detection limit for our search in M33 corresponds to 0.0015 L⊙ (47 mJy in three channels of 0.7 km s-1 width) for an assumed distance of 809 kpc (McConnachie et al. (2005)). ?) derive the luminosity function for the H2O masers in Galactic star forming regions to be
| (2) |
Using this luminosity function, one expects 12 masers with 0.0015 L⊙ in the Milky Way. This is reasonable close to the 9 known masers with 0.0015 L⊙ in the Milky Way from the list in ?). Repeating this analysis using the flux density detection limit instead of the maser luminosity detection limit yields similar but slightly lower numbers. For our Galaxy at the distance to M33 one would expect 8 masers with peak flux densities above 47 mJy. The slightly different value can be explained by sources with a total luminosity larger than 0.0015 L⊙ that show broad line profiles but have a lower peak flux. These sources would not be detected by our observations.
To better compare this with our detection rate in M33, one should account for the different star formation rates in the two galaxies. While the star formation rate in M33 is 0.33 – 0.69 M⊙ yr-1 (Hippelein et al. (2003)), the Milky Way has a star formation rate of 4 M⊙ yr-1 (Diehl et al. (2006)) while other studies give values between 0.8 M⊙ yr-1 (Talbot (1980)) and 13 M⊙ yr-1 (Guesten & Mezger (1982)). Assuming that the maser rate and star formation rate are roughly proportional, which is reasonable when cloud conditions and initial stellar mass functions are similar, one would expect a factor of to times less masers in M33 than in the Milky Way. For our detection limit of 0.0015 L⊙ we thus expect to find masers in M33. For the flux density detection limit of 47 mJy one expects to find masers in M33.
Our detection limit for NGC 6822 corresponds to 0.0008 L⊙ for a distance of 490 kpc (Mateo (1998)) and is a factor 10 better than previous searches Greenhill et al. (1990). Our Galaxy hosts 18 or 15 water masers with 0.0008 L⊙ or a peak flux density of more than 50 mJy, when viewed from a distance of 490 kpc. Scaled with the star formation rate of NGC 6822, which is 0.06 M⊙ yr-1 (de Blok & Walter (2006)), one expects to find masers in NGC 6822.
| Source | [L⊙] | N | SFR [M⊙ yr-1] | Nexpected |
|---|---|---|---|---|
| M33 | a) | 3 | 0.33-0.69 h) | 1–2 |
| NGC 6822 | a) | 0 | 0.06 i) | 0.3 |
| IC 10 | b) | 2 | 0.05 j) | 0.1 |
| SMC | c) | 2 | 0.05 k) | 0.4 |
| LMC | d) | 7 | 0.40 k) | 13.0 |
| M31 | e,f) | 0 | 0.35 l) | 0.5 |
| IC 1613 | e) | 0 | j) | |
| DDO 187 | e) | 0 | j) | |
| GR8 | e) | 0 | j) | |
| NGC 185 | g) | 0 | m) | 0.005 - 0.01 |
References: a) this work b) Becker et al. (1993); c) Scalise & Braz (1982); d) Lazendic et al. (2002); e) Greenhill et al. (1995) f) Imai et al. (2001); g) Huchtmeier et al. (1980); h) Hippelein et al. (2003); i) de Blok & Walter (2006); j) Hunter & Elmegreen (2004); k) Hatzidimitriou (1999); Israel (1980); l) Walterbos & Braun (1994); m) Martínez-Delgado et al. (1999)
We can repeat this analysis for other Local Group galaxies with water maser searches from the literature, namely IC 10, the Magellanic Clouds, M31, IC 1613, DDO 187, NGC 185, and GR8. The observational detection limits, observed detection rates, estimated star formation rates, and number of expected maser sources for the above mentioned galaxies are summarized in Table 1. The searches for maser sources in any of the star forming Local Group galaxies, except DDO187 and GR8 are not complete due to the large angular size of the galaxies. Thus, it is possible that additional masers are located in regions which were not measured. However, in the Milky Way the most luminous water masers are found in the largest star forming regions (see e.g. the maser luminosity - FIR luminosity correlation in Palagi et al. (1993)). Since the largest star forming regions were targeted in the maser searches at least in M33, M31, IC 1613, and NGC 6822 it is not likely that additional masers exist above the detection limits mentioned in Table 1.
The number of masers in all galaxies except IC 10 is consistent with the expected number of maser sources. However, IC 10 shows an overabundance. Possibly, star formation in this galaxy is concentrated in two particular regions near the center of the galaxy, where a small ’starburst’ creates conditions different from those expected from an average galaxy containing little molecular gas. Based on this analysis it is also not surprising that the previous maser searches in M31, IC 1613, DDO 187, and GR8 with flux density limits of a few hundred mJy, did not detect any masers.
5 Conclusion
We have searched for water maser emission with the VLA toward 62 and 36 Hii regions in M33 and NGC 6822, respectively. M33 hosts three water masers above our detection limit (all previously identified), while in NGC 6822 no maser source was detected. IC 133 and M33/V077 show velocity components that are displaced by several 10 km s-1 from previously observed maser features. We also provide an accurate position for M33/V077, while several previously reported marginal detections in M33 are not confirmed.
The number of known maser sources in the Local Group galaxies M31, M33, NGC 6822, SMC, LMC, IC 1613, DDO 187, NGC 185, and GR8 is consistent with the expected number of maser sources based on the Galactic water maser luminosity function and the current star formation rates. Only the galaxy IC 10 shows a much higher detection rate than expected.
Based on this analysis one can expect to find 17 and 5 water masers with flux densities above 1 mJy in M31 and NGC 6822, respectively, that could be used to measure the proper motions and geometric distances of these galaxies with future radio telescopes like the Square Kilometre Array (SKA).222See http://www.skatelescope.org.
Appendix A Tables
| Source | Other | RA | DEC | vLSR | Fpeak |
|---|---|---|---|---|---|
| (B1950) | (B1950) | [km s-1] | [mJy] | ||
| M33/V067 | M33/421 | 01 31 03.50 | +30 23 55.0 | -174 | 43 |
| M33/V068 | 01 31 03.60 | +30 28 26.0 | -248 | 42 | |
| M33/V069 | 01 31 07.60 | +30 17 30.0 | -90 | 52 | |
| M33/V070 | IC 142 | 01 31 05.80 | +30 30 00.0 | -244 | 43 |
| M33/V072 | M33/462 | 01 31 08.60 | +30 26 50.0 | -252 | 43 |
| M33/V075 | 01 31 10.10 | +30 20 29.0 | -151 | 40 | |
| M33/V076 | 01 31 10.20 | +30 19 03.0 | -140 | 42 | |
| M33/V077 | M33/5011footnotemark: 1 | 01 31 10.90 | +30 25 29.0 | -209 | 111 |
| M33/V028 | IC 133 | 01 30 27.20 | +30 37 30.0 | -210 | 2150 |
| M33/V079 | M33/511 | 01 31 13.00 | +30 23 19.0 | -198 | 37 |
| M33/V083 | 01 31 17.30 | +30 26 27.0 | -232 | 40 | |
| M33/V084 | 01 31 17.40 | +30 33 33.0 | -278 | 37 | |
| M33/V085 | 01 31 15.30 | +30 31 48.5 | -271 | 38 | |
| M33/V089 | 01 31 21.00 | +30 23 41.0 | -198 | 38 | |
| M33/V091 | 01 31 21.50 | +30 27 04.0 | -181 | 43 | |
| M33/V092 | 01 31 21.60 | +30 21 01.0 | -164 | 42 | |
| M33/V094 | 01 31 24.90 | +30 19 13.0 | -174 | 53 | |
| M33/V095 | M33/581 | 01 31 26.50 | +30 21 49.0 | -212 | 48 |
| M33/V099 | M33/611 | 01 31 28.10 | +30 18 27.0 | -160 | 46 |
| M33/V103 | 01 31 33.50 | +30 17 59.0 | -167 | 42 | |
| M33/V106 | NGC 604 | 01 31 43.60 | +30 31 44.0 | -264 | 43 |
| M33/V109 | 01 31 49.60 | +30 29 00.0 | -225 | 39 | |
| M33/V110 | M33/67 | 01 31 50.30 | +30 26 19.0 | -197 | 40 |
| M33/V111 | 01 31 51.70 | +30 32 43.0 | -232 | 40 | |
| M33/V112 | 01 31 51.80 | +30 28 01.0 | -148 | 41 | |
| M33/V005 | 01 29 53.30 | +30 05 41.0 | -105 22footnotemark: 2 | 41 | |
| M33/V046 | 01 30 47.60 | +30 05 04.0 | -104 22footnotemark: 2 | 42 | |
| M33/V052 | 01 30 52.50 | +30 05 36.0 | -106 22footnotemark: 2 | 45 | |
| M33/V097 | M33/601 | 01 31 27.10 | +30 36 55.0 | -254 22footnotemark: 2 | 40 |
| M33/V104 | 01 31 40.20 | +30 41 39.0 | -259 22footnotemark: 2 | 39 | |
| M33/V107 | M33/651 | 01 31 44.10 | +30 45 00.0 | -263 22footnotemark: 2 | 40 |
1 After designation of ?)
2 using the rotation model of ?)
| Source | Other | RA | DEC | vLSR | Fpeak |
|---|---|---|---|---|---|
| (B1950) | (B1950) | [km s-1] | [mJy] | ||
| M33/V001 | 01 29 41.50 | +30 12 17.0 | -147 | 48 | |
| M33/V003 | 01 29 45.00 | +30 12 07.0 | -135 | 47 | |
| M33/V006 | 01 29 55.70 | +30 19 36.0 | -158 | 48 | |
| M33/V007 | NGC 588 | 01 29 56.50 | +30 23 30.0 | -158 22footnotemark: 2 | 47 |
| M33/V013 | M33/211footnotemark: 1 | 01 30 07.70 | +30 23 30.0 | -135 | 48 |
| M33/V019 | 01 30 20.40 | +30 07 51.0 | -90 | 45 | |
| M33/V020 | M33/51 | 01 30 21.20 | +30 12 07.0 | -107 | 48 |
| M33/V021 | IC 131 | 01 30 22.20 | +30 29 53.0 | -212 | 46 |
| M33/V022 | NGC 592 | 01 30 22.90 | +30 23 19.0 | -168 | 46 |
| M33/V023 | 01 30 23.00 | +30 14 50.0 | -103 | 56 | |
| M33/V026 | 01 30 25.40 | +30 29 49.0 | -200 | 58 | |
| M33/V027 | IC 132 | 01 30 26.70 | +30 41 21.0 | -242 | 52 |
| M33/V028 | IC 133 | 01 30 27.20 | +30 37 30.0 | -210 | 1600 |
| M33/V029 | 01 30 29.80 | +30 26 08.0 | -191 | 57 | |
| M33/V033 | M33/1911footnotemark: 1 | 01 30 39.20 | +30 16 21.0 | -135 | 459 |
| M33/V034 | M33/181 | 01 30 39.80 | +30 25 00.0 | -180 | 58 |
| M33/V037 | 01 30 42.30 | +30 18 13.0 | -139 | 62 | |
| M33/V040 | M33/211 | 01 30 44.50 | +30 16 46.0 | -119 | 65 |
| M33/V041 | NGC 595 | 01 30 44.80 | +30 26 08.0 | -220 | 65 |
| M33/V042 | M33/231 | 01 30 46.50 | +30 27 07.0 | -170 | 58 |
| M33/V043 | 01 30 46.60 | +30 24 18.0 | -140 | 48 | |
| M33/V044 | M33/251 | 01 30 46.70 | +30 21 07.0 | -127 | 53 |
| M33/V045 | 01 30 47.30 | +30 35 18.0 | -241 | 51 | |
| M33/V049 | 01 30 50.30 | +30 22 41.0 | -131 | 49 | |
| M33/V050 | 01 30 51.10 | +30 30 37.0 | -222 | 44 | |
| M33/V054 | 01 30 53.30 | +30 17 50.0 | -136 | 48 | |
| M33/V057 | M33/301 | 01 30 55.20 | +30 29 22.0 | -222 | 51 |
| M33/V059 | 01 30 56.10 | +30 21 23.0 | -135 | 51 | |
| M33/V060 | 01 30 58.30 | +30 28 24.0 | -221 | 49 | |
| M33/V061 | M33/351 | 01 30 58.40 | +30 23 20.0 | -171 | 44 |
| M33/V063 | M33/381 | 01 30 59.40 | +30 24 17.0 | -212 | 44 |
| M33/V064 | M33/391 | 01 31 00.60 | +30 22 07.0 | -130 | 44 |
| M33/V077 | M33/5011footnotemark: 1 | 01 31 11.00 | +30 25 23.0 | -215 | 83 |
1 After designation of ?)
2 using the rotation model of ?)
| Date | Source | Other | RA | DEC | vLSR | Fpeak |
| (J2000) | (J2000) | [km s-1] | [mJy] | |||
| 13.03.2006 | NGC 6822-01 | 19:45:05.04974 | -14:43:12.6178 | -48 | 43 | |
| NGC 6822-02 | 19:44:52.86152 | -14:43:11.9484 | -58 | 44 | ||
| NGC 6822-03 | 19:44:48.13213 | -14:44:17.8702 | -68 | 45 | ||
| NGC 6822-04 | 19:45:17.10323 | -14:45:29.4447 | -38 | 46 | ||
| NGC 6822-05 | 19:44:34.27118 | -14:42:16.2557 | -78 | 47 | ||
| NGC 6822-06 | 19:44:31.51770 | -14:41:56.9218 | -78 | 49 | ||
| NGC 6822-07 | 19:44:31.87935 | -14:44:31.4359 | -78 | 51 | ||
| 25.03.2006 | NGC 6822-08 | 19:44:48.54365 | -14:46:12.0904 | -65 | 36 | |
| NGC 6822-09 | 19:44:32.83735 | -14:47:27.9327 | -75 | 38 | ||
| NGC 6822-10 | 19:44:30.90656 | -14:48:23.8619 | -75 | 39 | ||
| NGC 6822-11 | 19:45:13.06248 | -14:45:14.1431 | -40 | 40 | ||
| NGC 6822-12 | 19:44:38.20420 | -14:51:01.7538 | -65 | 38 | ||
| NGC 6822-16 | 19:45:12.65272 | -14:48:47.9304 | -40 | 38 | ||
| NGC 6822-17 | 19:45:06.86589 | -14:48:35.9576 | -40 | 41 | ||
| 31.03.2006 | NGC 6822-13 | 19:45:01.90566 | -14:46:52.0675 | -55 | 48 | |
| NGC 6822-14 | 19:44:56.94607 | -14:48:01.9967 | -55 | 49 | ||
| NGC 6822-15 | 19:44:52.53709 | -14:48:33.9585 | -55 | 49 | ||
| NGC 6822-18 | 19:44:55.84312 | -14:50:29.8476 | -55 | 51 | ||
| NGC 6822-19 | 19:44:50.32947 | -14:52:51.6951 | -55 | 49 | ||
| NGC 6822-20 | 19:44:52.14471 | -14:51:54.7565 | -55 | 59 | ||
| NGC 6822-23 | 19:45:09.77979 | -14:45:25.8082 | -40 | 63 | ||
| NGC 6822-24 | 19:44:48.84296 | -14:45:12.4843 | -65 | 59 | ||
| 10.04.2006 | NGC 6822-21 | 19:45:04.80200 | -14:57:13.1100 | -40 | 58 | |
| NGC 6822-22 | 19:45:13.62800 | -14:58:59.6500 | -40 | 58 | ||
| NGC 6822-25 | 19:45:01.49300 | -14:54:27.9400 | -40 | 58 | ||
| NGC 6822-28 | 19:45:11.05000 | -14:54:38.5800 | -40 | 58 | ||
| NGC 6822-29 | 19:45:12.70700 | -14:57:26.4100 | -40 | 60 | ||
| NGC 6822-13 | 19:45:02.48330 | -14:47:09.6170 | -70 | 46 | ||
| 17.04.2006 | NGC 6822-26 | 19:44:48.99900 | -14:50:33.5000 | -60 | 45 | |
| NGC 6822-27 | 19:44:42.56900 | -14:50:04.1700 | -60 | 45 | ||
| NGC 6822-30 | 19:44:58.80600 | -14:43:57.2400 | -50 | 37 | ||
| NGC 6822-31 | 19:45:02.84700 | -14:45:14.5000 | -50 | 42 | ||
| NGC 6822-32 | 19:44:56.23500 | -14:45:43.8000 | -50 | 38 | ||
| NGC 6822-33 | 19:45:12.76200 | -14:43:33.2500 | -50 | 43 | ||
| NGC 6822-34 | 19:44:56.23600 | -14:42:08.0200 | -50 | 43 | ||
| NGC 6822-35 | 19:44:15.64400 | -14:46:15.5100 | -80 | 46 | ||
| NGC 6822-36 | 19:44:39.34200 | -14:43:06.5700 | -80 | 48 |
Acknowledgements.
This research was supported by the DFG Priority Programme 1177.References
- Argon et al. (1994) Argon A. L., Greenhill L. J., Moran J. M., et al., 1994, ApJ, 422, 586
- Argon et al. (2004) Argon A. L., Greenhill L. J., Moran J. M., et al., 2004, ApJ, 615, 702
- Becker et al. (1993) Becker R., Henkel C., Wilson T. L., Wouterloot J. G. A., 1993, A&A, 268, 483
- Brand et al. (2005) Brand J., Cesaroni R., Comoretto G., et al., 2005, Ap&SS, 295, 133
- Brunthaler (2004) Brunthaler A., 2004, Ph.D. Thesis
- Brunthaler (2005) Brunthaler A., 2005, Reviews of Modern Astronomy, 18, 179
- Brunthaler et al. (2005) Brunthaler A., Reid M. J., Falcke H., Greenhill L. J., Henkel C., 2005, Science, 307, 1440
- Cheung et al. (1969) Cheung A. C., Rank D. M., Townes C. H., Thornton D. D., Welch W. J., 1969, Nat., 221, 626
- Churchwell et al. (1977) Churchwell E., Witzel A., Huchtmeier W., et al., 1977, A&A, 54, 969
- Corbelli & Schneider (1997) Corbelli E., Schneider S. E., 1997, ApJ, 479, 244
- de Blok & Walter (2006) de Blok W. J. G., Walter F., 2006, AJ, 131, 343
- Diehl et al. (2006) Diehl R., Halloin H., Kretschmer K., et al., 2006, Nat., 439, 45
- Genzel & Downes (1977) Genzel R., Downes D., 1977, A&AS, 30, 145
- Greenhill et al. (1995) Greenhill L. J., Henkel C., Becker R., Wilson T. L., Wouterloot J. G. A., 1995, A&A, 304, 21
- Greenhill et al. (1990) Greenhill L. J., Moran J. M., Reid M. J., et al., 1990, ApJ, 364, 513
- Greenhill et al. (1993) Greenhill L. J., Moran J. M., Reid M. J., Menten K. M., Hirabayashi H., 1993, ApJ, 406, 482
- Guesten & Mezger (1982) Guesten R., Mezger P. G., 1982, Vistas in Astronomy, 26, 159
- Hachisuka et al. (2006) Hachisuka K., Brunthaler A., Reid M. J., et al., 2006, ApJ, in press
- Hatzidimitriou (1999) Hatzidimitriou D., 1999, Intermediate-age and Populations in the Small Magellanic Cloud, in Chu Y.-H., Suntzeff N., Hesser J., Bohlender D. (eds.), IAU Symp. 190: New Views of the Magellanic Clouds, p. 299
- Hippelein et al. (2003) Hippelein H., Haas M., Tuffs R. J., et al., 2003, A&A, 407, 137
- Huchtmeier et al. (1988) Huchtmeier W. K., Eckart A., Zensus A. J., 1988, A&A, 200, 26
- Huchtmeier et al. (1980) Huchtmeier W. K., Richter O.-G., Witzel A., Pauliny-Toth I., 1980, A&A, 91, 259
- Huchtmeier et al. (1978) Huchtmeier W. K., Witzel A., Kuehr H., Pauliny-Toth I. I., Roland J., 1978, A&A, 64, L21
- Hunter & Elmegreen (2004) Hunter D. A., Elmegreen B. G., 2004, AJ, 128, 2170
- Imai et al. (2001) Imai H., Ishihara Y., Kameya O., Nakai N., 2001, PASJ, 53, 489
- Israel (1980) Israel F. P., 1980, A&A, 90, 246
- Israel & van der Kruit (1974) Israel F. P., van der Kruit P. C., 1974, A&A, 32, 363
- Kondratko (2006) Kondratko P., 2006, ApJ, in prep.
- Lazendic et al. (2002) Lazendic J. S., Whiteoak J. B., Klamer I., Harbison P. D., Kuiper T. B. H., 2002, MNRAS, 331, 969
- Lee et al. (2002) Lee M. G., Kim M., Sarajedini A., Geisler D., Gieren W., 2002, ApJ, 565, 959
- Loeb et al. (2005) Loeb A., Reid M. J., Brunthaler A., Falcke H., 2005, ApJ, 633, 894
- Martínez-Delgado et al. (1999) Martínez-Delgado D., Aparicio A., Gallart C., 1999, AJ, 118, 2229
- Mateo (1998) Mateo M. L., 1998, ARA&A, 36, 435
- McConnachie et al. (2005) McConnachie A. W., Irwin M. J., Ferguson A. M. N., et al., 2005, MNRAS, 356, 979
- Palagi et al. (1993) Palagi F., Cesaroni R., Comoretto G., Felli M., Natale V., 1993, A&AS, 101, 153
- Scalise & Braz (1981) Scalise E., Braz M. A., 1981, Nat., 290, 36
- Scalise & Braz (1982) Scalise E., Braz M. A., 1982, AJ, 87, 528
- Talbot (1980) Talbot R. J., 1980, ApJ, 235, 821
- Valdettaro et al. (2001) Valdettaro R., Palla F., Brand J., et al., 2001, A&A, 368, 845
- Viallefond et al. (1986) Viallefond F., Goss W. M., van der Hulst J. M., Crane P. C., 1986, A&AS, 64, 237
- Walterbos & Braun (1994) Walterbos R. A. M., Braun R., 1994, ApJ, 431, 156
- Xu et al. (2006) Xu Y., Reid M. J., Zheng X. W., Menten K. M., 2006, Science, 311, 54
- Zaritsky et al. (1989) Zaritsky D., Elston R., Hill J. M., 1989, AJ, 97, 97
- Zhang et al. (2006) Zhang J. S., Henkel C., Kadler M., et al., 2006, A&A, 450, 933