11email: leipski@astro.rub.de; nbennert@astro.rub.de; huette@astro.rub.de 22institutetext: Radio Observatory Westerbork, ASTRON, P.O. Box 2, 7990 AA Dwingeloo, The Netherlands
22email: falcke@astron.nl 33institutetext: Department of Astrophysics, Radboud University, 6525 ED Nijmegen, The Netherlands 44institutetext: Institute of Geophysics and Planetary Physics, University of California, Riverside, CA 95521, USA
44email: nicola.bennert@ucr.edu
The radio structure of radio–quiet quasars
Abstract
Aims. We investigate the radio emitting structures of radio–quiet active galactic nuclei with an emphasis on radio–quiet quasars to study their connection to Seyfert galaxies.
Methods. We present and analyse high–sensitivity VLA radio continuum images of 14 radio–quiet quasars and six Seyfert galaxies.
Results. Many of the low redshift radio–quiet quasars show radio structures that can be interpreted as jet–like outflows. However, the detection rate of extended radio structures on arcsecond scales among our sample decreases with increasing redshift and luminosity, most likely due to a lack of resolution. The morphologies of the detected radio emission indicate strong interactions of the jets with the surrounding medium. We also compare the radio data of seven quasars with corresponding HST images of the [O iii] emitting narrow–line region (NLR). We find that the scenario of interaction between the radio jet and the NLR gas is confirmed in two sources by structures in the NLR gas distribution as previously known for Seyfert galaxies. The extended radio structures of radio–quiet quasars at sub–arcsecond resolution are by no means different from that of Seyferts. Among the luminosities studied here, the morphological features found are similar in both types of objects while the overall size of the radio structures increases with luminosity. This supports the picture where radio–quiet quasars are the scaled–up versions of Seyfert galaxies. In addition to known luminosity relations we find a correlation of the NLR size and the radio size shared by quasars and Seyferts.
Key Words.:
Galaxies: active – Galaxies: jets – Galaxies: Seyfert1 Introduction
The population of active galactic nuclei (AGN) shows a well
known wide spread in radio luminosity (Miller et al. miller90 (1990);
Kellermann et al. kellermann89 (1989),kellermann94 (1994);
Miller et al. miller93 (1993); Kukula et
al. kukula98 (1998); Xu et al. xu99 (1999)).
Introducing the R parameter as the
ratio of radio flux at 5 GHz and optical flux at 4400 Å
(Kellermann et al. kellermann89 (1989); Falcke et
al. 1996b ),
the radio–loud objects
are separated from the radio–quiet objects: Usually,
the radio–loud quasars have R 100 and 5 GHz
luminosities greater than . The
radio–quiet ones typically have R values between 0.1 and 10 and
luminosities less than at 5 GHz.
Thus, the separation between
the classes is nearly three orders of magnitude in radio
luminosity (Kellermann et
al. kellermann89 (1989),kellermann94 (1994)). Radio–loud
quasars (RLQs) and radio–galaxies are usually dominated by prominent
double–lobe structures extending to tenth or hundreds of
kpc. These extended structures in radio–loud
objects are also dominating in luminosity by outshining the
emission from the active central region by factors of 10 to
100, resulting in a very low core–to–lobe flux
ratio. On the other hand, radio–quiet quasars (RQQs)
only show small scale structures of typically a few
kpc with most of the flux concentrated in the nuclear region
(e.g. Miller et al. miller90 (1990); Kellermann et al.
kellermann94 (1994)).
Nevertheless, some RQQs are known to
show extended structures reminiscent of radio–loud
objects, but on very low flux–density scales
(Kellermann et al. kellermann94 (1994); Blundell & Rawlings
blundell01 (2001)). However, systematic high–dynamic
range radio imaging studies of RQQs are still missing.
At lower (radio) luminosities, Seyfert galaxies also show
compact structures, often dominated by a
central unresolved component, sometimes accompanied by
jet–like features (Ulvestad et al. ulvestad81 (1981); Kukula
et al. kukula95 (1995); Schmitt et al. schmitt01 (2001); Ho &
Ulvestad ho01 (2001)). Comparing the snapshot data of Seyfert
galaxies and RQQs, there is no significant difference in the radio
structure in both types of radio–quiet AGN.
However, in high sensitivity data, the diversity in radio
structure of Seyfert galaxies is obvious (Ulvestad & Wilson
ulvestad89 (1989); Capetti et al. capetti96 (1996); Falcke et al.
falcke98 (1998)). The morphologies can comprise linearly arranged
multiple components (interpreted as emission knots in a
jet), one– or two–sided diffuse jets or
complicated structures that are, nevertheless, often well
collimated. These radio structures coincide in shape and/or direction
with the line–emitting gas
of the narrow–line region (NLR), indicating
that the radio ejecta are intimately connected to
the NLR gas (Falcke et al. falcke98 (1998)).
In the ongoing debate of the evolution of active galaxies
with luminosity, these findings of structured NLRs in Seyfert
galaxies lead Bennert et al. (bennert02 (2002)) to investigate
the NLR structure of RQQs with high–resolution.
They find resolved and structured quasar
NLRs that closely resemble that of Seyfert galaxies. Moreover
they discovered a close correlation between the size and the
luminosity of the NLR, connecting Seyfert galaxies and RQQs
over a few orders of magnitude in luminosity.
These results strongly support the idea that, amongst
radio–quiet AGN, RQQs are the high–power
siblings of Seyfert galaxies. Since the close connection of
Seyferts and RQQs is thus supported in the optical/NLR, we here
explore the question if this can in fact be extended to the
radio regime. We investigate if the interaction of radio
ejecta and NLR gas, a typical phenomenon of active galaxies,
persists with increasing luminosity. Therefore, we combine
high–resolution, high–sensitivity radio and optical data
for a sample of RQQs. We present radio continuum maps
for 14 RQQs and some Seyfert galaxies to analyse the
similarities and differences in both types of objects.
In 2 and 3, observations, data reduction, and data
analysis are summarised. In 4, we present the results on
an object–by–object basis. In 5, we discuss the
results and their implications for the role of radio
jets. We close with the concluding remarks in 6.
| optical position | Frequency | on–source | |||||
| Object | zhel | R | (GHz) | time | |||
| (1) | (2) | (3) | (4) | (5) | (6) | (7) | |
| PG0026+129 | 00 29 13.73 | +13 16 04.3 | 0.142 | 1.10 | 8.4 | 2:02 | |
| PG0052+251 | 00 54 52.16 | +25 25 38.7 | 0.155 | 0.24 | 4.8 | 3:57 | |
| PG0157+001 | 01 59 50.21 | +00 23 40.6 | 0.163 | 2.10 | 8.4 | 2:22 | |
|
Quasars |
PG0953+414 | 09 56 52.50 | +41 15 40.6 | 0.2341 | 0.44 | 4.8 | 3:45 |
| PG1012+008 | 10 14 54.88 | +00 33 36.8 | 0.1874 | 0.50 | 8.4 | 2:46 | |
| PG1049005 | 10 51 51.50 | 00 51 16.6 | 0.3599 | 0.25 | 4.8 | 3:34 | |
| PG1307+085 | 13 09 47.03 | +08 19 49.3 | 0.155 | 0.10 | 4.8 | 3:07 | |
| PG0003+199 | 00 06 19.193 | +20 12 10.51 | 0.0258 | 0.27 | 4.8 | 2:59 | |
| PG1119+120 | 11 21 47.102 | +11 44 18.28 | 0.0502 | 0.15 | 4.8 | 2:33 | |
| PG1149110 | 11 52 03.505 | 11 22 23.87 | 0.049 | 0.88 | 4.8 | 3:05 | |
|
Quasars |
PG1351+640 | 13 53 15.847 | +63 45 45.72 | 0.0882 | 4.30 | 4.8 | 3:54 |
| PG1534+580 | 15 35 52.358 | +57 54 09.17 | 0.0296 | 0.70 | 4.8 | 3:47 | |
| PG1612+261 | 16 14 13.214 | +26 04 16.40 | 0.131 | 2.80 | 4.8 | 3:17 | |
| PG2130+099 | 21 32 27.814 | +10 08 19.49 | 0.063 | 0.32 | 4.8 | 2:12 | |
| Mrk 612 | 03 30 40.9 | 03 08 16 | 0.0203 | 8.4 | 1:30 | ||
| ESO 428G14 | 07 16 31.2 | 29 19 28 | 0.0054 | 8.4 | 1:42 + 1:05 | ||
| NGC 2639 | 08 43 38.1 | +50 12 20 | 0.0111 | 8.4 | 1:06 | ||
| Seyferts | NGC 2992 | 09 45 42.0 | 14 19 35 | 0.0077 | 8.4 | 1:06 | |
| Mrk 266 | 13 38 17.5 | +48 16 37 | 0.0279 | 8.4 | 1:39 | ||
| NGC 5643 | 14 32 40.8 | 44 10 29 | 0.004 | 8.4 | 1:47 + 2:19 | ||
-
Note:
The first seven RQQs are also included in the HST sample of Bennert et al. (bennert02 (2002)).
-
(2)–(3)
The optical position was taken from Miller et al. miller93 (1993) and calculated for J2000 (in and ).
-
(4)
heliocentric redshift as provided by NED
-
(5)
R parameter taken from Kellermann et al. (kellermann94 (1994))
-
(7)
on–source integration time in hrs:min
2 Observations and data reduction
| peak position | peak flux | total flux | size | total flux | Luminosity | scale | ||||
| Object | mJy | mJy | in ′′ | mJy | ||||||
| (1) | (2) | (3) | (4) | (5) | (6) | (7) | (8) | (9) | (10) | (11) |
| PG0026+129 | 00 29 13.700 | +13 16 04.00 | 0.17 | 0.28 | 0.6 | 4.5 | 2.37 | 14.52 | 129.95 | 2442.6 |
| PG0052+251 | 00 54 52.116 | +25 25 39.03 | 0.58 | 0.61 | 3 | - | 38.45 | 2631.8 | ||
| PG0157+001 | 01 59 50.252 | +00 23 40.89 | 2.98 | 4.23 | 2.6 | 3 | 5.55 | 298.74 | 391.96 | 2746.7 |
| PG0953+414 | 09 56 52.400 | +41 15 22.16 | 0.13 | 0.18 | 1.3 | 3 | 0.18 | 29.16 | 29.16 | 3684.0 |
| PG1012+008 | 10 14 54.900 | +00 33 37.46 | 0.10 | 0.25 | 1.0 | 3 | 0.65 | 24.72 | 64.28 | 3106.6 |
| PG1049005 | 10 51 51.446 | 00 51 17.70 | 0.22 | 0.25 | 3 | - | 109.57 | 4987.8 | ||
| PG1307+085 | 13 09 47.000 | +08 19 48.16 | 0.13 | 0.15 | 1.1 | 3 | - | 9.74 | 2661.6 | |
| PG0003+199 | 00 06 19.537 | +20 12 10.61 | 3.49 | 3.58 | 5 | - | 4.69 | 481.4 | ||
| PG1119+120 | 11 21 47.122 | +11 44 18.93 | 0.08 | 0.39 | 5.6 | 3 | 1.04 | 2.38 | 6.34 | 985.7 |
| PG1149110 | 11 52 03.549 | 11 22 24.10 | 1.08 | 1.94 | 2.4 | 5.5 | - | 11.28 | 964.8 | |
| PG1351+640 | 13 53 15.828 | +63 45 45.52 | 7.31 | 8.48 | 3.5 | 3 | - | 161.70 | 1626.8 | |
| PG1534+580 | 15 35 52.400 | +57 54 09.53 | 2.00 | 2.21 | 5 | - | 4.36 | 584.8 | ||
| PG1612+261 | 16 14 13.221 | +26 04 16.27 | 1.19 | 5.27 | 2.6 | 5.5 | 6.12 | 234.28 | 272.07 | 2299.8 |
| PG2130+099 | 21 32 27.816 | +10 08 19.25 | 0.68 | 2.41 | 2.9 | 6 | - | 21.61 | 1172.3 | |
| Mrk 612 | 03 30 40.906 | 03 08 14.56 | 0.19 | 0.68 | 1.9 | 3 | - | 0.59 | 393.8 | |
| ESO 428G14 | 07 16 31.165 | 29 19 28.37 | 3.84 | 18.95 | 4.8 | 4 | - | 1.50 | 122.6 | |
| NGC 2639 | 08 43 38.078 | +50 12 19.98 | 132.16 | 152.97 | 2.0 | 7 | - | 44.80 | 233.4 | |
| NGC 2992 | 09 45 41.946 | 14 19 34.67 | 4.81 | 12.00 | 7.6 | 4.5 | - | 2.03 | 178.3 | |
| Mrk 266 | 13 38 17.786 | +48 16 41.16 | 3.47 | 15.00 | 12.4 | 5 | - | 27.06 | 560.5 | |
| NGC 5643 | 14 32 40.703 | 44 10 27.41 | 5.68 | 11.70 | 41.0 | 4 | - | 0.55 | 94.7 | |
-
Note: (2)–(3)
in and
-
(6)
major extension (diameter) of source emission, a ”” means that only an upper limit can be estimated
-
(8)
B–Array flux
-
(9)–(10)
luminosity from the A and B–Array fluxes, respectively
-
(4)–(10)
flux, size, , and luminosity at the observed frequency shown in Tab. 1
This paper makes use of four different samples that we now present briefly: First, the quasar sample of Bennert et al. (bennert02 (2002)). The objects are the seven most–luminous (in [O iii]) quasars with in the Palomar Green (PG) quasar sample (Schmidt & Green schmidt83 (1983)). Only for the PG quasar sample is complete and not affected by a selection bias (e.g. Wampler & Ponz wampler85 (1985)). Only for this sub–sample HST, emission–line images are available.
The second sample consists of seven PG quasars with redshift 0.2 and [O iii] emission line fluxes 5 10-14 erg s-1 cm-2. This corresponds to [O iii] luminosities exceeding those for typical Seyfert galaxies, thereby filling the gap between quasars and Seyferts in the NLR size-luminosity correlation of Bennert et al. (bennert02 (2002)). These objects were selected as “transition objects” in terms of their [O iii] luminosities and (expected) NLR sizes and are thus of special interest.
Third, a sample of six Seyfert galaxies that were selected on the basis of their extended morphological appearance in radio snapshot surveys. This sample is presented in the appendix.
For all these objects, the basic parameters of the
observations are given in Tab. 1.
In 5, we will make use of the Seyfert sample of Kinney et
al. (kinney00 (2000)) and Schmitt et al. (schmitt01 (2001),
schmitt03 (2003)). These objects were selected on the basis
of a mostly isotropic property, their 60 m fluxes and
their warm infrared colours.
The data for the first three samples were newly obtained using the
Very Large Array (VLA111The National Radio Astronomy
Observatory is a facility of the National Science Foundation
operated under cooperative agreement by Associated
Universities, Inc.;
Thompson et al. thompson80 (1980)) in the A, BnA, and B configuration
at 4.8 GHz or 8.4 GHz with two intermediate
frequencies (IFs) of 50 MHz bandwidth. The details of the
observations are given in Table 1.
The data reduction
was performed in the typical manner using the Aips
software. All bright sources were subject to several
iterations of self–calibration.
Natural– and uniform–weighted (with a robust parameter of
-4) maps were
produced with various cleaning depths, taperings and Clean
gain factors.
In 4 we present and discuss the radio maps of the newly
observed objects
on an object–by–object basis. The maps of the quasars show
compact cores, often accompanied by weak extended emission or
additional unresolved components. All maps in this paper
are shown in contours with spacings of
, starting at as
given in Table 2.
3 Data analysis
Peak positions of the radio sources were determined in the
high resolution uniform–weighted maps by fitting a
two–dimensional Gauss–function to the central peak
using the Aips–task Imfit. For diffuse and
extended sources for which a multi–component Gaussian–fit is not suited to represent the source structure
the total flux was derived by summing the flux inside the
contour.
The noise in the map was determined over large areas near the
source using the task
Tvstat.
The diameter of the radio sources was determined by measuring the
widest extent of the source in the contour.
This diameter was corrected for the
elongation of the beam. However, this correction has only a minor
impact on the overall source size and becomes less important with
increasing total extent of the source. For the compact sources, the
deconvolution of the beam shape and the apparent source shape
was performed by the task Imfit. For all cases in which a
source appeared compact, it was only marginally resolved after
deconvolution. We take this marginal extent only as
an upper limit on the source size.
From the fluxes and diameters, luminosities
and linear distances were calculated using a homogeneous flat
world model which includes Einstein’s cosmological constant
in agreement with the recent
results of the Wilkinson Microwave Anisotropy Probe (Bennet
et al. bennet03 (2003): ,
= 0.27 and =
0.73). Results from the data analysis are given in Tab. 2.


4 Results
4.1 Radio–quiet quasars
The radio–quiet quasars presented here consist of
two groups, each with seven objects, and all taken from the
PG quasar sample (Schmidt & Green schmidt83 (1983)).
The seven objects in the first part of Tabs. 1
and 2 have been imaged with
HST in the redshifted
[O iii] line by Bennert et al. (bennert02 (2002)).
Their emission–line images and our new radio maps are shown
below.
Table 2 lists the central coordinates, integrated and peak fluxes,
as well as sizes and noise levels in the maps. Derived
luminosities and linear source scales are also given.
4.1.1 Seven RQQs with HST NLR images
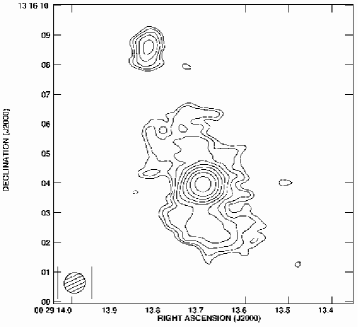
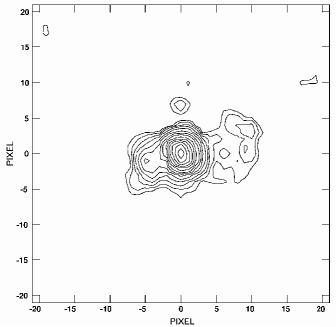
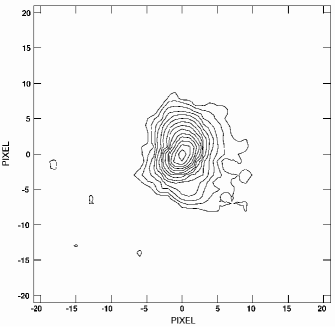
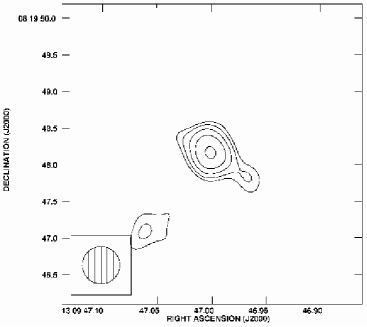
PG0026+129. This source shows no remarkable extent in neither the HST nor the high–resolution VLA image (Fig. 1). Kellermann et al. (1989) found that only 4% of the total flux is concentrated in the core of the object (at 4.8 GHz) but they did not find any extended structures. Our A–Array radio map does not show any extent either, not even on a tapered map. However, on an additional map taken with the VLA in the B–configuration, we detect diffuse emission with an extent of nearly 20 kpc that was totally missed by our A–Array observations. Only 12 % of the B–Array flux was previously detected with the A–Array. Interestingly, the slight elongation on the A–Array images is roughly east–west, but the B–Array image is elongated north–south.
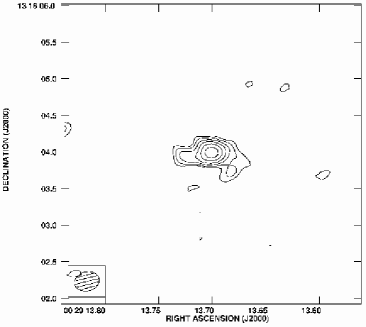
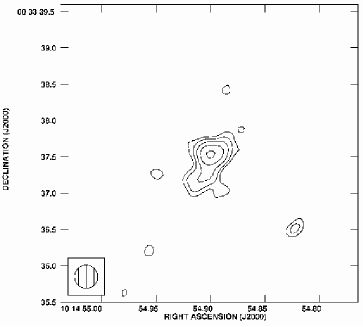
PG0052+251. For this source, Bennert et al. (2002) reported an extended structure in their HST [O iii] emission-line map. This image is reproduced as a contour plot in Fig. 2. The corresponding radio map is also shown, but there is no elongation in the direction of the optical line emission component. The extension to the south–west on a 1.4 GHz map mentioned by Kukula et al. (kukula98 (1998)) in agreement with the optical image is not confirmed in our deep 4.8 GHz map. As Kukula et al. (kukula98 (1998)) noted, this structure is possibly not real. Thus, there is no correlation between [O iii] emission and radio emission for this separated knot.
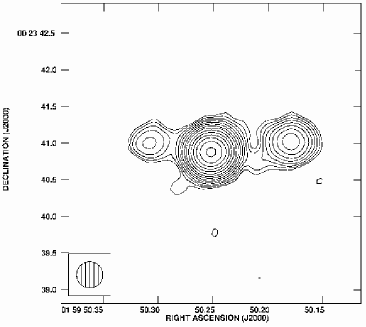
PG0157+001. This triple radio source is clearly related
to the emission–line structures shown by Bennert
et al. (2002) (Fig. 3). The western knot of radio emission
seems to represent the termination point of a jet, which is
stopped in the interstellar medium. This is strengthened by a
bow–shock
like structure of swept–up material in the emission–line
image which is very
similar to what is seen in Mrk 573 (Pogge & de Robertis
pogge95 (1995), Falcke et al. falcke98 (1998), Ferruit et
al. ferruit99 (1999)). As for Mrk 573, the interaction of the
radio jet with the NLR gas producing the bow–shock is confirmed
by optical spectroscopy (Leipski & Bennert
leipski06 (2006)). There is no corresponding association
of the optical
emission line structures at the position of the eastern radio
knot. In fact,
the emission line gas is distributed to the south of this
knot.
The eastern radio knot was missed by the
snapshot images presented by Kellermann et
al. (kellermann89 (1989)). The overall structure of the
triple radio source resembles that of the large scale
[O iii] emission shown by Stockton & MacKenty
(stockton87 (1987)).
A VLA B–Array map shows no additional components in this source.
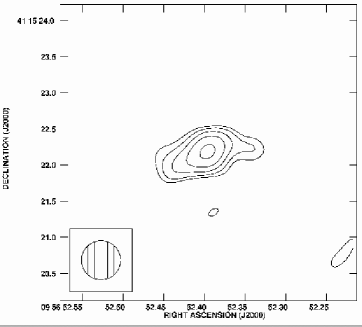
PG0953+414. This quasar is elongated in the east–west direction in the radio regime (Fig. 4, right). In the corresponding [O iii] emission–line image there is no significant extent, especially not in the direction of the radio extension (Fig. 4, left). The radio structure seen with the A–Array does not appear on a B–Array map where the source is unresolved at 4.8 GHz. Thus, a radio jet seems to be directed to the east–west causing extended but collimated radio emission on scales of a few kpc. This source was not detected by Kellermann et al. (kellermann89 (1989)).
PG1012+008. This quasar is part of an interacting system
(Bahcall et al. bahcall97 (1997)). The interstellar
medium is perturbed and it is difficult to say whether the
structures are caused by the merger or by the radio–jet
itself. The radio source consists of a nuclear source
with a jet to the south (see Fig. 2, right).
The jet seems to bend to the east
as indicated by comparing the inner and outer
isophotes. The same ”bended” structure is apparent in the
optical image where the inner isophotes display the shape of
the radio source (Fig. 2, left). This indicates that
the radio jet and the NLR gas are intimately
connected. However, it is not clear what effect the galaxy
interaction has
on the apparent structures, especially on the ”bending”.
A corresponding B–Array map resolves no prominent additional
structures, except one possible short extension to the north–west in
the opposite direction of the jet detected in the A–Array.
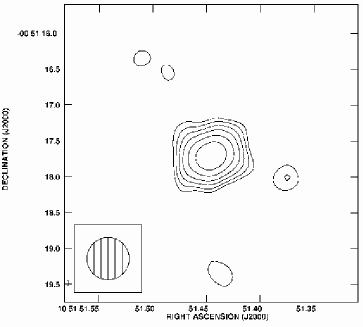
PG1049005. This source appears pointlike at both wavelengths (Fig. 6), but the HST image is resolved due to the better resolution (Bennert et al. bennert02 (2002)). For the radio extent we can only give an upper limit. Note that the elongations in the HST image (Fig. 6, left) to the north–east and south–west and the minor elongations to the south–east and north–west are due to the secondary mirror supporting structure and, therefore, are artificial.
PG1307+085. At both (radio and optical) wavelengths, a compact component can be seen as well as an elongation to the south–west (Fig. 7). While the radio map displays a secondary component in the south–west that possibly is part (or the termination point) of a radio jet, the HST image shows diffuse emission in the same region. While these results are consistent with a radio–NLR interaction, they are by no means conclusive.

4.1.2 Seven RQQs without HST NLR images
For the following seven objects (the middle part of Table 1 and 2), no optical emission–line images are available. Their redshifts and luminosities lie in between the redshifts and luminosities of the RQQs mentioned above and the Seyfert galaxies. Thus, these seven objects are very interesting as they connect Seyferts and RQQs. If there is indeed a close connection between all radio–quiet AGN, it shall be reflected by the radio structures in these objects.
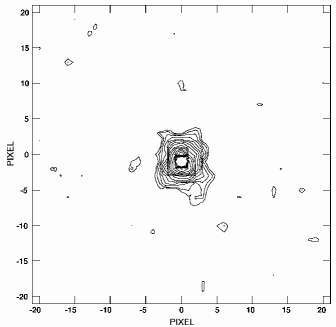
PG0003+199. A compact, unresolved radio source at 4.8 GHz (Fig. 8, left).
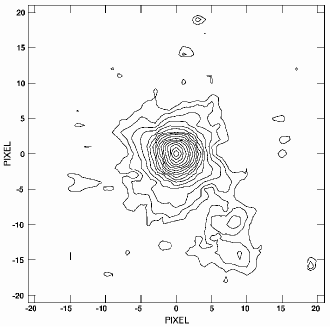
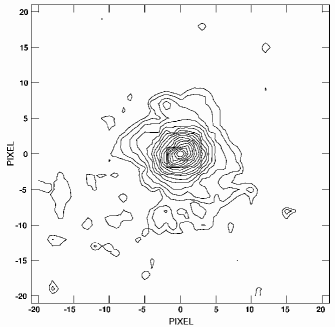
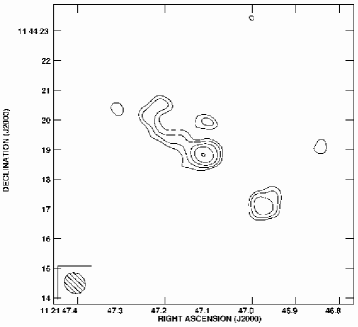
PG1119+120. Three different components are visible in this source: A compact component in the south–west and at the centre as well as a one–sided jet to the north–east (Fig. 9). This jet is nearly two arcseconds long before it sharply bends to the north–west. The whole structure is embedded in a more diffuse emission, especially to the north of the south–western blob (Fig. 9, right). Leipski & Bennert (leipski06 (2006)) have shown that extended [O iii] emission exists in this source and that the emission–line ratios suggest an interaction of the radio jet with the NLR gas.
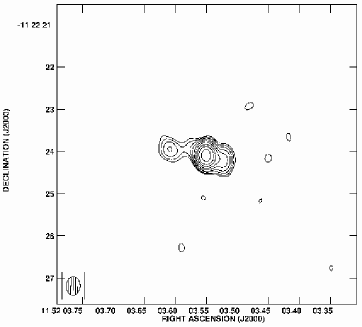
PG1149110. A triple radio source extending in roughly east–west direction (Fig. 10, left). Although the western component seems to become steadily weaker it has a peak that can be seen with different contour spacings. Neither Kellermann et al. (kellermann89 (1989)) nor Kukula et al. (kukula98 (1998)) were able to detect any components in addition to an unresolved core.
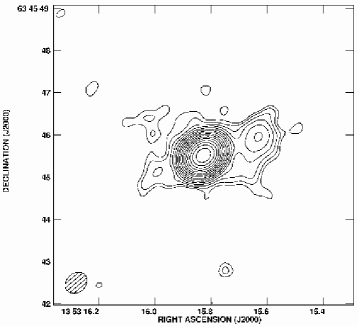
PG1351+640. This source is known to be strongly variable (Barvainis & Antonucci barvainis89 (1989)) and has a VLBA core (Blundell & Beasley blundell98 (1998), Ulvestad et al. ulvestad05 (2005)). However, on arcsecond scales we detect three aligned components with surrounding diffuse emission (Fig. 10, right). Kellermann et al. (kellermann89 (1989, 1994)) have only securely detected the central component.
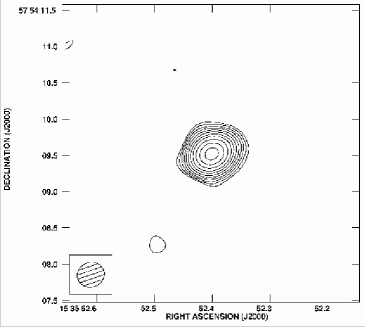
PG1534+580. Unresolved like PG0003+199 (Fig. 8, right).
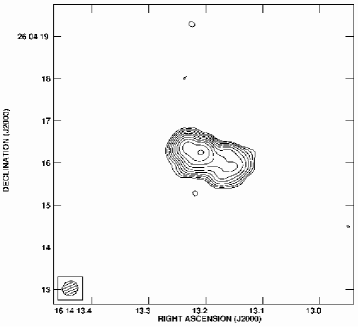
PG1612+261. An one–sided jet heads towards the south–west (Fig. 11, left). As in the case of , three peaks can be identified in this source with adequate contour spacings. While one peak lies very close in the north–east of the central peak, another peak appears at the tip of the jet. Nevertheless, this source holds its one–sidedness. The R value of PG1612+261 is remarkably high (2.81, Kellermann et al. 1989) for a radio–quiet quasar and comparison with flux values given by Kellermann et al. (kellermann89 (1989)) indicates variability. On an additional B–Array map there is no further structure detectable and only 14% of the B–Array flux is missed by the A–Array observations.
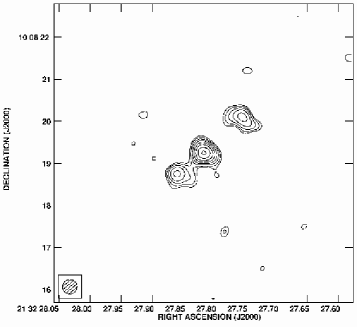
PG2130+099. Another aligned triple radio source, but with well separated and clearly detected components (Fig 11, right). The overall extent is nearly , orientated north–west/south–east. Especially the component to the north–west displays a remarkable sub–structure which is elongated perpendicular to the jet–direction, possibly indicating a transverse shock.


5 Discussion
5.1 Structure of the radio emission
a) Sizes and luminosities
To investigate the radio emission of radio–quiet
quasars we first compare their sizes and luminosities with
literature data before studying their morphologies in
detail.
In luminosity, there is almost no overlap between the higher
redshift RQQ sample and local () Seyfert
samples (e.g. Morganti et al. morganti99 (1999), Ulvestad & Ho
ulvestad01 (2001), Ho &
Ulvestad ho01 (2001)). However, the very bright end of the (rather
powerful) 12 m + CfA sample extends well inside (but does not
exceed) the
luminosities of the higher redshift RQQs (Rush et
al. rush96 (1996)). On the other hand, the lower redshift RQQ sample
connects the almost distinct local Seyfert and high– RQQ
samples in terms of luminosity, but they hardly
exceed the very brightest 12 m + CfA sources. Therefore, the
higher redshift sample significantly increases the luminosity
baseline for radio–quiet AGN, while the lower redshift sample aids to
bridge Seyferts and quasars.
Considering the sizes, a very similar
situation is achieved. But this time the size of even the largest
RQQ in our study hardly exceeds the size of the largest Seyferts
(e.g. Morganti et al. morganti99 (1999), Ulvestad & Ho
ulvestad01 (2001)). However, the size of a RQQ with a given
morphology is in fact larger than that of Seyferts of the same
morphological type (see discussion below).
Additionally, at higher luminosities
the situation may be much more complex due to the possibility of AGN
to harbour large
scale low flux density emission (Fig 1).
Moreover, at the high luminosity end of our samples we start to
enter the range in size and luminosity measured for the radio
galaxies with the very lowest luminosities (de Ruiter et
al. deruiter90 (1990), Neeser et al. neeser95 (1995)).
In the well known Lradio–L correlation
for AGN (e.g. Miller et al. miller93 (1993), Falcke et
al. 1995b , Xu et
al. xu99 (1999)), the radio–quiet population is clearly
distinguished from the radio–loud population. While both
populations share roughly the same range in L,
they are separated in Lradio with only very little overlap.
Given that L can
be used as a measure for the total luminosity of the
AGN222Although this is widely accepted, recent results
provide evidence that this simple picture might not be true (Haas et
al. haas05 (2005))., some radio–quiet objects with the very highest
(total) luminosities have sizes comparable to the radio–loud objects
with the very lowest (total) luminosities333This obviously
reflects the distinction of radio–loud and radio–quiet objects via
the R–parameter (e.g. Kellermann et
al. kellermann89 (1989)).. However, in this apparent
continuity the overlap between our radio–quiet objects and the radio–loud
population in the radio regime is sparse and has to be addressed in detail
elsewhere.
b) Detailed morphological comparison
The radio–quiet quasars observed here can be roughly divided into four
groups on the basis of their radio morphology:
(i) quasars that are unresolved (or almost unresolved) and point–like
(e.g. PG0052+251, Fig. 2),
(ii) objects which exhibit symmetric, double–sided structures that steadily
fade out (e.g. PG0953+414, Fig. 4),
(iii) objects with clear sub–peaks (radio knots) on both side of
the nucleus (e.g. PG0157+001, Fig. 3),
(iv) quasars with strong asymmetry towards one side of the nucleus
(e.g. PG1119+120, Fig. 9).
All these types of radio structure can also be found in Seyfert
galaxies (e.g. Ulvestad & Wilson ulvestad89 (1989), Kukula et
al. kukula95 (1995), Kinney et al. kinney00 (2000), this paper).
As the Seyfert galaxies presented here were
selected on the basis of known extended radio emission (see § 2 and
Appendix A), we
do not find counterparts to quasars in group (i). However, many
Seyfert galaxies are known to be unresolved sources, even
with sub–arcsecond resolution: Comparing the radio
snapshot–surveys of Seyfert galaxies (e.g.
Ulvestad et al. ulvestad81 (1981), Schmitt et al. schmitt01 (2001)) and
quasars (e.g. Miller et al. miller93 (1993), Kellermann et al.
kellermann94 (1994), Kukula et al. kukula98 (1998)), compact and
unresolved objects are
common to both object classes. But, studies using deep images with
long integration times (e.g. Falcke et al. falcke98 (1998), Blundell &
Rawlings blundell01 (2001), this paper) have shown that sources
appearing pointlike in snapshot surveys need not necessarily to be
unresolved. Instead, low flux–density emission (e.g.
PG0026+129 (Fig. 1), PG1119+120
(Fig. 9), Blundell & Rawlings blundell01 (2001)) and
additional components (e.g
PG0157+001 (Fig. 3)) could be detected –
particularly when multi–array observations are used.
A prominent counterpart to group
(ii) is the Seyfert galaxy NGC 5643 (Fig. 15). This
objects has similar structures as, for example, PG0953+414 (Fig. 4).
The much higher diversity
in structure seen for NGC 5643 can be attributed to
resolution effects. Calculating the linear scales of the radio
emission, the structures of PG0953+414 turns out to be even
larger (5 kpc) than those in NGC 5643
(4 kpc; Tab. 2). PG0026+129 is
thereby exceptional in this group as the overall structure is
20 kpc large.
In group (iii), PG0157+001 (Fig. 3) can be
compared with, for example,
Mrk 573. Both objects consist of multiple aligned
(individually barely resolved) emitting knots in the radio regime. These radio
knots are generally interpreted as the termination points of a jet that
is stopped in the dense ISM where the (radio) emission is enhanced by
compressed material and magnetic fields (e.g. Falcke et
al. falcke98 (1998)). The optical emission–line gas thereby displays
prominent bow–shock structures that are closely related to the radio
knots indicating strong interaction (Falcke et al. falcke98 (1998),
Ferruit et al. ferruit99 (1999), Fig. 3). This interaction
of a radio–jet that sweeps up material is confirmed
spectroscopically for Mrk 573 (Ferruit et al.
ferruit99 (1999)) as well as for PG0157+001 (Leipski &
Bennert leipski06 (2006)) by the presence of strong line–emitting
components displaced in velocity. However, it should be noted that
despite these similarities the linear distance of the interacting region
from the nucleus is clearly larger in PG0157+001 (3300 pc)
than in Mrk 573 (700 pc).
The jet of PG1119+120 (Fig. 9) is comparable to the one in
(Fig. 13), both being part of group
(iv). The jets in
these objects are pronounced only on one side of the nucleus and they
stand out by their bended shape. As suggested
by Falcke et al. (falcke98 (1998)) for , the jet in
PG1119+120 is possibly hitting a dense cloud in the ISM
that redirects it. In contrast to the scenario suggested for
PG0157+001 (and Mrk 573),
the redirecting ISM cloud is too dense to produce a bow–shock (that should
develop in a rather smooth distribution of surrounding material).
Nevertheless,
at the point where the redirection takes place, there is a hot spot or at
least an “enhancement” in radio emission for both, PG1119+120
(Fig. 9) and (Fig. 13). Again, the linear
scales are clearly different as the
redirection in takes place at a distance of
500 pc from
the nucleus while this point is 2500 pc away from the nucleus
in PG1119+120. PG1612+261 can also be attributed to
group (iv) with a jet asymmetry to the western side, though the jet is
linear in this case.
Besides the mere morphological match, a
certain radio structure seems to be accompanied by a similar distribution of
the emission–line gas. For PG0157+001 and Mrk 573,
there is radio and NLR emission on either side of the nucleus (Falcke et
al. falcke98 (1998), Fig. 3). Even if
the NLR of NGC 5643 appears one–sided (Simpson et
al. simpson97 (1997)) these authors suggest that the other side of the
NLR is simply hidden by dust. In the framework of the structural match
suggested here, this would be confirmed by the two–sided radio structure
(Fig. 15) as the radio emission is not affected by dust
obscuration.
In contrast to the two–sided sources, objects with one–sided jets
(or at least a clear asymmetry to one side) show this asymmetry also
in the NLR gas distribution, as found for PG1012+008 and
(Fig. 5 and Falcke et al. falcke98 (1998),
respectively).
To summarise, there is no significant difference between the
radio structures of Seyfert galaxies and radio–quiet quasars. The same
holds for the NLRs of these objects. However, the detection rate
of structured radio emission and NLRs drops significantly with
redshift, which can most likely be attributed to
resolution effects as structures smaller than the beam size are
“averaged out”. This is also the reason for the higher diversity
seen in Seyferts. However, the linear scales in RQQs
are up to five times larger than that in Seyfert galaxies,
reflecting the more powerful central engine.
These arguments are supported by the fact that, at the distances
of the quasars, the radio structures
of the Seyfert galaxies (in the same morphological group) would
only be extended by less than an arcsecond.
The structure of the radio emission can also be found in the
emission–line gas where one– or two–sidedness appear to dominate
in both regimes444While it should be noted that there are only
two clear cases for direct radio jet–NLR interaction in our quasar sample,
the trends for one– or two–sidedness seem to hold even at higher redshift..
Thus, from these morphological points of view the
RQQs can be considered
as scaled–up versions of Seyfert galaxies.
The power of the central engine and of the radio jet has not increased enough
to lead to a different scenario in the more powerful RQQs. The
interaction of the radio ejecta with the emission–line gas suggested
from the corresponding images is confirmed by spectroscopic studies
(e.g. Ferruit et al. ferruit99 (1999), Leipski & Bennert
leipski06 (2006)). Therefore the radio jet might be responsible for
shaping the NLR gas distribution. However, dense material can alter
the shape of the radio and NLR emission significantly as proposed for
e.g. ESO428G14 and PG1119+120. It should be
noted that already Quillen et
al. (quillen99 (1999)) suggested that the morphology of the
line–emitting region depends on the distribution of dense ambient
media. It is likely that the overall structure is mostly defined by
the environmental conditions and the presence of a dense interstellar
medium. Thus, it
cannot be answered here if the radio jet is responsible for the
overall NLR morphology. Nevertheless the jet is strongly influencing the
structure on smaller scales and the velocity field of the
emission–line gas.
5.2 On the size of the NLR and radio emission
A correlation between the [O iii] luminosity and the radio
luminosity of quasars has been known for several years (e.g. Miller et
al. miller93 (1993)). This correlation seems to hold, at least for
radio–quiet objects, if low–luminosity AGN (LLAGN) are
added (e.g. Falcke et al. 1995b , Xu et
al. xu99 (1999)).
In addition to these results, the close connection of the NLR and
radio emission of Seyfert galaxies and radio–quiet quasars found here
suggests that also the sizes of these regions may be correlated among
radio–quiet objects.
Given the availability of the first direct quasar NLR sizes (Bennert et
al. bennert02 (2002), this paper), we can now test such a relation.
We increased the database
of our sample by additionally including the datasets
of Schmitt et al. (schmitt01 (2001), schmitt03 (2003))
and Kinney et al. (kinney00 (2000)), comprising
sizes and luminosities of the [O iii]
and radio emitting regions of several Seyfert galaxies.
This sample is homogeneous
in terms of data reduction and size determination techniques which
were carried out by the same team.
The sizes and luminosities were re–calculated according
to the world model used here (§ 3).
We also added PG1119+120 for which no direct size
measurements of the NLR are available. However, Leipski & Bennert
(leipski06 (2006)) have detected [O iii] emission associated
with the radio knots (Fig. 9). Thus, we estimate that the
size of the NLR in PG1119+120 is roughly the same as measured
for the radio emission.
Combining these data, a correlation between the NLR size and radio size
is indeed
found (Fig. 12), supporting the connection of both
measures. For all objects a linear least square
fit yields . Note
that the result of the fit does not change within the errors when
all sources with upper limits on either measure are excluded.

Moreover, projection effects should cancel out in this correlation,
if one assumes that the axis of the “escaping cone”
of ionising photons and the direction of the radio jet is the
same.
This is supported by results of Schmitt et al. (schmitt03 (2003)) who
find a very good alignment between the position angle (p.a.) of the extended
[O iii] emission and that of the radio jet, confirming
previous studies (e.g. Wilson & Tsvetanov wilson94 (1994)).
Given that the NLR size increases with [O iii] luminosity
as implied by the NLR size–luminosity relation (Bennert et al.
bennert02 (2002)) and assuming that the [O iii] luminosity
can be used as a measure for the total luminosity of the AGN, the
radio emitting region becomes larger when the total luminosity is
increased. Such a behaviour can also be seen from the combination of
the – correlation (e.g. Miller et
al. miller93 (1993)) and the radio size–luminosity relation for
radio–quiet quasars (e.g. Morganti et al. morganti99 (1999)).
Thus, a possible interpretation of the observed
correlation between NLR
and radio size is that both depend on the intrinsic
luminosity of the central engine. However, it is not clear whether
also the interaction between radio
jets and NLR gas influences the correlation.
From Fig. 12, it is noticeable that
the radio radius increases faster than the NLR radius when
the (total) luminosity of the AGN is powered up. The radio jet is more
likely to penetrate deeper into the surrounding medium before being
stopped and disrupted (see also Barvainis et al. barvainis05 (2005)). The NLR
increases by the presence of more high–energy photons of the AGN,
that ionise the ambient gas. Thus, tuning up the central luminosity,
the size of the NLR grows while the radio jet digs its way through the
interstellar medium to overtake the NLR gas at some point.
Only for
sufficiently high jet energies the jet is likely to terminate outside
the host galaxy (Falcke et al. 1995a ).
6 Conclusions
We present deep radio images of 14 radio–quiet quasars and six Seyfert
galaxies that show extended structures which can be interpreted as
jets. Especially for the RQQs, aligned multiple components are detected
that are generally interpreted as termination points of radio jets.
The radio structures of RQQs are larger than those of Seyfert galaxies
but exhibit the same morphology.
Thus, RQQs can be regarded as scaled–up versions of Seyfert galaxies,
keeping in mind distance and resolution effects when
interpreting the images. The similarity can also be seen in the NLR
gas distribution where the radio jet of the RQQs leaves its imprint on the NLR
creating structures
that are well known from Seyfert NLRs. This includes sweeping–up material
and the creation of bow-shocks (PG0157+001 vs. Mrk 573) as well as one–sided jets which interact with
one–sided NLRs (PG1012+008 vs. ).
Comparing our results with (radio) snapshot surveys of Seyfert galaxies and
quasars, we have shown that these surveys can miss significant structures.
The apparent majority of unresolved RQQs in contrast to
the Seyferts in our dataset can be attributed to selection and
resolution effects.
Including literature data of Seyfert NLRs and their radio emission, we
find a clear correlation between the size of the NLR and the size of the
radio emission.
We conclude that there is no significant morphological
difference between Seyfert galaxies
and radio–quiet quasars on scales of typical NLR sizes (hundreds of
pc to kpc), neither in the radio nor in the [O iii] emitting
region. Moreover, the interaction of radio–ejecta with
the NLR gas seem to be equally important in both types of sources
for shaping the structure of the NLR and radio emission.
Acknowledgements.
Part of this work was supported by Sonderforschungsbereich SFB 591 “Universelles Verhalten gleich-gewichtsferner Plasmen” der Deutschen Forschungsgemeinschaft. We also acknowledge the comments of the anonymous referee.Appendix A Seyfert galaxies for morphological comparison
These six objects were selected on the basis of their known extended radio emission. Sources with various morphologies were chosen. They are bright enough to be observed at 8.4 GHz to benefit from the higher angular resolution at this frequency. We use them to compare the structure of the extended radio emission of quasars and Seyfert galaxies. The higher linear resolution of the Seyfert maps may provide clues to the underlying structure in the extended quasar emission that is averaged out. Any gradual transition from Seyferts to quasars with increasing luminosity should conserve the basic morphological features to some extent. As already shown for the 14 RQQs and known from the literature, the long integration times enable us to detect low flux level emission of very diverse structures which is missed in snapshot surveys.
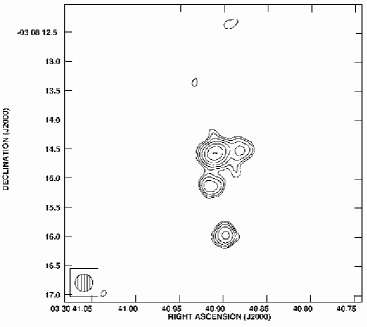


Mrk 612. Four different components can be identified in this source (Fig. 13, left). Three of them are aligned in north–south direction over 2′′, whereas the fourth one lies closely to the west of the brightest source. Nagar et al. (nagar99 (1999)) identified the most southern component to be the central one. Since the northern structure is elongated perpendicular to the source axis they interpreted this as a transverse shock.
ESO428G14. A prominent, bended, diffuse one–sided jet dominates the structure of this Seyfert–2 galaxy (Fig. 13, right). From the central component, the jet heads towards the south–east and bends by nearly 90 degrees to the north–east after approximately 4′′. With better resolution (but a lack of signal), Falcke et al. (1998) have shown this structure also at 14.9 GHz. Our radio map and the emission–line images of Falcke et al. (1996a ) demonstrate the striking structural similarity of radio emission and NLR emission (from HST [O iii] and H images) in this source.
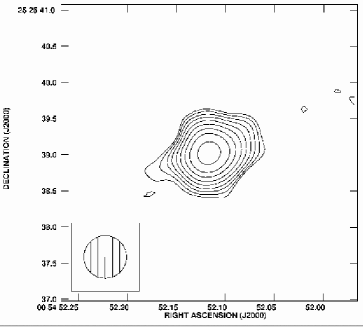
NGC 2639. The brightest source in our sample shows a 2′′ wide structure of three components that are merged at the available resolution (Fig. 14, left). Interestingly, there is some diffuse emission around the two outer components that is constricted at the position of the central source. Wilson et al. (wilson98 (1998)) reported a VLBA nucleus and the variability of this source. In fact, their flux on arcsecond scales from an earlier VLA map (Ulvestad & Wilson ulvestad89 (1989)) was smaller than their VLBA flux. This flux variablity is also obvious when including our data: Our peak flux is 5 times greater than the flux measured by Ulvestad & Wilson (ulvestad89 (1989)) and 3 times greater than that of Wilson et al. (wilson98 (1998)). Since the measurements in the literature stated above are at 5 GHz, they are only comparable with our fluxes at 8.4 GHz due to the very flat spectral index of the central (dominating) source above 5 GHz (Wilson et al. wilson98 (1998)).

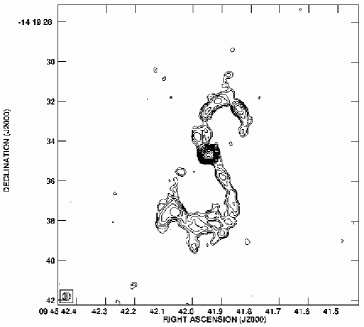
NGC 2992. This object shows probably the most interesting structure (Fig. 14, right). The very prominent S–shaped radio emission is roughly 8′′ wide and coincides with a nuclear outflow of emission–line gas (Veilleux et al. veilleux01 (2001)). Their model of a hot, bipolar, thermal wind that interacts with the ISM of the galaxy excludes a significant contribution of the radio–jet to the energy budget of the NLR. At lower (radio) frequencies (5 GHz), the two loops are closed and a figure–8 structure appears (Ulvestad & Wilson ulvestad84 (1984)).
Mrk 266. This source consists of three components: one compact core as well as two diffuse emission regions (Fig. 15, left). All sources are well aligned and the whole structure is roughly 12′′ long. This galaxy with a double–nucleus in the optical shows LINER emission in the north–eastern nucleus whereas the south–western nucleus is a Seyfert–2 type object (Mazzarella et al. mazzarella88 (1988)). They conclude that this galaxy is a merger of a Seyfert and a LINER galaxy. The north–eastern radio component most likely belongs to the LINER nucleus. This interpretation is strengthened by the fact that compact radio structures are well know for LINER galaxies (e.g. Nagar et al. nagar00 (2000)). On the other hand, the south–western structure belongs to the Seyfert galaxy. The radio structure of this region with double–sided jet–like diffuse emission is very typical for Seyfert galaxies. The diffuse emission between both components is considered to be the region of interaction with enhanced synchrotron emission.
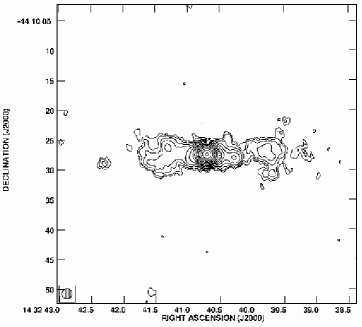
NGC 5643. This source has a diffuse radio jet on both sides of the nucleus which is nearly 30′′ long (Fig. 15, right). The whole radio structure matches well with the corresponding distribution of the NLR gas (Simpson et al. simpson97 (1997)). Although Simpson et al. (simpson97 (1997)) detect only a one–sided ionisation cone on the eastern side of the nucleus they state that the western side suffers heavy extinction by a dust lane, thus shadowing the second cone.
References
- (1) Bahcall, J. N., Kirhakos, S., Saxe, D. H., & Schneider D. P. 1997, ApJ, 479, 642
- (2) Barvainis, R., & Antonucci, R. 1989, ApJS, 70, 257
- (3) Barvainis, R., Lehár, J., Birkinshaw, M., Falcke, H., & Blundell, K. M. 2005, ApJ, 618, 108
- (4) Bennett, C. L., Halpern, M., Hinshaw, G. et al. 2003, ApJS, 148, 1
- (5) Bennert, N., Falcke, H., Schulz, H., Wilson, A. S., & Wills, B. J. 2002, ApJ, 574, L105
- (6) Blundell, K. M., & Beasley, A. J. 1998, MNRAS, 299, 165
- (7) Blundell, K. M., & Rawlings, S. 2001, ApJ, 562, L5
- (8) Capetti, A., Axon, D. J., Macchetto, F., Sparks, W. B., Boksenberg, A. 1996, ApJ, 469, 554
- (9) de Ruiter, H. R., Parma, P., Fanti, C., & Fanti, R. 1990, A&A, 227, 351
- (10) Falcke, H. & Biermann, P. L. 1995, A&A, 293, 665
- (11) Falcke, H., Malkan, M. A., & Biermann, P. L. 1995, A&A, 298, 375
- (12) Falcke, H., Wilson, A. S., Simpson, C., & Bower, G. A. 1996, ApJ, 470, L31
- (13) Falcke, H., Sherwood, W., & Patnaik, A. R. 1996, ApJ, 471, 106
- (14) Falcke, H., Wilson, A. S., & Simpson, C. 1998, ApJ, 502, 199
- (15) Fanaroff, B. L. & Riley, J. M. 1974, MNRAS, 167, 31
- (16) Ferruit, P., Wilson, A. S., Falcke, H., Simpson, C., Pécontal, E., Durret, F. 1999, MNRAS, 309, 1
- (17) Haas, M., Siebenmorgen, R., Schulz, B. 2005, A&A, 442, L39
- (18) Ho, L. C., & Ulvestad, J. S. 2001, ApJS, 133, 77
- (19) Kellermann, K. I., Sramek, R., Schmidt, M., Shaffer, D. B., & Green, R. 1989, AJ, 98, 1195
- (20) Kellermann, K. I., Sramek, R., Schmidt, M., Green, R. F., & Shaffer, D. B. 1994, AJ, 108, 1163
- (21) Kinney, A. L., Schmitt, H. R., Clarke, C. J., Pringle, J. E., Ulvestad, J. S., & Antonucci, R. R. J. 2000, ApJ, 537, 152
- (22) Kukula, M. J., Pedlar, A., Baum, S. A., & O’Dea, C. P. 1995, MNRAS, 276, 1262
- (23) Kukula, M. J., Dunlop, J. S., Hughes, D. H., & Rawlings, S. 1998, MNRAS, 297, 366
- (24) Leipski, C. & Bennert. N. 2006, A&A, 448, 165
- (25) Mazzarella, J. M., Gaume, R. A., Aller, H. D., & Hughes, P. A. 1988, ApJ, 333, 168
- (26) Miller, L., Peacock, J. A., & Mead, A. R. G. 1990, MNRAS, 244, 207
- (27) Miller, P., Rawlings, S., & Saunders, R. 1993, MNRAS, 263, 425
- (28) Morganti, 2001, A&AS, 137, 457
- (29) Nagar, N. M., Wilson, A. S., Mulchaey, J. S., & Gallimore, J. F. 1999, ApJS, 120, 209
- (30) Nagar, N. M., Falcke, H., Wilson, A. S., & Ho, L. C. 2000, ApJ, 542, 186
- (31) Nagar, N. M., Falcke, H., & Wilson, A. S. 2005, A&A, 435, 521
- (32) Neeser, M. J., Eales, S. A., Law–Green, J. D., Leahy, J. P., & Rawlings, S. 1995, ApJ, 451, 76
- (33) Pogge, R. W., & de Robertis, M. M. 1995, ApJ, 451, 585
- (34) Quillen, A. C., Alonso–Herrero, A., Rieke, M. J., Rieke, G. H, Ruiz, M., and Kulkarni, V. 1999, ApJ, 527, 696
- (35) Rush, , Malkan, , Edelson, 1996, ApJ, 473, 130
- (36) Schmidt, M. & Green, R. F. 1983, ApJ, 269, 352
- (37) Schmitt, H. R., Ulvestad, J. S., Antonucci, R. R. J., & Kinney, A. L. 2001, ApJS, 132, 199
- (38) Schmitt, H. R., Donley, J. L., Antonucci, R. R. J., Hutchings, J. B., & Kinney, A. L. 2003, ApJS, 148, 327
- (39) Simpson, C., Wilson, A. S., Bower, G., Heckman, T. M., Krolik, J. H., & Miley, G. K. 1997, ApJ, 474, 121
- (40) Stockton, A. & MacKenty, J. W. 1987, ApJ, 316, 584
- (41) Thompson, A. R., Clark, B. G., Wade, C. M., & Napier, P. J. 1980, ApJS, 44, 151
- (42) Ulvestad, J. S., Wilson, A. S., & Sramek, R. A. 1981, ApJ, 247, 419
- (43) Ulvestad, J. S. & Wilson, A. S. 1984, ApJ, 285, 439
- (44) Ulvestad, J. S. & Wilson, A. S. 1989, ApJ, 343, 659
- (45) Ulvestad, J. S. & Ho, L. C. 2001, ApJ, 558, 561
- (46) Ulvestad, J. S., Antonucci, R. R. J., and Barvainis, R. 2005, ApJ, 621, 123
- (47) Veilleux, S., Shopbell, P. L., & Miller, S. T. 2001, AJ, 121, 198
- (48) Wampler, E. J. & Ponz, D. 1985, ApJ, 298, 448
- (49) Wilson, A. S. & Tsvetanov, Z. I. 1994, AJ, 107, 1227
- (50) Wilson, A. S., Roy, A. L., Ulvestad, J. S., Colbert, E. J. M., Weaver, K. A., Braatz, J. A., Henkel, C., Matsuoka, M., Xue, S., Iyomoto, N. & Okada, K. 1998, ApJ, 505, 587
- (51) Xu, C., Livio, M., & Baum, S. 1999, AJ, 118, 1169