Spitzer/MIPS Imaging of NGC 650:
Probing the History of Mass Loss
on the Asymptotic Giant Branch
Abstract
We present the far-infrared (IR) maps of a bipolar planetary nebula (PN), NGC 650, at 24, 70, and taken with the Multiband Imaging Photometer for Spitzer (MIPS) on-board the Spitzer Space Telescope. While the two-peak emission structure seen in all MIPS bands suggests the presence of a near edge-on dusty torus, the distinct emission structure between the map and the 70/ maps indicates the presence of two distinct emission components in the central torus. Based on the spatial correlation of these two far-IR emission components with respect to various optical line emission, we conclude that the emission is largely due to the [O IV] line at arising from highly ionized regions behind the ionization front, whereas the 70 and emission is due to dust continuum arising from low-temperature dust in the remnant asymptotic giant branch (AGB) wind shell. The far-IR nebula structure also suggests that the enhancement of mass loss at the end of the AGB phase has occurred isotropically, but has ensued only in the equatorial directions while ceasing in the polar directions. The present data also show evidence for the prolate spheroidal distribution of matter in this bipolar PN. The AGB mass loss history reconstructed in this PN is thus consistent with what has been previously proposed based on the past optical and mid-IR imaging surveys of the post-AGB shells.
Subject headings:
circumstellar matter — infrared: stars — planetary nebulae: individual (NGC 650) — stars: mass loss1. Introduction
NGC 650 (PK 130-101, M 76, Little Dumbbell Nebula) is a large (; Balick et al. 1992) bipolar planetary nebula (PN) of the “late butterfly” type (Balick, 1987). The nebula structure in the optical consists of the bright rectangular core of (the long side perpendicular to the bipolar axis) and a pair of fainter lobes extending and from the central star that is attached to the long side of the rectangular core. The central core was long suspected to be a nearly edge-on torus, and the most recent kinematical study has eloquently demonstrated that the core is an inclined torus and the lobes are blown-bubbles expanding into the polar directions (Bryce et al., 1996).
Under the framework of the widely-accepted general interacting stellar wind (GISW) model (e.g., Balick 1987), the formation of bipolar PNs is understood as a two-step process. First, the progenitor star has to lose its envelope material via mass loss ( M⊙, km s-1) during the asymptotic giant branch (AGB) phase of the evolution. This AGB wind leads up to the so-called superwind ( M⊙, km s-1) at the end of the AGB phase prior to the exhaustion of the envelope material. During the superwind phase, mass loss is expected to cause concentration of the ejected matter into the equatorial plane. The AGB mass loss therefore results in the equatorially-enhanced circumstellar shell.
Then, a hot and tenuous fast wind ( M⊙, km s-1) begins to emanate from the progenitor just prior to the beginning of the PN phase when the circumstellar material starts to ionize. This fast wind pushes into the surrounding equatorially-concentrated envelope, and the flow of the wind is thus channeled into the polar directions. The preferential wind flow towards the polar directions creates the typical bipolar lobes as wind-blown bubbles. The GISW scheme is thus capable of producing various PN shapes (both bipolar and spheroidal shells) depending primarily on the degree of the equatorial enhancement in the surrounding AGB shell.
Hence, in order for the GISW scheme to work, the equatorially-enhanced AGB shell must be present when a fast wind is initiated. The GISW model itself, however, does not address how to generate the equatorial enhancement in the AGB wind shell. The presence of such circumstellar shells with a built-in equatorial density enhancement has been confirmed by imaging surveys of proto-PNs in thermal IR dust emission from the innermost torus (e.g., Skinner et al. 1994; Meixner et al. 1997; Dayal et al. 1998; Meixner et al. 1999; Ueta et al. 2001) and dust-scattered star light (e.g., Ueta et al. 2000). Based on the results from the largest mid-IR and optical imaging surveys to date (Meixner et al., 1999; Ueta et al., 2000), a so-called “layered shell model” has been proposed to explain both the bipolar and elliptical proto-PN morphologies (Ueta, 2002; Ueta & Meixner, 2003). In this model, the proto-PN shells are thought to consist of three generic layers, each of which possesses a specific structure reflecting the geometry of mass loss at the time. The outer spherically symmetric layer represents isotropic mass loss during the early AGB phase, while the inner toroidal layer embodies equatorially-enhanced mass loss during the superwind epoch at the end of the AGB phase. Between these layers there is an intermediate spheroidal layer, which results from a gradual transformation of the mass loss geometry from isotropic to equatorially-enhanced over the course of the AGB phase.
The unique strength of this layered shell model is its versatility. Radiative transfer calculations using this model have successfully reproduced both bipolar and elliptical proto-PN morphologies by simply varying the degree of the equatorial density enhancement (i.e., optical depth) of the shell (Meixner et al., 2002; Ueta & Meixner, 2003). The implication of the layered shell model is that there is no intrinsic distinction between the elliptical and bipolar proto-PN shells other than the degree of the equatorial density enhancement. Bipolar PNs would emerge from equatorially-enhanced proto-PNs and elliptical PNs would descend from proto-PNs of rather isotropic density distribution. The presence of the spheroidal intermediate layer is the key to account for the elongation along the polar axis in proto-PN shells (e.g., Ueta et al. 2001; Meixner et al. 2002; Ueta & Meixner 2003; Meixner et al. 2004).
It is clear that the equatorially-enhanced superwind initiates the subsequent aspherical structure development that eventually results in the observed complex PN structures. However, it is still not yet evident how the shell structure development ensues in the AGB and post-AGB winds. How does the spheroidal density distribution arise prior to the equatorial enhancement at the end of the AGB phase? Is the post-AGB mass loss significant in shell shaping? Does a fast wind simply “snow-plow” the surrounding material, tracing the pre-existing toroidal density distribution, or contribute to an additional equatorial enhancement? These are only a few questions concerning the shell structure development in the circumstellar shells of evolved stars.
Further to understand the role of mass loss in the shell structure development during the AGB phase and beyond, the remnant AGB shells need to be investigated in PNs via sensitive far-IR observations of thermal dust emission, since such remnant AGB shells are very much dispersed and cold. In the following, we present the results of Spitzer Space Telescope far-IR mapping observations of a bipolar PN, NGC 650, to probe the history of AGB and post-AGB mass loss in this object. Below, we describe the data set and reduction procedure (§2), discuss the results (§3), and summarize conclusions (§4).
2. Observations and Data Reduction
NGC 650 was observed with the Multiband Imaging Photometer for Spitzer (MIPS; Rieke et al. 2004) on-board the Spitzer Space Telescope (Werner et al., 2004) on 2004 September 18 as part of GTO first year observations (Program ID 77; AOR KEY 9548032). The MIPS observations were performed in the scan-map mode using the medium scan rate. The scan was done along four scan legs of long each with the cross-scan stepping of . The whole scan sequence was repeated twice. The entire three-band dataset was retrieved from the Spitzer Science Archive using the Spitzer-Pride software tools (Spot/Leopard).
Data reduction was done mostly with the 2005 September 30 version of the Mosaicker software provided by the Spitzer Science Center (SSC)111http://ssc.spitzer.caltech.edu/postbcd/ and the Ge Reprocessing Tools (GeRT; Ver. 041506 of S14 processing)222http://ssc.spitzer.caltech.edu/mips/gert/ . The map was constructed using the Mosaicker from the Basic Calibrated Data (BCD) products that were produced from the raw data via the SSC pipeline. Upon making a mosaic map, anomalous pixels were removed by using the dual outlier detection algorithm in the Mosaicker.
Since the post-BCD mosaicked maps at 70 and generated by the SSC pipeline showed obvious artifacts, we generated these maps directly from the raw data using the GeRT and the Mosaicker. First, we corrected bad stimulator response calibration affected by the bright objects (i.e., the target), in order to optimally remove the time-dependent responsivity variation of the detector. This is done by ignoring the stimulator flash frames on and near the target. Second, we removed the “streakings” due to residual slow response variations of the detector by applying a high-pass time filter. Since we are interested in the extended far-IR structure of the object, we did not perform column filtering for the band data. Instead, we used a relatively small median-count value of six when applying a high-pass time filter. Upon applying the time filter, we masked out the target to avoid extended faint emission from being mistakenly filtered out. These GeRT processes resulted in cleaner BCDs. Then, we constructed mosaic maps from the GeRT-processed BCDs using the Mosaicker.
The resulting maps are in pix-1, pix-1, and pix-1 for the 24, 70, and bands, respectively. After making artifact-removed maps for all three bands, we subtracted sky emission, which was estimated at off-source positions that are free from background sources. The sky emission was determined to be 20, 9, and 27 MJy sr-1 respectively in the 24, 70, and bands. These values are consistent with the estimated values of the date of observations obtained using the Spot software. In order to facilitate direct comparison of the nebula structure between two different MIPS bands, the 24 and images were convolved with the beam of the longer wavelength bands and their pixel scales were made to match with that of the longer wavelength band. Flux calibration of the maps were done using the conversion factors provided by the SSC.
3. Results and Discussion
3.1. NGC 650 in the Far-IR
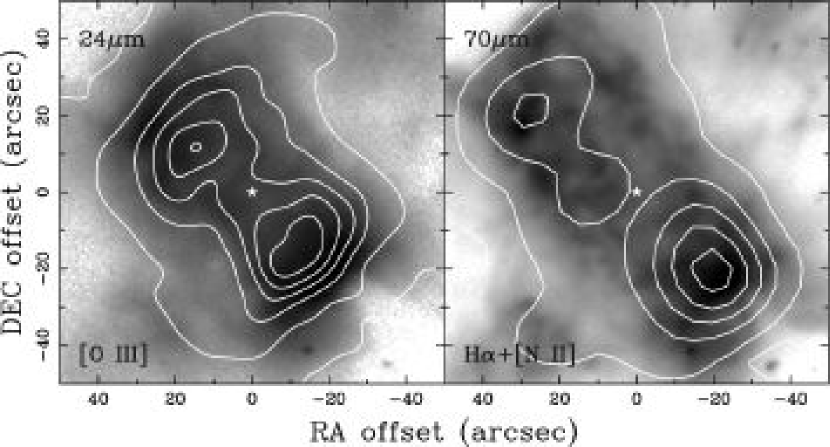
Figure 1 presents the MIPS mosaicked maps of NGC 650 at (top left), (middle left), and (bottom left) in grayscale and contours. Also displayed for comparison are optical narrow-band images in the [O III] band at 5007 Å(top right) and H+[N II] band at 6600 Å(middle and bottom right) in grayscale, obtained from the Instituto de Astrofísica de Canarias (IAC) Morphological Catalog of Northern Galactic Planetary Nebulae Archive.333http://www.iac.es/nebu/nebula.html. These optical images are overlaid with the far-IR contours. The figure caption gives the complete detail of the images.
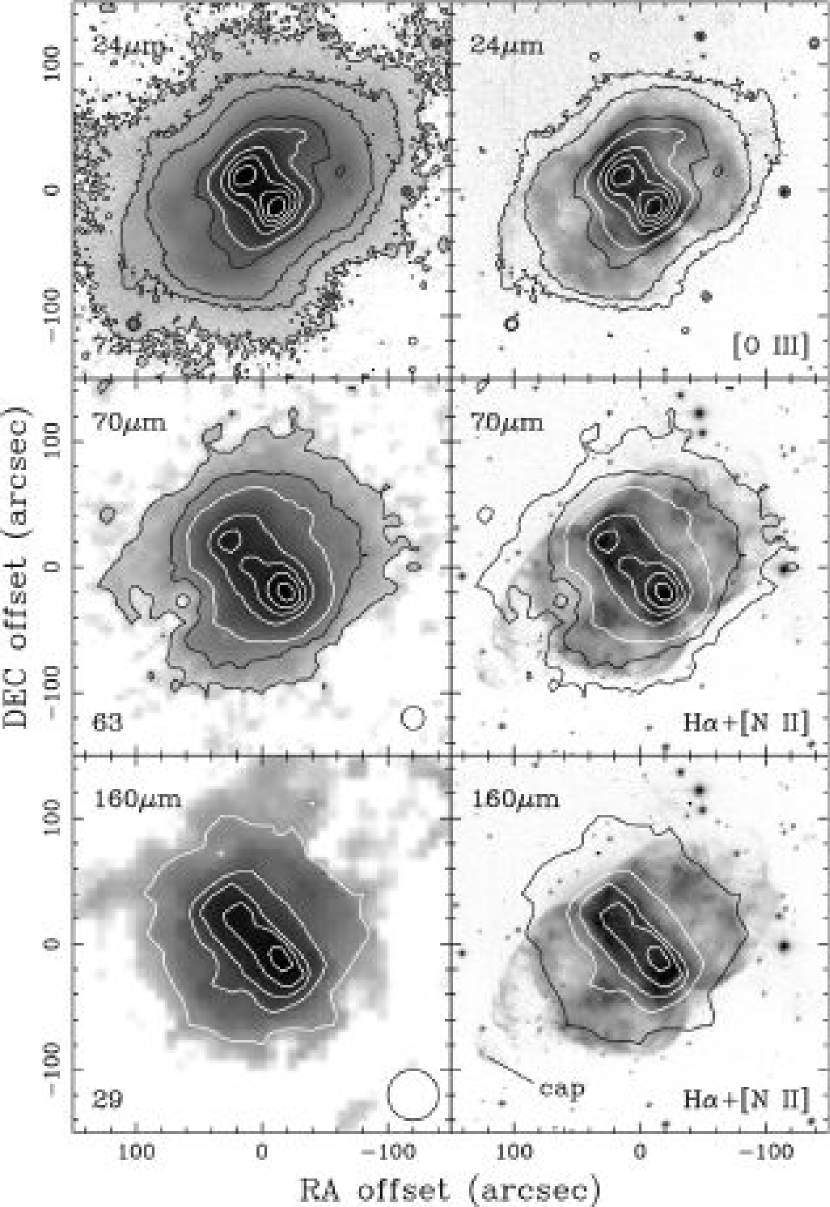
In all bands, the nebula core is resolved into two emission peaks that delineate the bipolar waist of the optically bright core (i.e., the short sides of the core). The southwestern peak is brighter than the northeastern peak in all bands. The intensity of the brighter (southwestern) peak is 72, 63, and 29 MJy sr-1 while that of the dimmer (northeastern) peak is 61, 35, and 23 MJy sr -1, both respectively in the 24, 70, and bands. Previous kinematic studies of the nebula in the optical emission lines have shown that the bright core is an expanding torus (dubbed a “napkin ring”) inclined at about with respect to the line of sight (e.g., Bryce et al. 1996). A similar two-peak emission structure at mid-IR has been commonly observed in optically thin, equatorially-enhanced proto-PN dust shells that are oriented near edge-on (e.g., Meixner et al. 1993; Skinner et al. 1994; Ueta et al. 2001; Gledhill & Yates 2003). The resolved far-IR structure in this PN is consistent with the mid-IR structure of progenitor objects, suggesting that the innermost torus of warm dust in a proto-PN shell would keep its toroidal shape into the PN phase while the dust temperature decreases upon expansion. The two-peaked far-IR structure thus represents the limb-brightened edges of a near edge-on optically thin dusty torus, at which the column density of the far-IR emitting matter is the largest.
Far-IR emission in the nebula is more extended than the optically bright core region. Emission is detected at least 10% of the peak intensity level in the regions interior to the optical inner lobes ( from the center) in all bands. Fainter emission appears to be more extended along the bipolar axis beyond the optical inner lobes at shorter wavelengths. In the band, emission at of the peak level ( detection) is observed in regions corresponding to the outer lobes. There is a detached “cap” detected in the optical at the tip of the southeast lobe (marked in the bottom right panel of Fig. 1). Hora et al. (2004) have reported detection of emission from this cap in the Spitzer/Infrared Array Camera (IRAC) bands (and even from the opposing one in the northwest lobe). Although the map shows very low-level ( three ) emission in the regions corresponding to the southeast cap, it is uncertain whether we have positive detection of the cap or not. There appears to be an isolated patch of emission near the northwest corner of the panel at (, ). This is, however, not the opposing cap: it is simply a background source.
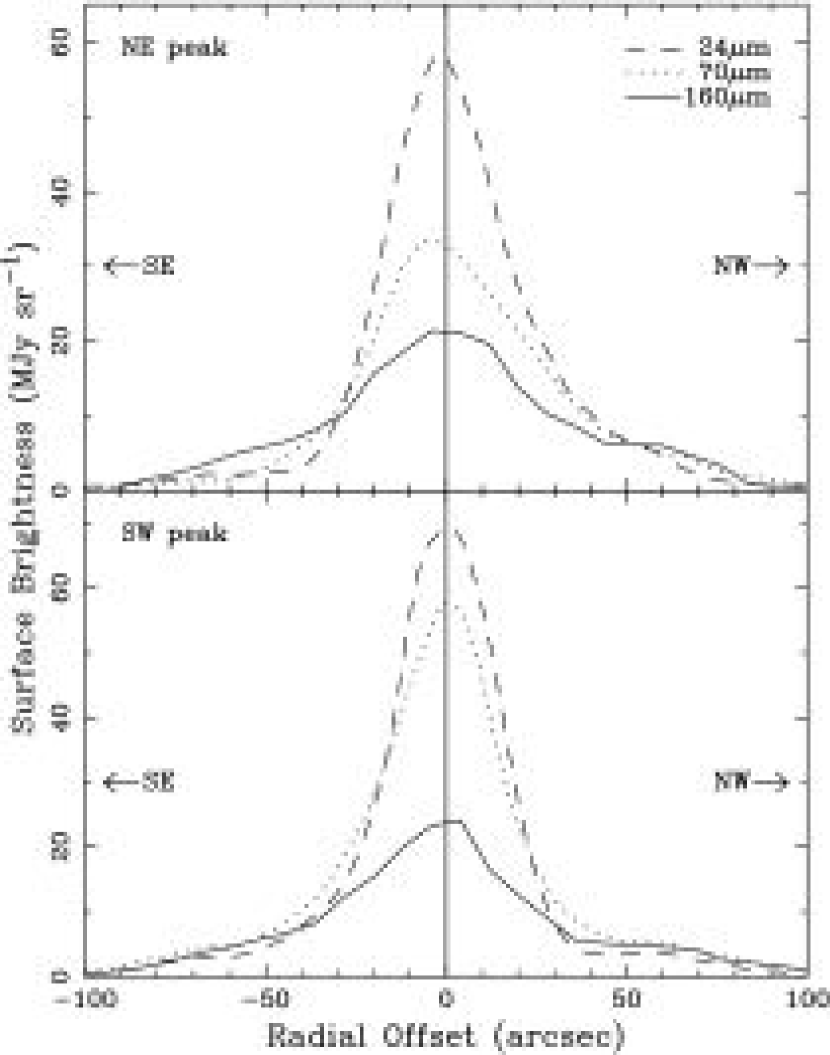
Emission of intermediate strengths ( to of the peak) shows an interesting morphology of the nebula. In the optical image, there is a region of enhanced brightness in both of the inner lobes. The bright region in the optical northwest lobe seems to be connected to the northeast end of the waist, while the bright region in the southeast lobe appears to be attached to the southwest end of the waist. On one hand, a similar trend is seen in the far-IR maps. The northeast (southwest) peak is more elongated towards the northwest (southeast) lobe, corresponding to the optically bright region. On the other hand, the actual location of the northeast (southwest) peak appears to be displaced towards the southeast (northwest) direction, which is opposite to the direction of the peak elongation mentioned above. Figure 2 is presented to show this morphological trend by surface brightness profiles.
While the overall boxy shape of the optically bright core is oriented perpendicular to the bipolar axis, the emission peaks do not seem to be aligned with the equatorial plane. The elongation of the peaks is best seen in the map, while the peak displacement is well displayed by the map. This morphological trend is consistent with that has been seen in the optical (Balick 1987; Bryce et al. 1996), H2 (Kastner et al., 1996), and IRAC (Hora et al., 2004) bands, and gives the nebula point-symmetric appearance.
Aperture photometry above the three level (the lowest contour in Figure 1) yields flux measurements of , , and Jy in the 24, 70, and band, respectively. These values are listed in Table 1 together with the past measurements taken by Infrared Astronomical Satellite (IRAS). The measured flux at the MIPS band is about higher than that at the IRAS band. The color correction on the IRAS flux does not seem to account for the entire discrepancy. Since the entire MIPS band is overlapped with the IRAS band, the discrepancy cannot be attributed to the presence of strong IR fine-structure lines in the MIPS band that are not covered by the IRAS band. Sensitivity of the MIPS band is superior to that of the IRAS band, and the MIPS map shows a very faint extended nebulosity. Thus, the discrepancy could be attributed to the IRAS measurements missing the faint emission. Aperture photometry in the MIPS band using the estimated measurement threshold at the IRAS band yields 3.67 Jy. Considering also the beam dilution effect expected in the IRAS data, we conclude that the flux discrepancy is due to faint emission in the extended nebulosity that was not previously detected by IRAS.
| Flux | Flux | Flux | |
|---|---|---|---|
| Measurements | (Jy) | (Jy) | (Jy) |
| MIPS | |||
| IRAS PSCaaIRAS Point Source Catalog data for IRAS 01391+5119 | |||
| IRAS FSCbbIRAS Faint Source Catalog data for IRAS F01391+5119 |
3.2. Possible Two-Component Structure in the Central Torus
In this section we give a more detailed analysis of the two-peak structure of the central torus. The measured peak separation is , , and respectively in the 24, 70, and bands. Figure 3a displays surface brightness profiles along the equatorial plane taken over the whole width () of the rectangular optical core.
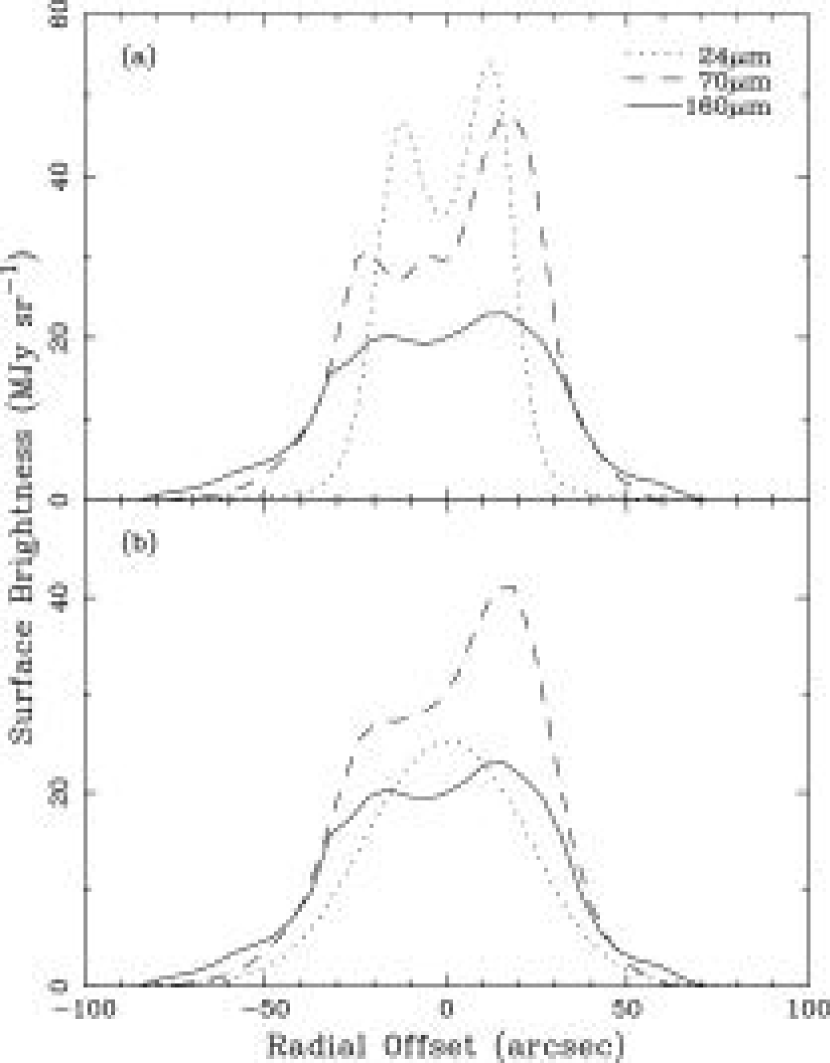
If the equatorial density profile follows a power law with the maximum density at the inner radius (i.e., , where is the density at the inner radius, ), the largest column density of the far-IR emitting material along the line of sight occurs near the inner radius (at locations away from the center along the equatorial plane). This means that the far-IR peaks occur near the inner radius when the dusty circumstellar shell is optically thin to far-IR radiation, as has been shown in dust radiative transfer models for proto-PN dust shells (e.g., Ueta et al. 2001; Meixner et al. 2002; Ueta & Meixner 2003; Meixner et al. 2004).
When the spatial resolution of the imaging bands is taken into account, the peaks are expected to occur progressively closer in the bands at longer wavelengths until the peaks become unresolved. This is why the peak separation is larger than the peak separation. In fact, when the image is convolved to have the spatial resolution of the band, the 70 and peaks occur at identical locations as demonstrated in Figure 3b. Given the spatial coincidence of the emission peaks in the 70 and bands, we interpret that these peaks represent the limb-brightened edges of a dusty torus. In this picture, the peak separation at the 70 and bands corresponds to the inner diameter of the dusty torus at a relatively low temperature.
On the contrary, the peak separation does not follow this trend. If the peaks in the band represented the Wien head of the spectral energy distribution (SED) of the dusty torus seen in the 70 and bands, the peaks should have been well resolved with the peak separation slightly larger than that in the band. However, this is not the case. Similarly, the 70 and peaks cannot be the Rayleigh-Jeans tail of the SED of a dusty torus whose presence can be inferred from the map. Since the beam size of the band is , the peaks ( separation) cannot be resolved. The band profile convolved with the beam indeed shows only one peak as demonstrated in Figure 3b. Hence, while the two-peak structure also suggests the presence of an edge-on torus, this torus must possess distinct physical properties with respect to the torus seen in the 70 and bands.
Imaging in various optical emission lines have suggested that ionization fronts are found only in very selected regions in the core and that the lobe edges are not ionization fronts (Balick, 1987; Balick et al., 1992). In particular, Balick (1987) presented an [N II] image showing two emission peaks about apart in the core and a He II image displaying two peaks about apart. The [N II] and He II peaks respectively represent “low” and “high” ionization regions. The [N II] peak separation is about if convolved with the beam, and thus, these peaks spatially corresponds to the possible low-temperature dusty torus revealed by the and maps. Similarly, the He II peak separation is about if convolved with the beam of the MIPS band, and thus, the He II peaks spatially corresponds to the other torus revealed by the maps. This is also demonstrated by the IAC optical images in Figure 1 (and Figure 6 for a close-up of the equatorial region). The “high” ionization region represented by [O III] emission corresponds to the peaks, while the “low” ionization region delineated by H and [N II] emission is coincident with the 70 and emission distribution.
In fact, Leene & Pottasch (1987) have shown that the mid- and far-IR structures of the Helix nebula (NGC 7293) are markedly distinct in the IRAS data, in which emission in the mid-IR () is concentrated in the central region. These authors have attributed the band emission mostly to the [O IV] line at . The following investigations have shown that the [O IV] distribution is also co-spatial with the He II distribution in the nebula (O’Dell, 1998; Speck et al., 2002). Moreover, H2 emission, which suggests the presence of a high density molecular reservoir, arises from the limb of the bipolar waist, which is spatially coincident with the 70 and peaks (Kastner et al., 1996; Hora et al., 2004).
Therefore, we conclude that the far-IR toroidal structure in NGC 650 consists of two distinct components. The first component is represented by the peaks and is a high-temperature torus encompassing the regions of high ionization. Given the spatial correlation between the emission region and the emission regions of high ionization species and similarities between NGC 650 and the Helix , we also suggest that the detected emission is largely due to the [O IV] line at . The second component is represented by the 70 and peaks and is a low-temperature dusty torus that is exterior to the high-temperature torus and is not yet very much ionized by the radiation from the central star.
3.3. The Remnant AGB Wind Shell
In this section, we continue our discussion on the low-temperature outer torus revealed in the 70 and bands. As reviewed in §1, the circumstellar dust shell of post-AGB stars develops its toroidal form in the innermost regions during the superwind phase (e.g., Meixner et al. 1999; Ueta et al. 2000). Such a torus would then keep expanding while decreasing its temperature during the subsequent evolutionary phases into the PN phase. Hence, we postulate that the dust torus seen in the 70 and maps is the remnant AGB wind shell that has been expanding since it was generated by the superwind at the end of the AGB phase.
Given that this outer dust torus is the remnant AGB wind shell, its surface brightness profiles would yield valuable information pertaining to the AGB mass loss history. If the farthest extent of the highly ionized region has reached only up to where the peaks are, the surface brightness distribution beyond the peaks reflects the mostly pristine AGB mass loss history that is still relatively undisturbed by the passage of the fast wind and ionization front.
In Figure 4, we present log-log plots of surface brightness profiles along the bipolar axis (top panel) and the equatorial plane (bottom panel). These profiles are constructed from cuts of width taken in images that are convolved with the beam to remove the difference due to resolution. Comparison between the top and bottom plots immediately indicates distinct mass loss histories along these two directions.
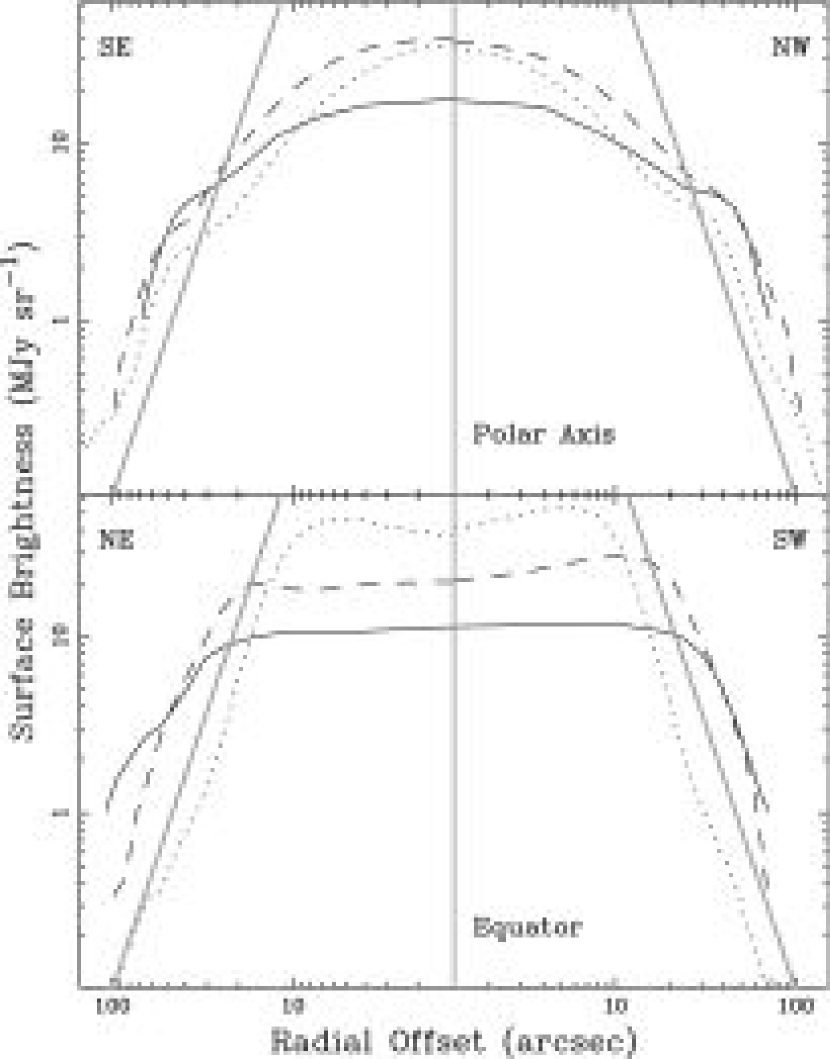
The equatorial profiles follow a nearly perfect power-law with an index of three along the edge of the nebula. In an optically thin isothermal dust shell, a power-law density profile of will yield a power-law surface brightness profile of . Thus, the index of three we have observed in the equatorial profiles suggests that the equatorial density profile follows . This means that at the end of the AGB phase (presumably the most effectively during the superwind phase) the rate of mass loss was enhanced rapidly, since a constant mass loss at constant velocity yields a profile with an index of two. Such a high power-law factor in density profiles of the late AGB/superwind shell is consistent with recent reports of both observational (e.g., Meixner et al. 2004; Hrivnak & Bieging 2005) and theoretical (e.g., Perinotto et al. 2004; Schönberner et al. 2005) studies.
Comparison between the equatorial profiles (Fig. 4, top) suggest possibly different mass loss histories along each edge of the torus. While the southwestern profiles remain steep with an index of three, the northeastern profiles are less steep especially beyond roughly in the . Thus, there appears to be a larger amount of lower temperature dust located at farther away from the central star on the northeast side of the torus (i.e., the ratio becomes large as a function of radius along the northeastern edge). One interpretation is that the period of the increased mass loss was less intense yet prolonged on the northeastern edge than on the southwestern edge. Such mass loss would result in a higher concentration of dust on the southwestern edge of the torus, which would cause a stronger dust emission as observed.
The polar profiles (Fig. 4, bottom) exhibit histories of more complex mass loss. The outer part () appears very similar to the equatorial profiles (showing a power-law with an index of three). However, the profiles flatten considerably (to an index of less than 0.5) roughly between to and then become steep again (to an index of about two) for . Unfortunately, the possible rejevenation of mass loss in the inner part is not entirely certain since the inner profiles are dominated by the bright torus of thickness. Nevertheless, the existence of the plateau region appears real.
Since the density profile follows in the outer part of the shell along both the polar and equatorial directions, it appears that the rate of mass loss was enhanced in all directions during the AGB phase. From the data, we recognize this interesting history of mass loss in this object, in which the initially isotropic mass loss enhancement ensued along the equator towards the end of the AGB phase while it ceased in the polar directions sometime before the end of the AGB phase. This is the only apparent change in mass loss during the late AGB phase prior to the formation of the equatorial density enhancement in the shell. In fact, the observed surface brightness profiles suggests the presence of a more prolate density distribution around the innermost toroidal density distribution. This is consistent with what the layered shell model proposes for the structure of the proto-PN shells (Ueta 2002; Ueta & Meixner 2003) based on the mid-IR and optical imaging surveys of the proto-PN shells (Meixner et al., 1999; Ueta et al., 2000; Meixner et al., 2002) as discussed above.
Therefore, we conclude from these profiles that (1) mass loss was enhanced nearly isotropically towards the end of the AGB phase, (2) mass loss in the polar directions precipitously decreased prior to the end of the AGB phase, and (3) the density distribution transformed from prolate spheroidal to toroidal during the late AGB phase. Although it is not entirely clear which parts of the profiles are pertinent to the superwind epoch, it appears evident that the superwind epoch at the end of the AGB phase is associated with a cessation of mass loss in the polar directions rather than an enhancement of it in the equatorial directions. This is a strikingly contrasting view of the late AGB mass loss with respect to a commonly-held assumption that there is an enhancement of mass loss into the equatorial plane. Nevertheless, the present data provide another piece of evidence that supports the presence of a transitional spheroidal shell between the outer spherical AGB shell and the inner toroidal superwind shell as proposed in the layered shell model (Ueta, 2002).
A particularly important aspect of the present work is that this transitional spheroidal shell has been observed in a bipolar PN. This is a direct observational evidence for the presence of the spheroidal density distribution beyond the inner torus in a bipolar PN. It has been typically (and probably naively) assumed that there is an absence of matter along the polar axis in bipolar shells of evolved stars, proto-PN shells and PNs alike. However, the presence of matter along the polar axis is evident in this bipolar PN, further increasing our confidence in the layered shell model. The present data also demonstrate that one can probe the AGB mass loss history via far-IR imaging of PNs as long as the shell structure is not altered by the passage of the ionization front and a fast wind.
In the following we estimate some quantities concerning the remnant AGB wind shell. By adopting the distance of 1.2 kpc (e.g., Koornneef & Pottasch 1998), the peak separation of (at ) translates into cm. Given the spatial resolution effect, this value should be taken as a lower limit for the inner diameter of the dust torus generated by the AGB mass loss. If we adopt a typical expansion velocity of 20 km s-1 (of a superwind) and assume constant-velocity expansion, the dynamical age of the dust torus is estimated to be yr. This value is consistent with theoretical predictions of the post-AGB evolution into the PN phase of intermediate mass ( M⊙) stars (e.g., Blöcker 1995).
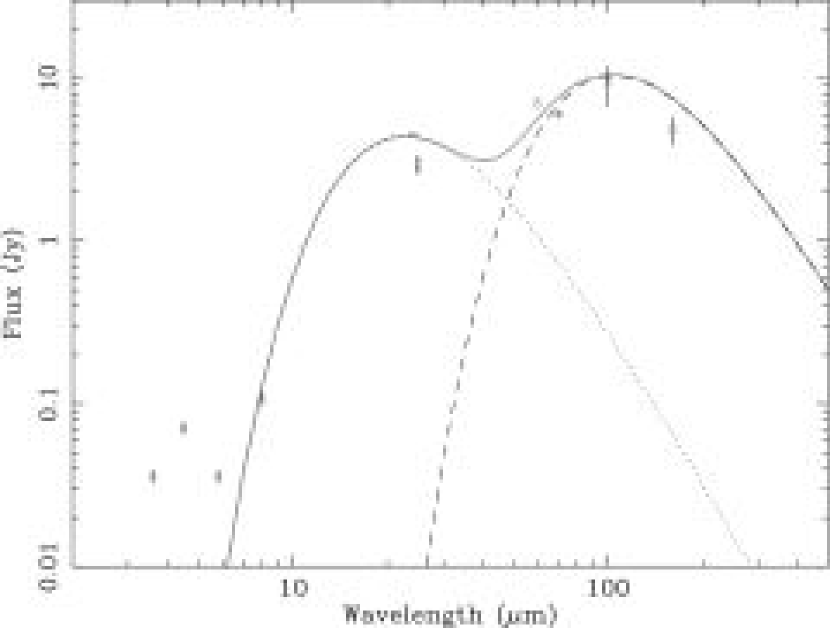
Assuming that there is no significant line contamination in the measured fluxes and that the dust shell is optically thin at far-IR, we can estimate the dust temperature in the torus by fitting the far-IR SED of the torus using the relation,
| (1) |
where is flux density at frequency , is the instrumental beam area, is an optical depth at (scaled by a power-law), and is the (representative) dust temperature along the line of sight. Assuming fluxes longward of represent the Rayleigh-Jeans tail of the SED, the overall dust emissivity index can be fixed to . By setting in the above relation, we obtain the least-squares fits of and under the two-component dust assumption, using the present MIPS fluxes and the past IRAS and IRAC fluxes. The dust temperatures are found to be K and K and the optical depth at is found to be . The SED and fitted curves are displayed in Figure 5. Given the power-law emissivity of the dust grains, the optical depth of the shell in the optical (at V) is : the torus is indeed optically thin to visible light.
If the overall dust opacity, , is known, the measured far-IR flux can be used to estimate the mass of dust in the torus through
| (2) |
Here, is the distance to NGC 650, is the speed of light, and is Boltzmann constant. Semenov et al. (2003) have computed Rosseland and Planck mean opacity tables for the dusty medium based on the dust composition model for accretion discs consisting of various silicates, organics (CHON material), amorphous water ice, FeS, and iron having various particle types. By adopting to 0.7 cm2 g-1 for the and (i.e., “normal” iron abundance) case from their opacity table, the above equation yields to M⊙ for the measured flux of Jy and the estimated dust temperature of K. With a canonical gas-to-dust ratio of 150, the total mass of the shell is estimated to be 2 to 4 M⊙. The gas-to-dust ratio is highly uncertain, and so is the estimate of the total mass of the shell. Nevertheless, the estimate is consistent with the inferred initial mass of the central star ( M⊙) based on the dynamical age of the torus compared with theoretical post-AGB tracks (see above). Given the extent of the observed far-IR emission () and the inner radius of the torus () plus the assumed wind velocity of 20 km s-1, the above values yield an overall mass loss rate of M⊙ yr-1.
3.4. The Post-AGB Shell
We will now focus our attention to the inner, high-temperature torus seen in the band. The peaks do not simply represent the inside wall of the dust torus which harbor high-temperature matter that is illuminated by the central star. If this were the case, the peaks should have been spatially coincident with the 70 and peaks. Based on a spatial correlation between the 70 and peaks and the high ionization regions of He II and [O III], we have concluded that the emission is probably largely affected by the [O IV] line at .
It is not impossible, however, to have dust emission in such highly ionized regions. For example, the past Infrared Space Observatory observations detected rather strong dust emission at in the central region (i.e., the most ionized region) of the Helix nebula (Speck et al., 2002). The map indicates that there is another emission peak near the center of the nebula (Figure 3a; right panel of Figure 6). Even in the map, there appears such emission at the nebula center: the “trough” between the emission peaks is very shallow (bottom panel of Figure 1; Figure 3).
Aperture photometry of this central region (within the inner radius of the low-temperature torus) yields 0.54 and 0.035 Jy respectively in the 70 and bands. These values are surprisingly close to the fluxes of the high-temperature SED component at these wavelengths (0.51 and 0.031 Jy respectively at 70 and ; Figure 5), which cannot at all be entirely attributed to photospheric emission of the central star ( and Jy respectively at 70 and extrapolated from the photospheric photometry in the IRAC bands presented by Hora et al. 2004). Using the estimated far-IR fluxes from the inner torus and cm2 g-1 for dust of 140 K from the opacity table of Semenov et al. (2003) in eqn (2), the mass of dust in this central peak is M⊙. Given that only part of the measured flux is dust-origin, this mass estimate can only be a rough upper limit. The inner torus is thus very tenuous.
Figure 6 shows the central region of the deconvolved 24 and contours overlaid respectively with the [O III] and H+[N II] grayscale maps. The deconvolved map shows an extension in the southwest peak towards the center of the nebula. This extension indicates the presence of some matter that fills the inner cavity of the torus. The deconvolved map also indicates the presence of some dust in the inner cavity of the torus, which probably represents the Rayleigh-Jeans tail of the high-temperature dust component as has been discussed above.
Thus, the inner cavity of the torus appears to be filled with highly ionized gas and some surviving dust behind the ionization front that has already engulfed the inner torus. Where does this matter in the inner cavity come from? There are two possibilities: this matter could come either from the central star or back from the torus. If the cavity-filling matter comes from the star, the matter is likely part of a fast wind. Then, it is very peculiar that a fast wind has generated wind-blown lobes along the bipolar axis, while maintaining a rather high concentration of matter along the equatorial plane.
Alternatively, matter in the torus that is engulfed by the ionization front can flow back towards the central star and fill the inner cavity of the torus, if the pressure from a fast wind cannot hold it. The back-flowing material from the torus initially fills the cavity, but eventually disperses into the lobes. The cavity-filling matter can get ionized by the radiation from the central star to generate even O+++. In fact, (Bryce et al., 1996) have observed multi-component [O III] 5007 emission line profile in the central region of the nebula, and the low-velocity components can be interpreted as back-flowing ionized gas. Therefore, the inner torus represented by the emission seems to consist of the ionized portion of the torus behind the ionization front, some ionized matter that has flown back towards the star filling the inner cavity of the torus, and some surviving dust species. Thus, the presence of the post-AGB wind shell in NGC 650 is not very likely.
4. Conclusions
We have investigated the AGB and post-AGB mass loss history in a bipolar PN, NGC 650, using far-IR maps at 24, 70, and taken with MIPS on-board the Spitzer Space Telescope. The far-IR surface brightness distribution shows two emission peaks at all three MIPS bands. These peaks represent the limb-brightened edges of a near edge-on, optically thin dusty torus. Hence, this PN’s far-IR structure is consistent with the known mid-IR structure of the PN progenitors, suggesting that a dusty torus in the circumstellar shells of evolved stars endure the transition from the post-AGB phase to the PN phase. The measured fluxes above three are , , and Jy respectively at 24, 70, and .
While the 70 and peaks are spatially coincident, the peaks are found interior to the peaks in the other bands. Based on the spatial correlation with the distribution of [N II], H+[N II], He II, and [O III] in the optical, we have concluded that the far-IR toroidal structure consists of two components. The 70 and peaks represent low-temperature ( K) dust continuum emission from the remnant AGB wind shell. The peaks correspond to the [O IV] line emission at arising from the highly ionized part of the inner torus which has been engulfed by the ionization front and the ionized matter that has flown back from the torus and filled the inner cavity of the torus.
The dynamical age of the remnant AGB wind shell is yr, assuming a constant expansion velocity of 20 km s-1 and the distance of 1.2 kpc. The least-squares fits to the far-IR SED have yielded the temperatures of and K for the two-component dust shell system and the optical depth of (i.e., ). The dust masses of the remnant AGB wind shell and the inner torus are estimated to be 1.4 to and M⊙, respectively. For a canonical gas-to-dust ratio of 150, the total mass of the shell is 2 to 4 M⊙, yielding an overall mass loss rate of M⊙ yr-1.
From the far-IR surface brightness profiles of the nebula that show a power-law index of as steep as three, we have also reconstructed this PN’s AGB mass loss history in which (1) mass loss was enhanced nearly isotropically towards the end of the AGB phase, (2) the enhanced mass loss in the equatorial directions ensued at the end of the AGB phase while that in the polar directions precipitously ceased prior to the end of the AGB phase, and (3) the density distribution transformed from prolate spheroidal to toroidal during the late AGB phase. Hence, the superwind phase at the end of the AGB phase is associated with a cessation of isotropically enhanced mass loss in the polar directions rather than an enhancement of it only in the equatorial directions.
This is a strikingly contrasting view of the late AGB mass loss with respect to a commonly-held assumption that there is an enhancement of mass loss only along the equatorial plane. The present data thus provide another evidence for the presence of a transitional spheroidal shell between the outer spherical AGB shell and the inner toroidal superwind shell, further increasing our confidence in the layered shell model for the circumstellar shells of post-AGB stars. Moreover, the data indicate that the mass loss enhancement into the equatorial direction is not strictly uniform in all azimuthal angles. Mass loss appears to be less intense but more prolonged on the northeast edge of the torus than the southwest edge, yielding higher concentration of dust at the inner radius on the southwest edge. Nevertheless, the present data also demonstrate that one can probe the AGB mass loss history via far-IR imaging of PNs as long as the shell structure is not altered by the passage of the ionization front and a fast wind.
References
- Balick (1987) Balick, B. 1987, AJ, 94, 671
- Balick et al. (1992) Balick, B., Gonzalez, G., Frank, A., & Jacoby, G. 1992, ApJ, 392, 582
- Blöcker (1995) Blöcker, T. 1995, A&A, 299, 755
- Bryce et al. (1996) Bryce, M., Mellema, G., Clayton, C. A., Meaburn, J., Balick, B., & López, J. A. 1996, A&A, 307, 253
- Dayal et al. (1998) Dayal, A., Hoffmann, W. F., Bieging, J. H., Hora, J. L., Deutsch, L, K., Fazio, G. G. 1998, ApJ, 492, 603
- Gledhill & Yates (2003) Gledhill, T. M., & Yates, J. A. 2003, MNRAS, 343, 880
- Hora et al. (2004) Hora, J. L., Latter, W. B., Allen, L. E., Marengo, M., Deutsch, L. K., & Pipher, J. L. 2004, ApJS, 154, 296
- Hrivnak & Bieging (2005) Hrivnak, B. J., & Bieging, J. H. 2005, ApJ, 624, 331
- Kastner et al. (1996) Kastner, J. H., Weintraub, D. A., Gatley, I., Merrill, K. M., & Probst, R. G. 1996, ApJ, 462, 777
- Koornneef & Pottasch (1998) Koornneef, J., & Pottasch, S. R. 1998, A&A, 335, 277
- Leene & Pottasch (1987) Leene, A. & Pottasch, S. R. 1987, A&A, 173, 145
- Manchado et al. (1996) Manchado, A., Guerrero, M. A., Stanghellini, L., & Serra-Ricart, M. 1996, The IAC Morphological Catalog of Northern Galactic Planetary Nebula (Tenerife, IAC)
- Meixner et al. (1993) Meixner, M., Skinner, C. J., Temi, P., Rank, D., Bregman, J., Ball, JṘ., Keto, E., Arens, J. F., & Jernigan, J. G. 1993, ApJ, 411, 266
- Meixner et al. (1997) Meixner, M., Skinner, C. J., Graham, J. R., Keto, E., Jernigan, J. G., & Arens, J. F. 1997, ApJ, 482, 897
- Meixner et al. (1999) Meixner, M., et al. 1999, ApJS, 122, 221
- Meixner et al. (2002) Meixner, M., Ueta, T., Bobrowsky, M., & Speck, A. K. 2002, ApJ, 571, 936
- Meixner et al. (2004) Meixner, M., Zalucha, A., Ueta, T., Fong, D., & Justtanont, K. 2004, ApJ, 614, 371
- O’Dell (1998) O’Dell, C. R. 1998, AJ, 116, 1346
- Perinotto et al. (2004) Perinotto, M., Schönberner, D., Steffen, M., & Calonaci, C. 2004, A&A, 414, 993
- Rieke et al. (2004) Rieke, G., et al. 2004, ApJS, 154, 25
- Schönberner et al. (2005) Schönberner, D., Jacob, R., Steffen, M., Perinotto, M., Corradi, R. L. M., & Acker, A. 2005, A&A, 431, 963
- Semenov et al. (2003) Semenov, D., Henning, Th., Helling, Ch., Ilgner, M., & Sedlmayr, E. 2003, A&A, 410, 611
- Skinner et al. (1994) Skinner, C. J., Meixner, M., Hawkins, G. W., Keto, E., Jernigan, J. G., & Arens, J. F. 1994, ApJ, 423, L135
- Speck et al. (2002) Speck, A. K., Meixner, M., Fong, D., McCullough, P. R., Moser, D. E. & Ueta, T. 2002, AJ, 123, 346
- Ueta (2002) Ueta, T. 2002, Ph.D. thesis, University of Illinois at Urbana-Champaign
- Ueta & Meixner (2003) Ueta, T., & Meixner, M. 2003, ApJ, 586, 1338
- Ueta et al. (2000) Ueta, T., Meixner, M., & Bobrowsky, M. 2000, ApJ, 528, 861
- Ueta et al. (2001) Ueta, T., et al. 2001, ApJ, 557, 831
- Werner et al. (2004) Werner, M. W. et al. 2004, ApJS, 154, 1