CO(1–0) in z4 Quasar Host Galaxies:
No Evidence for Extended Molecular Gas Reservoirs
Abstract
We present 12CO(=10) observations of the high–redshift quasi–stellar objects (QSOs) BR 1202-0725 (), PSS J2322+1944 (), and APM 08279+5255 () using the NRAO Green Bank Telescope (GBT) and the MPIfR Effelsberg 100 m telescope. We detect, for the first time, the CO ground–level transition in BR 1202-0725. For PSS J2322+1944 and APM 08279+5255, our observations result in line fluxes that are consistent with previous NRAO Very Large Array (VLA) observations, but they reveal the full line profiles. We report a typical lensing–corrected velocity–integrated intrinsic 12CO(=10) line luminosity of K km s-1pc2 and a typical total H2 mass of M⊙ for the sources in our sample. The CO/FIR luminosity ratios of these high– sources follow the same trend as seen for low– galaxies, leading to a combined solution of log. It has previously been suggested that the molecular gas reservoirs in some quasar host galaxies may exhibit luminous, extended 12CO(=10) components that are not observed in the higher– CO transitions. Utilizing the line profiles and the total intensities of our observations and large velocity gradient (LVG) models based on previous results for higher– CO transitions, we derive that emission from all CO transitions is described well by a single gas component where all molecular gas is concentrated in a compact nuclear region. Thus, our observations and models show no indication of a luminous extended, low surface brightness molecular gas component in any of the high–redshift QSOs in our sample. If such extended components exist, their contribution to the overall luminosity is limited to at most 30%.
Subject headings:
galaxies: ISM — cosmology: observations — galaxies: active — galaxies: starburst — galaxies: formation — galaxies: high-redshift1. Introduction
Understanding when and how galaxies form is one of the primary objectives in both observational and theoretical astrophysics. The mere fact that active galaxies, such as radio galaxies, QSOs, and emission line galaxies are observed up to redshifts of (e.g., Fan et al. 2001; Rhoads et al. 2001; Hu et al. 2002; Kodaira et al. 2003; Taniguchi et al. 2005), less than one Giga–year after recombination, implies that galactic scale (10 kpc), gravitationally bound structures exist at this early epoch. The study of the masses and dynamical state of these young systems serves as a direct constraint to the models describing the growth of large scale structures since the epoch of recombination.
Studies of the molecular and dusty interstellar medium (ISM) in these galaxies are of fundamental importance, since it is this medium out of which stars form; accurate determination of the molecular gas mass may therefore serve as an indicator of the evolutionary state of a galaxy. The detection of carbon monoxide (CO) is also a strong confirmation that star formation is going on in some of the highest redshift systems. In fact, the combination of molecular gas and dust detections with large far–infrared (FIR) luminosities provides the strongest evidence that a significant fraction of high– galaxies is undergoing starbursts at prodigious rates (M), consistent with the formation of a large elliptical galaxy on a dynamical timescale of 107–108 yr.
Over the past decade, more than 30 galaxies at have been detected in CO emission (Solomon & Vanden Bout 2005) out to a redshift of (Walter et al. 2003, 2004; Bertoldi et al. 2003), confirming the presence of intense starbursts in numerous high– galaxies. As most of these observations were obtained using millimeter interferometers, these detections were typically achieved by observing high– CO() transitions (). Although these high– lines exhibit in general higher peak flux densities than the ground–state () transition, it is possible that the higher order transitions are biased to the excited gas close to a central starburst and do not necessarily trace the entire molecular gas reservoir seen in 12CO(=10). Also, the conversion factor (’’) to derive molecular (H2) masses from measured CO luminosities has mostly been estimated for the 12CO(=10) line (e.g., Downes & Solomon 1998; Weiss et al. 2001). Observing 12CO(=10) has the additional advantage that properties of the highly redshifted sources can be directly compared to the molecular gas properties of nearby (starburst) galaxies which are predominantly mapped in the 12CO(=10) transition.
These are main motivations for observing the 12CO(=10) ground–state transition. However, due to the faintness of the line and the bandwidth limitations of current radio telescopes, such high– 12CO(=10) observations only exist for two QSOs and two radio galaxies to date. All of these observations have been obtained with radio interferometers operating at centimeter wavelengths – the NRAO Very Large Array (VLA; Papadopoulos et al. 2001; Carilli et al. 2002a; Greve et al. 2004) and the Australia Telescope Compact Array (ATCA; Klamer et al. 2005). In particular, due to the bandwidth limitations of the VLA, obtaining better constraints on the spectral line shape and total flux of the 12CO(=10) transition is desirable even for already detected sources. Today’s largest single dish telescopes, such as the NRAO Green Bank Telescope (GBT)111The Green Bank Telescope is a facility of the National Radio Astronomy Observatory, operated by Associated Universities, Inc., under a cooperative agreement with the National Science Foundation. and the MPIfR Effelsberg telescope222The Effelsberg telescope is a facility of the Max-Planck-Gesellschaft (MPG), operated by the Max-Planck-Institut für Radioastronomie (MPIfR)., can eliminate some of those issues due to their larger spectral bandwidths.
Here we report on first observations of 12CO(=10) in three CO–bright high– QSOs, which also exhibit ultra–luminous IR emission, using the GBT and the Effelsberg telescope. In Section 2, we describe our observations. Section 3 summarizes our results on the individual objects (BR 1202-0725 at , PSS J2322+1944 at , and APM 08279+5255 at ). Section 4 provides an analysis and discussion, and Section 5 closes with a summary of our results. We assume a standard cosmology throughout, with km s-1 Mpc-1, , and (Spergel et al. 2003).
2. Observations
2.1. GBT
Observations of the three targets were carried out with the GBT during 12 observing runs between October 2004 and April 2005 with a total observing time of 89.5 h. The total/on–source observing times were 31.5/20 h for BR 1202-0725, 23/15 h for PSS J2322+1944, and 35/22 h for APM 08279+5255. During all runs, 3C147 and 3C286 were used as primary/flux calibrators. For spectral line calibration, we observed IRC+10216, DR21, Orion IRc2, Orion HC, and W3OH H2O. As secondary/pointing calibrators, 3C273, J1256-0547 (for BR 1202-0725), J2253+1608 (for PSS J2322+1944), J0753+538, and J0824+5552 (for APM 08279+5255) were utilized. The pointing accuracy, determined by continuum cross scans of nearby sources, was typically 3″ (reaching 1″ under the best conditions). We estimate the calibration to be accurate to 10–15%. As the 12CO(=10) transition at 115.2712 GHz is redshifted into the band for all three targets (BR 1202-0725: GHz, PSS J2322+1944: GHz, APM 08279+5255: GHz), the dual–beam, dual–polarization 18–26 GHz receiver was used for all observations. The beam size of the GBT at our observing frequencies is 32–36′′ (225–250 kpc at ), i.e., much larger than our targets. The two beams have a fixed separation of 178.8′′ in azimuth direction. Two different spectrometer setups were used; half of the observing runs were executed in the first mode, and the other half of the runs in the second mode. The first mode features two simultaneous intermediate frequencies (IFs) with a bandwidth of 800 MHz (10,000–12,000 km s-1 at our observing frequencies) and 2048 channels each, resulting in a spectral resolution of 391 kHz (5 km s-1). The 12CO(=10) line was always centered in the first 800 MHz IF. The second mode has one IF with 200 MHz (2,500–3,000 km s-1) and 16384 channels, resulting in a spectral resolution of 12 kHz (0.15 km s-1). BR 1202-0725 and APM 08279+5255 were observed with both setups, while PSS J2322+1944 was only observed during runs that used the second setup. The spectra taken in each mode were examined separately and then combined. The ON–OFF position switching mode was used, i.e., the target was observed alternatively with the two telescope beams, and the off–source beam was always monitoring the sky background in parallel. The beam switching frequency was once every 60–120 seconds depending on the observing run. The weather was excellent for the winter nights with typical zenith system temperatures of K on a scale. On April 19 and 20, 2005, the system temperatures were significantly higher (typically K).
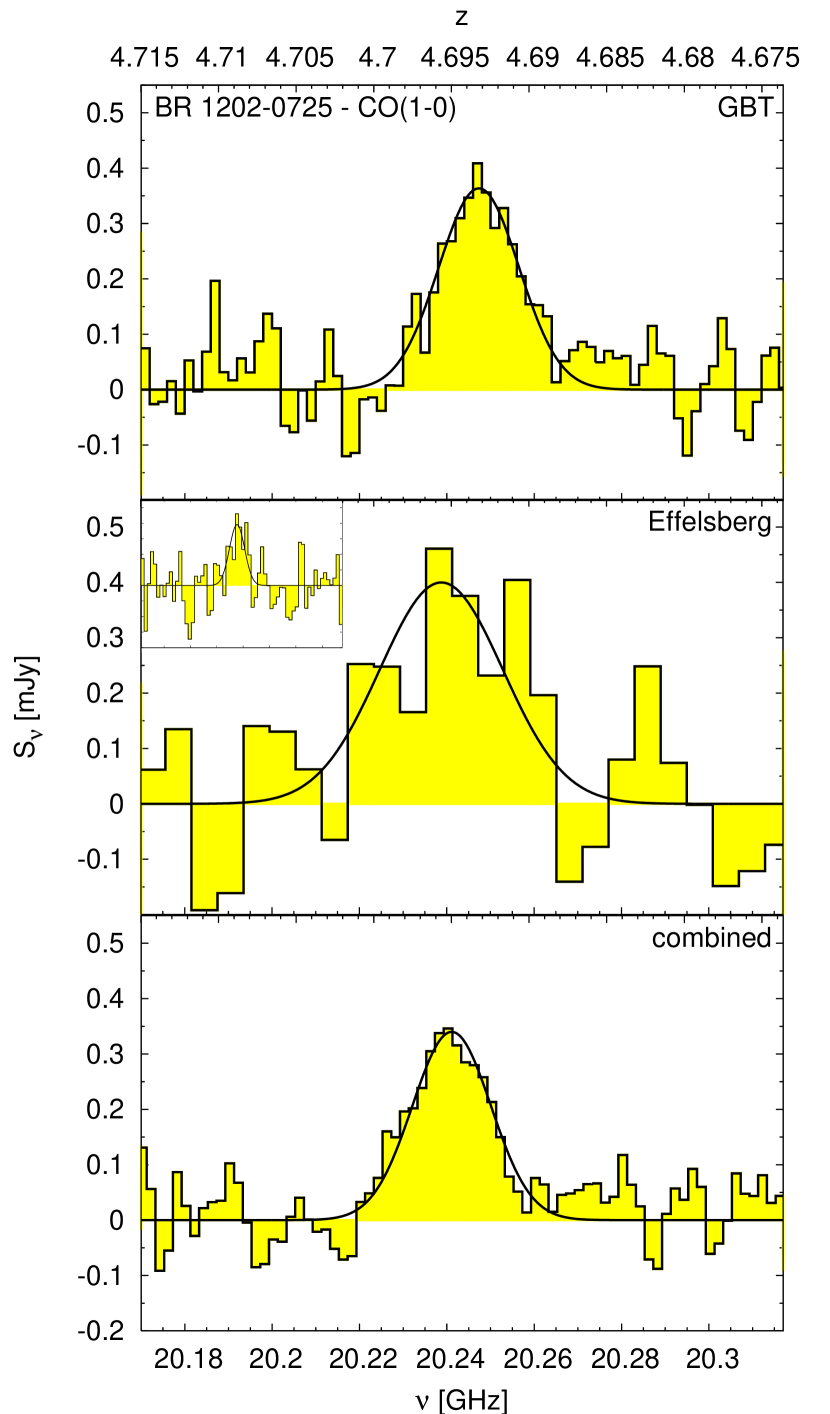
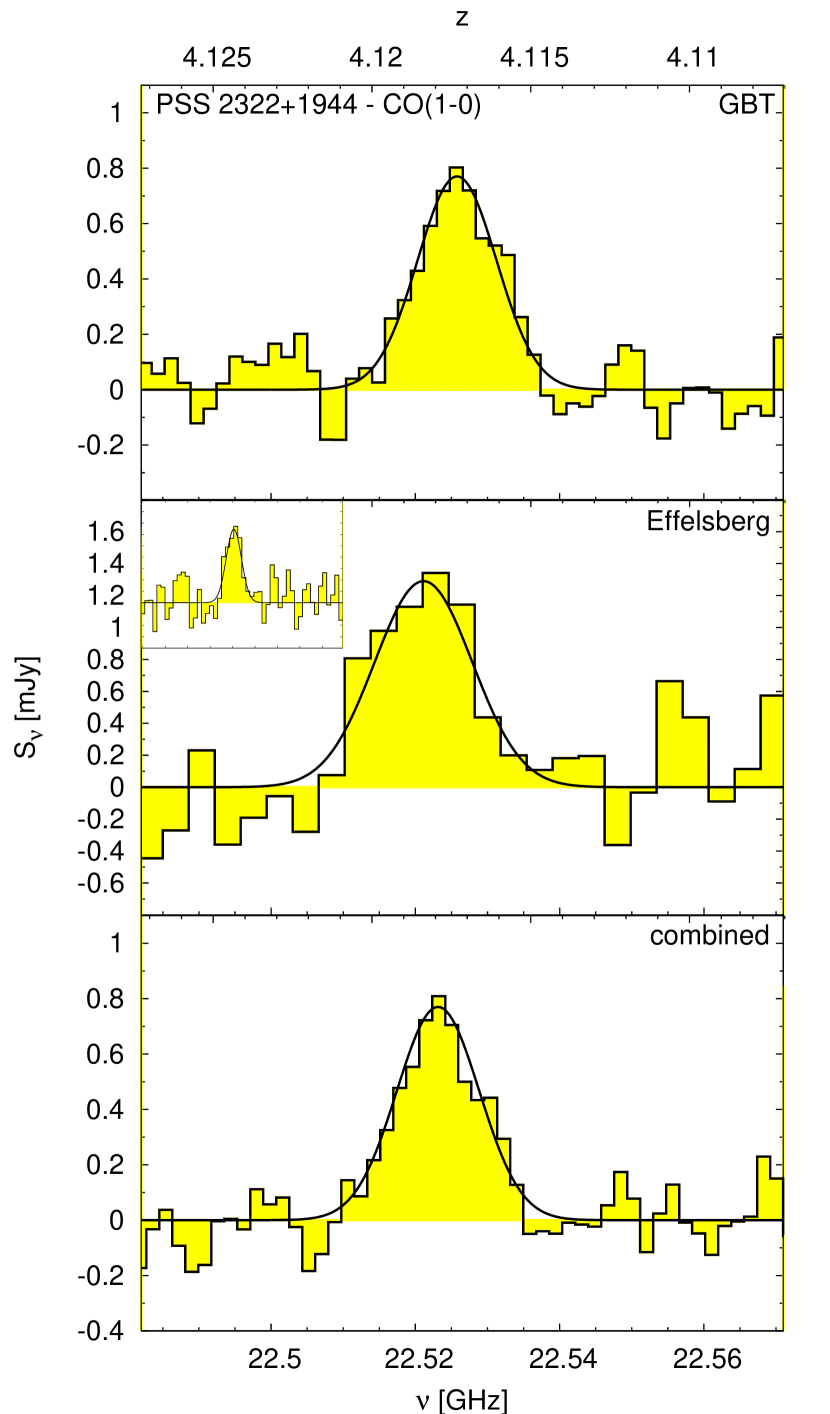
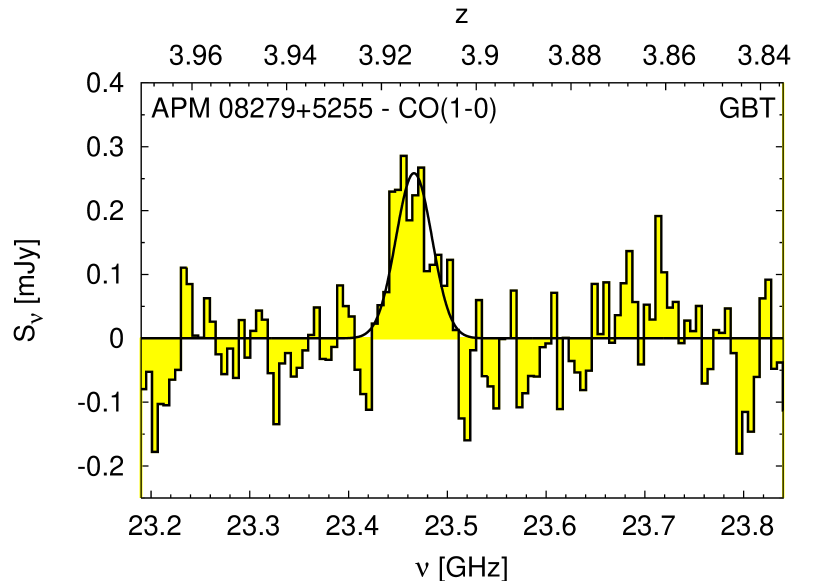
For data reduction, the aips++333aips2.nrao.edu package and the new GBT IDL software444gbtidl.sourceforge.net were used, providing consistent results. The spectra of BR 1202-0725, PSS J2322+1944 and APM 08279+5255 were binned to 2.00 MHz (30 km s-1), 1.80 MHz (24 km s-1), and 5.86 MHz (75 km s-1), reaching rms noise values of 75 Jy, 140 Jy, and 65 Jy. A linear baseline was subtracted from the PSS J2322+1944 spectrum to remove continuum fluxes and atmospheric/instrumental effects. For BR 1202-0725 and APM 08279+5255, polynomials of order 2 have been used to remove a very wide (100 MHz, i.e., much broader than the width of the CO line) ‘bending‘ of the baselines. Only the frequency range that was used to define the spectral baselines is used for the final GBT spectra. APM 08279+5255 was observed using both the 200 MHz and 800 MHz bandwidth setups. While the 12CO(=10) line was clearly detected with both setups, the spectrum obtained with the narrow–band high–resolution 200 MHz setup shows significant baseline problems, as the continuum level is significantly different on the red and blue sides of the line. Therefore, we only use the results obtained with the wide 800 MHz bandwidth setup (corresponding to 15 h on–source, and covering a velocity range of 8,000 km s-1) for the final spectrum. In addition to simple ON-OFF combinations and subtraction of low–order polynomial spectral baselines, we also followed the scheme proposed by Vanden Bout et al. (2004) for reconstructing the temporal baseline variations, however found that this did not improve our final results. The reduced spectra were read into GILDAS/CLASS555www.iram.fr/IRAMFR/GILDAS to write out the final combined spectrum tables. The final spectra are shown in the top panels of Figs. 1 and 2 and in Fig. 3. We note that the spectrum of BR 1202-0725 is limited to the central 150 MHz due to the fact that about half of the data were taken with the narrower 200 MHz setting.
2.2. Effelsberg
Observations were carried out towards BR 1202-0725 and PSS J2322+1944 in January and February 2003 with a total observing time of 40 h (20 h per source, corresponding to 8 h on–source each). At 40″ beam size, the pointing accuracy, as determined by continuum cross scans of nearby sources, was better than 10″, with typical values of 5″. Calibrations for the gain as well as the variation of the atmospheric opacity and zenith distance were obtained from observations of 3C286 and NGC 7027 (see Ott et al. 1994 for reference fluxes), leading to a total formal calibration uncertainty of 15%. We observed in beam switching mode utilizing a rotating horn with a beam throw of 2′ and a switching frequency of 1 Hz. We have used a dual polarization HEMT receiver for all observations. The autocorrelator backend was split into eight bands of 160 MHz bandwidth and 128 channels each that could individually be shifted in frequency by up to 250 MHz relative to the recessional velocity of the targets. The final spectra cover a velocity range of 6,000 km s-1 with channel spacings of 16 km s-1. We achieved single channel system temperatures of 65 K and 85 K on a scale. After combination of both orthogonal linear polarizations, this leads to a of 47 K and 60 K.
The GILDAS/CLASS package was used for data reduction. All spectral baselines are of good quality and only first order polynomial baselines had to be subtracted. The final spectra of BR 1202-0725 and PSS J2322+1944, are shown in the middle panels of Figs. 1 and 2. These spectra were binned to 5.97 MHz (88 km s-1) and 3.60 MHz (48 km s-1), reaching rms noise values of 150 Jy and 380 Jy. We note that the latter do not show the full ranges used for spectral baseline fitting. Those ranges (380 MHz for BR 1202-0725, and 180 MHz for PSS J2322+1944) are illustrated by the insets in the same figures.
2.3. Combined spectra
As BR 1202-0725 and PSS J2322+1944 were observed with both telescopes, we also created combined spectra of both results to increase the signal–to–noise ratio and average out part of the calibrational uncertainties. The GILDAS/CLASS package was used to reprocess and combine the final spectra of both telescopes. The final unbinned GBT and Effelsberg spectra were regridded to a common velocity resolution and baseline–subtracted before combination. In the combination, spectra were weighted with their respective rms. The combined spectra of BR 1202-0725 and PSS J2322+1944, as shown in the bottom panels of Figs. 1 and 2, were binned to a resolution of 2.00 MHz (30 km s-1) and 1.80 MHz (24 km s-1), reaching rms noise values of 70 Jy and 125 Jy.
3. Results
The sources in our study are the three CO–brightest high–redshift QSOs that can currently be observed in the 12CO(=10) transition. We obtained detections for all our targets. CO line luminosities (in K km s-1pc2) were derived utilizing:
| (1) |
where is the velocity–integrated 12CO(=10) line flux in Jy km s-1, is the luminosity distance in Mpc, and is the observed frequency in GHz (Solomon et al. 1992). For the systems with known lensing magnification factor , has to be divided by that factor in order to get the intrinsic CO luminosity of the discussed target. A conversion factor M/K km s-1pc2 to convert to is assumed throughout, as applicable for local ultra–luminous infrared galaxies (ULIRGs)/starbursts (Downes & Solomon 1998). All observational results are summarized in Table 1. Derived CO luminosities and gas masses as well as FIR luminosities from the literature are given in Table 2.
3.1. BR 1202-0725
3.1.1 Previous results
BR 1202-0725 () was detected in multiple CO transitions before (see Table CO(1–0) in z4 Quasar Host Galaxies: No Evidence for Extended Molecular Gas Reservoirs), but not in 12CO(=10). This optically bright, radio–quiet QSO has the curious property that the optical QSO is a single source, but the mm continuum and CO line observations show a double source with a separation of about 4′′ (Omont et al. 1996; Guilloteau et al. 1999; Carilli et al. 2002b). This double morphology may indicate a pair of interacting objects separated by only 28 kpc (Yun et al. 2000; Carilli et al. 2002b). An alternate explanation would be a double starburst system composed of a QSO (southern source) and a dust–obscured, Ly– - emitting companion (northern source, Hu et al. 1996), which is ionized by the strong QSO. Recently, Klamer et al. (2004) suggested that the nature of the double source might be due to jet–induced star–formation, where the northern component corresponds to a radio hot spot. It has been discussed that the quasar activity in this system may be triggered by gravitational interaction with the companion. Using typical conversion factors for a ULIRG (Downes & Solomon 1998), the total molecular gas mass derived from the CO luminosity exceeds the dynamical mass of the system (Carilli et al. 2002b), and as a remedy for this inconsistence, gravitational lensing has been suggested. However, the same authors argue that masses and velocity widths of the components are very different, therefore it appears unlikely that the multiple components are different lensed images of one source.
3.1.2 New observations
The final 12CO(=10) spectra of BR 1202-0725 are shown in Fig. 1 (top panel: GBT, middle panel: Effelsberg, bottom panel: combined spectrum). Gaussian fitting to the line profile of the combined spectrum results in a peak flux density of 0.34 0.03 mJy and a FWHM of 333 30 km s-1. The integrated 12CO(=10) line flux is 0.120 0.010 Jy km s-1. This agrees well with the extrapolated value of 0.123 0.013 Jy km s-1 derived from the 12CO(=21) flux (Carilli et al. 2002b) under assumption of fully thermalized and optically thick CO emission (see also discussion in Sect. 4.1). The width of the 12CO(=10) line is consistent within the error bars with an average of the higher– transitions in the literature ( km s-1, see Table CO(1–0) in z4 Quasar Host Galaxies: No Evidence for Extended Molecular Gas Reservoirs). The derived redshift of 4.6949 0.0003 is in good agreement with the 12CO(=54) redshift (Omont et al. 1996, northern and southern components combined). The structure of this source is unresolved at the resolution of our measurements; all line parameters are in good agreement with the higher– lines adding up both components.
The derived CO line luminosity of K km s-1pc2 results in an H2 gas mass of M⊙ (see also Tab. 2).
3.2. PSS J2322+1944
3.2.1 Previous results
The QSO PSS J2322+1944 is an IR–luminous high–redshift source (see Table 2) that is known to exhibit strong CO line emission in multiple transitions (see Table CO(1–0) in z4 Quasar Host Galaxies: No Evidence for Extended Molecular Gas Reservoirs). Optical imaging and spectroscopy reveal a double source structure, and the two components are separated by about . The spectra of both peaks are essentially identical, consistent with strong gravitational lensing (optical magnification factor ) by an intervening foreground galaxy (Carilli et al. 2003). In high–resolution VLA images, Carilli et al. (2003) find a molecular Einstein Ring with a diameter of in 12CO(=21) line emission, which can be modeled as a circumnuclear star–forming disk with a radius of 2.2 kpc (CO magnification factor ). The derived intrinsic star–formation rate (SFR) is of order 900 M⊙ yr-1. PSS J2322+1944 exhibits strong, non–thermal (synchrotron) radio continuum emission at 1.4 GHz, and the rest–frame radio–to–IR spectral energy distribution (SED) resembles that of local nuclear starburst galaxies like M82 (Cox et al. 2002). This QSO is the fourth high– CO emitter to be detected in [C I] emission (Pety et al. 2004), providing additional evidence for the presence of active star–formation in the host galaxy.
3.2.2 New observations
The final 12CO(=10) spectra of PSS J2322+1944 are shown in Fig. 2 (top panel: GBT, middle panel: Effelsberg, bottom panel: combined spectrum). From Gaussian fitting to the combined spectrum, the peak line flux density is found to be 0.77 0.07 mJy, the line FWHM is 190 14 km s-1, and the integrated line flux is 0.155 0.013 Jy km s-1. These values are in good agreement with the 12CO(=10) detection of Carilli et al. (2002a; mJy, km s-1, Jy km s-1), although results for the higher– CO transitions indicate a larger linewidth ( km s-1, see Table CO(1–0) in z4 Quasar Host Galaxies: No Evidence for Extended Molecular Gas Reservoirs). The Gaussian fit gives a redshift of 4.1179 0.0002.
The derived lensing–corrected CO line luminosity of K km s-1pc2 results in an H2 gas mass of M⊙ (see also Tab. 2).
3.3. APM 08279+5255
3.3.1 Previous results
APM 08279+5255 is a strongly lensed, radio–quiet broad absorption line (BAL) QSO at . Gravitational lens models of the QSO continuum source suggest magnification by a factor of , and the image breaks up into three components with a maximum separation of (Ledoux et al. 1998; Ibata et al. 1999; Egami et al. 2000). APM 08279+5255 has been detected in the mm and sub–mm dust continuum, revealing an apparent bolometric luminosity of L⊙ (Lewis et al. 1998). A multi–transition CO study (see Table CO(1–0) in z4 Quasar Host Galaxies: No Evidence for Extended Molecular Gas Reservoirs) in combination with detailed lens models appear to reveal a spatially extended structure on a scale of at least 400 pc (Lewis et al. 2002), which is gravitationally magnified by a factor of . The strength of the 12CO(=98) emission indicates the presence of hot dense gas with a kinetic temperature of approximately 200 K (Downes et al. 1999).
From VLA imaging of the CO ground–state transition at a linear resolution of , Papadopoulos et al. (2001) report the detection of an extended, low–excitation molecular gas reservoir around the compact nucleus which extends over a scale of (30 kpc). The integrated brightness temperature of this extended domain appears to be of the same order of magnitude as that of the nuclear region. This extended reservoir would be well within our 32′′ GBT beam. Papadopoulos et al. (2001) do not derive the total flux in the extended reservoir. For the central 1′′ (corresponding to 7.2 kpc at the source redshift), which they call ”the nuclear 12CO(=10) emission”, they find an integrated flux of 0.150 0.045 Jy km s-1. The VLA bandpass used by Papadopoulos et al. (2001) has an effective bandwidth of 45 MHz, or 575 km s-1 at the 12CO(=10) line frequency. Therefore, assuming that the peak in their Figure 1c is 6.5Jy beam-1 (Jy beam-1), we consistently derive an integrated flux over the peak of 0.15 Jy km s-1 beam-1. However, Papadopoulos et al. (2001) suggest that this peak of ’nuclear emission’ sits on a broad, extended plateau (see their Figure 1c). If we assume that the extended reservoir component is traced by their 2 (Jy beam-1) contour, it has a width of 8′′3′′, or 4.7 beam areas at the given resolution of 2.25′′2.25′′. This corresponds to a flux of 0.22 Jy km s-1 for the extended emission. The same estimate for their 3 (Jy beam-1) contour gives a width of 7′′2.25′′, or 3.1 beam areas. This again corresponds to a flux of 0.22 Jy km s-1 (note that both these estimates are lower limits for the extended emission). The total flux in the 12CO(=10) map of Papadopoulos et al. (2001) is therefore estimated to be 0.37 Jy km s-1. The same authors also suggest that this reservoir breaks up into multiple components at higher resolution; in their 12CO(=21) observations at 0.5′′ resolution, they claim to find two emitting regions 2–3′′ distant from the central region – if real, these could be companion galaxies which are not individually resolved in the extended 12CO(=10) reservoir.
3.3.2 New observations
The final 12CO(=10) spectrum of APM 08279+5255 is shown in Fig. 3. We derive a 12CO(=10) peak flux of 0.26 0.04 mJy and an FWHM of 556 55 km s-1 from our Gaussian fit. This results in an integrated line flux of 0.152 0.020 Jy km s-1, which is in good agreement with the value of 0.150 0.045 Jy km s-1 found by Papadopoulos et al. (2001) for the central 1′′ (”the nuclear 12CO(=10) emission”). However, our result is inconsistent with the integrated flux of 0.37 Jy km s-1 given by our estimate of their full 12CO(=10) reservoir (see previous subsection). Such a high flux is clearly ruled out by our GBT observations. We thus find no evidence for a luminous extended halo, which would be well within our 32′′ beam, and cannot confirm the existence of bright companion galaxies. The derived FWHM velocity width of our 12CO(=10) detection is in agreement with single–dish observations of the 12CO(=65), 12CO(=109), and 12CO(=1110) transitions obtained with the IRAM 30 m telescope (500 km s-1, Weiss et al. 2006, in prep.) and IRAM Plateau de Bure interferometer observations of the 12CO(=43) transition (480 35 km s-1, Downes et al. 1999, see Table CO(1–0) in z4 Quasar Host Galaxies: No Evidence for Extended Molecular Gas Reservoirs). Our derived 12CO(=10) redshift of 3.9122 0.0007 is in good agreement with previous results (3.9114 0.0003 for the 43 transition). The derived lensing–corrected CO line luminosity of K km s-1pc2 results in an H2 gas mass of M⊙ (see also Tab. 2).
4. Analysis and Discussion
4.1. LVG modeling
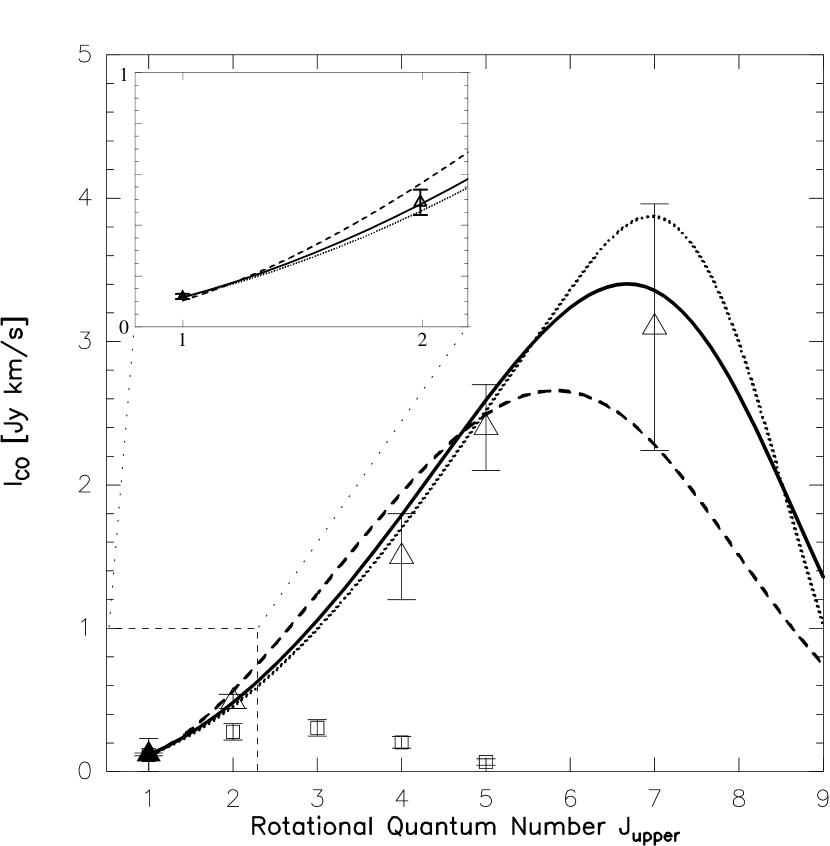
To investigate how much of the 12CO(=10) emission in our target QSOs is associated with the molecular gas reservoirs detected in the higher– CO transitions, we have used spherical, one–component large velocity gradient models (LVG). All these LVG calculations use the collision rates from Flower & Pineau des Forets (2001) with an ortho/para H2 ratio of 3 and a CO abundance per velocity gradient of [CO]/( km s-1)-1 (e.g. Weiss et al. 2005). Models were fitted to those lines above the 12CO(=10) transition listed in Table CO(1–0) in z4 Quasar Host Galaxies: No Evidence for Extended Molecular Gas Reservoirs for each source. The turnover of the CO line SED (and therefore the slope beyond the turnover) is not well determined. Thus, a large degeneracy exists between the kinetic gas temperature and density , the two main free parameters in our study. As an example, Figure 4 shows data of all transitions and three representative models for BR 1202-0725: Model 1 (solid line) assumes K and cm-3, and gives the overall best fit to all transitions. Models 2 (dashed line) and 3 (dotted line) are shown as a representation of the parameter space allowed by the data within the error bars. Model 2 assumes K and cm-3, while model 3 assumes K and cm-3. The LVG predicted 12CO(=10) flux of the different models based on the CO transitions is fairly well constrained by the solutions. Most of our calculated models suggest that the CO emission is close to thermalized up to the 12CO(=43) transition and optically thick (), which implies that the LVG predicted 12CO(=10) line fluxes are similar to those we would derive by assuming a scaling of the line flux densities from the mid– CO transitions. The predicted LVG integrated flux ranges of the 12CO(=10) transition are 0.10–0.12 Jy km s-1 (BR 1202-0725), 0.20–0.23 Jy km s-1 (PSS J2322+1944), and 0.13–0.20 Jy km s-1 (APM 08279+5255) and are in good agreement with our observations for all sources. As described in Sect. 3.2.2, the observed 12CO(=10) linewidth in our new observations and in the VLA spectrum (Carilli et al. 2002a) of PSS J2322+1944 is lower than that of the higher– transitions, thus the integrated model fluxes are a bit higher than our result. If we compare the peak fluxes only, we obtain a good agreement.
Our observations and models are in agreement with the assertion that all observed 12CO(=10) flux density is associated with the highly excited molecular gas seen in the high– CO lines. We thus find no evidence for an additional luminous, more extended low surface brightness gas component surrounding the central region of our target QSOs, in contrast to what has been suggested previously for APM 08279+5255 (Papadopoulos et al. 2001). Given the accuracy of our measurements, we conclude that at most 20–30% of the 12CO(=10) luminosity may be associated with such a diffuse component. We note however that, if the to conversion factor (’’) for a faint extended component were higher (e.g. Galactic), a higher H2 mass may be hidden in such an extended component.
4.2. Correlations of high and low redshift galaxies
CO results for our three high–redshift IR–luminous QSOs are summarized in Tab. 1 and 2. Our sample consists of all three high– QSOs for which the CO ground–state transition has been detected to date, and covers 20% of the CO–detected quasars. As discussed above, the 12CO(=10) transition provides the best information of the total amount of molecular gas in a system, quantified by . For most QSOs/galaxies detected in CO at high , 12CO(=32) and 12CO(=43) are the lowest transitions that have been detected to date. Based on our results in the previous paragraph, however, we can now estimate their by assuming constant brightness temperature for all transitions from 12CO(=10) to 12CO(=43) (i.e., is the same for those transitions). This assumption is also in agreement with observations towards the radio galaxy 4C60.07 (Greve et al. 2004). However, it is important to note that all high– sources were selected via higher– CO transitions, which could, in principle, introduce a bias towards highly excitated starburst environments.
Following Sanders et al. (1991), Gao & Solomon (2004) found a non–linear relation between the logarithms of the FIR luminosity and the 12CO(=10) line luminosity for a sample of local spiral galaxies, luminous, and ultra–luminous infrared galaxies. Their sample consists mostly of galaxies whose FIR luminosity is powered by star formation only. Our 12CO(=10) observations and LVG models suggest that can be estimated for all CO–detected high– sources with some degree of confidence, even if only observations of higher– CO transitions exist for most of these sources. To put this result into context, we now aim to discuss the – relation and its implications for some selected samples of galaxies at low and high redshift.
Figure 5 shows the relationship between log() and log() for our three targets, all other high– CO detections (except TN J0924-2201, which does not have a measured FIR luminosity), the Palomar–Green (PG) QSOs from Alloin et al. (1992), Evans et al. (2001), and Scoville et al. (2003) including PDS 456 (Yun et al. 2004), local () ULIRGs from Solomon et al. (1997), and the local galaxy sample () of Gao & Solomon (2004). All FIR luminosities for the high– sources are re–derived as described by Carilli et al. (2005) unless stated otherwise. Lensing magnification factors were taken into account. In addition, data for the Milky Way disk (Fixsen et al. 1999) and an (extrapolated) relation for Galactic molecular clouds (Mooney & Solomon 1988) are given for comparison. The solid line is a straight–line least squares fit to the Gao & Solomon (2004) sample, corresponding to log (the power law index is 1.25 0.08 in the original publication). Fitting the high– sources, the Gao & Solomon (2004) data, the Solomon et al. (1997) ULIRGs, and the PG QSOs together, we find the relation log. Both relations are clearly non–linear, as their power–law indexes are significantly larger than unity (see also the corresponding discussion in Gao & Solomon 2004). We recover a Schmidt–Kennicutt law (power law index of 1.4, Kennicutt 1998a,b) for the larger, more heterogenous sample. More importantly, the high– sources seem to follow the same slope (within the errors) as seen at low , even though most high– sources harbor central AGNs. In addition, the high– QSOs and high– sub–millimeter and radio galaxies (likely lacking a luminous AGN) statistically occupy the same area in the plot. The same behaviour is found for the PG QSOs in comparison to the low– spirals/LIRGs/ULIRGs. It is in general not clear that the FIR emission comes mostly from star–formation, i.e. that it is not strongly biased by active nuclei or the interstellar radiation field. E.g., SED modeling of the quasar H1413+117 (the Cloverleaf) reveals that only 20% of its FIR luminosity is powered by star formation (Solomon et al. 2003), but it is not an outlier in the – diagram. In this context, the elevated / ratio in APM 08279+5255 may be explained by a combination of differential lensing and a relatively high contribution of the AGN to (see Rowan–Robinson 2000 for models of the IR SED). Outliers like APM 08279+5255 are also found at low (e.g. the QSO PDS 456 and the warm ULIRG IRAS 08572+3915, see Fig. 5). As the relative number of such outliers is very small, this may also be explained by a brief FIR–bright AGN phase (Yun et al. 2004). However, it is likely that the dominant energy source in most ULIRGs is an extreme starburst rather than heating by a dust–enshrouded AGN (e.g., Solomon et al. 1997; Downes & Solomon 1998). This picture is supported by the finding that ULIRGs harbor large quantities of dense molecular gas, which is more intimately involved with star formation than the major fraction of the mostly diffuse CO (Gao & Solomon 2004). It has to be kept in mind that the high– sources are highly selected, and probably fulfill the Malmquist bias (i.e., the apparent increase in the average and towards high redshift is probably a consequence of the flux limitation in the sample, e.g. Sandage 1994). As an additional consequence of flux limitation in the sample, lensing influences the results (i.e., stronger lensing magnification allows to probe deeper, and therefore the intrinsic CO luminosity drops).
We can also set an approximate lower limit on the duration of the intense starburst phase. Considering the total H2 masses and star–formation rates in Table 2, the depletion timescale of the molecular gas is of order 107 yr for all three QSOs under the assumption of a constant SFR and 100% star–forming efficiency. This implies that the starburst itself can be relatively short–lived, (and compact, as the dynamical time must be less than the starburst lifetime) unless the molecular gas in which the star–formation occurs can be re–supplied on timescales of yr.
5. Summary
We have detected 12CO(=10) emission in three QSOs at redshifts with the NRAO GBT and the MPIfR Effelsberg telescope. From our
analysis of the resulting spectra of BR 1202-0725, PSS 2322+1944,
and APM 08279+5255, we obtain the following results:
1. We derived lensing–corrected 12CO(=10) line luminosities of K km s-1pc2 for BR 1202-0725, K km s-1pc2 for PSS 2322+1944, and K km s-1pc2 for APM 08279+5255. These results are in good agreement (within a factor of 2) with previous estimates of the total CO luminosities based on the higher– CO transitions, consistently providing very large of M⊙.
2. 12CO(=10) fluxes predicted by one–component LVG models are in good agreement with our observations. Considering our modeling results, the CO emission appears to be close to thermalized up to the 43 transition in all cases. Thus, our observations show no indication of a luminous extended, low surface brightness molecular gas component in any of the high–redshift QSOs in our sample (cf. Papadopoulos et al. 2001). In fact, all CO transitions are described very well by a single gas component where all molecular gas is concentrated in a compact circumnuclear region. If such extended components were to exist, our observations and models limit their contribution to the overall luminosity to at most 20–30%.
3. log() and log() appear to be correlated for low–redshift galaxies over orders of magnitude in including (U)LIRGs, and the significantly brighter sources found at high– appear to follow the same general trend (see also Solomon & Vanden Bout 2005). In particular, we find that the correlation shows no significant difference between QSOs and systems without a luminous AGN.
The observations presented herein demonstrate the feasibility of detecting high– CO with 100 m single–dish radio telescopes, and highlight the physical implications of observing the ground–state transition of this molecule towards massive galaxies at redshifts greater than 4.
References
- (1) Alloin, D., Barvainis, R., Gordon, M. A., & Antonucci, R. R. J. 1992, A&A, 265, 429
- (2) Beelen, A., Cox, P., Benford, D. J., et al. 2006, ApJ, 642, 694
- (3) Bertoldi, F., Cox, P., Neri, R., et al. 2003, A&A, 409, L47
- (4) Carilli, C. L., Cox, P., Bertoldi, F., et al. 2002a, ApJ, 575, 145
- (5) Carilli, C. L., Kohno, K., Kawabe, R., et al. 2002b, AJ, 123, 1838
- (6) Carilli, C. L., Lewis, G. F., Djorgovski, S. G., et al. 2003, Science, 300, 773
- (7) Carilli, C. L., Solomon, P., Vanden Bout, P., et al. 2005, ApJ, 618, 586
- (8) Cox, P., Omont, A., Djorgovski, S. G., et al. 2002, A&A, 387, 406
- (9) Downes, D., & Solomon, P. M. 1998, ApJ, 507, 615
- (10) Downes, D., Neri, R., Wiklind, T., et al. 1999, ApJ, 513, L1
- (11) Egami, E., Neugebauer, G., Soifer, B. T., et al. 2000, ApJ, 535, 561
- (12) Evans, A. S., Frayer, D. T., Surace, J. A., & Sanders, D. B. 2001, AJ, 121, 1893
- (13) Fan, X., Narayanan, V. K., Lupton, R. H., et al. 2001, AJ, 122, 2833
- (14) Fixsen, D. J., Bennett, C. L., & Mather, J. C. 1999, ApJ, 526, 207
- (15) Flower, D. R., & Pineau des Forets, G. 2001, MNRAS, 323, 672
- (16) Gao, Y., & Solomon, P. M. 2004, ApJ, 606, 271
- (17) Greve, T. R., Ivison, R. J., & Papadopoulos, P. P. 2004, A&A, 419, 99
- (18) Guilloteau, S., Omont, A., Cox, P., et al. 1999, A&A 349, 363
- (19) Hu, E. M., McMahon, R. G., & Egami, E. 1996, ApJ, 459, L53
- (20) Hu, E. M., Cowie, L. L., McMahon, R. G., et al. 2002, ApJ, 568, L75
- (21) Ibata, R. A., Lewis, G. F., Irwin, M. J., et al. 1999, AJ, 118, 1922
- (22) Kennicutt, R. C. 1998a, ApJ, 498, 541
- (23) Kennicutt, R. C. 1998b, ARA&A, 36, 189
- (24) Kodaira, K., Taniguchi, Y., Kashikawa, N., et al. 2003, PASJ 55, L17
- (25) Klamer, I. J., Ekers, R. D., Sadler, E. M., & Hunstead, R. W. 2004, ApJ, 612, L97
- (26) Klamer, I. J., Ekers, R. D., Sadler, E. M., et al. 2005, ApJ, 621, L1
- (27) Ledoux, C., Theodore, B., Petitjean, P., et al. 1998, A&A, 339, L77
- (28) Lewis, G. F., Chapman, S. C., Ibata, R. A., et al. 1998, ApJ, 505, L1
- (29) Lewis, G. F., Carilli, C., Papadopoulos, P., & Ivison, R. J. 2002, MNRAS, 330, L15
- (30) Mooney, T. J., & Solomon, P. M. 1988, ApJ, 334, L51
- (31) Ohta, K., Yamada, T., Nakanishi, K., et al. 1996, Nature, 382, 426
- (32) Omont, A., Petitjean, P., Guilloteau, S., et al. 1996, Nature, 382, 428
- (33) Omont, A., Cox, P., Bertoldi, F., et al. 2001, A&A, 374, 371
- (34) Ott, M., Witzel, A., Quirrenbach, A., et al. 1994, A&A, 284, 331
- (35) Papadopoulos, P., Ivison, R., Carilli, C. L., & Lewis, G. 2001, Nature, 409, 58
- (36) Pety, J., Beelen, A., Cox, P., et al. 2004, A&A, 428, L21
- (37) Rhoads, J. E., & Malhotra, S. 2001, ApJ, 563, L5
- (38) Rowan-Robinson, M. 2000, MNRAS, 316, 885
- (39) Sandage, A. 1994, ApJ, 430, 1
- (40) Sanders, D. B., Scoville, N. Z., & Soifer, B. T. 1991, ApJ, 370, 158
- (41) Scoville, N. Z., Frayer, D. T., Schinnerer, E., & Christopher, M. 2003, ApJ, 585, L105
- (42) Solomon, P. M., Radford, S. J. E., & Downes, D. 1992, Nature, 356, 318
- (43) Solomon, P. M., Downes, D., Radford, S. J. E., & Barrett, J. W. 1997, ApJ, 478, 144
- (44) Solomon, P. M., Vanden Bout, P. A., Carilli, C. L., & Guelin, M. 2003, Nature 426, 636
- (45) Solomon, P. M., & Vanden Bout, P. A. 2005, ARA&A, 43, 677
- (46) Spergel, D. N., Verde, L., Peiris, H. V., et al. 2003, ApJS, 148, 175
- (47) Taniguchi, Y., Ajiki, M., Nagao, T., et al. 2005, PASJ, 57, 165
- (48) Vanden Bout, P. A., Solomon, P. M., & Maddalena, R. J. 2004, ApJ, 614, L97
- (49) Walter, F., Bertoldi, F., Carilli, C. L., et al. 2003, Nature, 424, 406
- (50) Walter, F., Carilli, C., Bertoldi, F., et al. 2004, ApJ, 615, L17
- (51) Weiss, A., Neininger, N., Hüttemeister, S., & Klein, U. 2001, A&A, 365, 271
- (52) Weiss, A., Henkel, C., Downes, D., & Walter, F. 2003, A&A, 409, L41
- (53) Weiss, A., Walter, F., & Scoville, N. Z. 2005, A&A, 438, 533
- (54) Yun, M. S., Carilli, C. L., Kawabe, R., et al. 2000, ApJ, 528, 171
- (55) Yun, M. S., Reddy, N. A., Scoville, N. Z., et al. 2004, ApJ, 601, 723

| Source | aaA (K)/(Jy) conversion factor of 1.5 was assumed for the GBT. | Telescope | ||||
|---|---|---|---|---|---|---|
| [GHz] | [mJy] | [ km s-1] | [Jy km s-1] | |||
| BR 1202-0725 | 4.6932 0.0004 | 20.2450 | 0.36 0.03 | 329 36 | 0.124 0.012 | GBT |
| 4.6956 0.0012 | 20.2388 | 0.40 0.11 | 522 146 | 0.22 0.06 | Effelsberg | |
| 4.6949 0.0003 | 20.2411 | 0.34 0.03 | 333 30 | 0.120 0.010 | (combined) | |
| PSS J2322+1944 | 4.1173 0.0003 | 22.5258 | 0.77 0.07 | 202 17 | 0.165 0.014 | GBT |
| 4.1184 0.0008 | 22.5211 | 1.29 0.26 | 184 46 | 0.25 0.06 | Effelsberg | |
| 4.1179 0.0002 | 22.5231 | 0.77 0.07 | 190 14 | 0.155 0.013 | (combined) | |
| APM 08279+5255 | 3.9122 0.0007 | 23.4663 | 0.26 0.04 | 556 55 | 0.152 0.020 | GBT |
Note. — All given uncertainties are formal (correlated) errors from the Gaussian fit. The error was derived from a full 3 parameter fit. In the error estimates for and , the correlation with the error in is neglected, as the relative uncertainty in is by 3 orders of magnitudes less as that of the other two quantities. The error estimate for takes the correlation of the errors of and into account.
| Source | aaApparent luminosities (not corrected for lensing)/intrinsic luminosities (lensing–corrected). | aaApparent luminosities (not corrected for lensing)/intrinsic luminosities (lensing–corrected). | / | bbAssuming a conversion factor of M/K km s-1pc2 from to as appropriate for ULIRGs (see Downes & Solomon 1998). | ccAssuming a Schmidt–Kennicutt law (Kennicutt 1998a,b): [M⊙ yr-1][L⊙], i.e., following the notation of Omont et al. (2001): describes the dependence on the mass function of the stellar population, gives the fraction of that is actually powered by the starburst and not the AGN. | ||
|---|---|---|---|---|---|---|---|
| [Gpc] | [10L⊙] | [10K km s-1pc2] | [L⊙/K km s-1pc2] | [1010 M⊙] | [103 M⊙ yr-1] | ||
| BR 1202-0725 | 44.2 | 1ddCarilli et al. (2002b); | 60ggCarilli et al. (2005);/60 | 10.1/10.1 | 596 | 8.1 | 9.0 |
| PSS J2322+1944 | 37.8 | 2.5eeCarilli et al. (2003); | 23hhCox et al. (2002);/9.2 | 10.5/4.2 | 219 | 3.4 | 1.4 |
| APM 08279+5255 | 35.6 | 7ffLewis et al. (2002); | 200iiBeelen et al. (2006)./28.6 | 9.6/1.4 | 2090 | 1.1 | 4.3 |
| Source | Transition | ref. | |||||
|---|---|---|---|---|---|---|---|
| [mJy] | [Jy km s-1] | [ km s-1] | |||||
| BR 1202-0725 | N | 4.692 | 2–1 | 0.44 0.07 | 0.26 0.05 | 1 | |
| S | 4.695 | 2–1 | 0.77 0.10 | 0.23 0.04 | 1 | ||
| NS | 4–3 | 5.1 | 1.50 0.3 | 280 30 | 2 | ||
| N | 4.6916 | 5–4 | 3.5 | 1.3 0.2 | 350 | 2 | |
| S | 4.6947 | 5–4 | 5.5 | 1.1 0.3 | 190 | 2 | |
| NS | 4.695 | 5–4 | 9.3 2.1 | 2.7 0.41 | 220 74 | 3 | |
| NS | 4.6915 | 7–6 | 10.6 | 3.1 0.86 | 275 | 2 | |
| PSS J2322+1944 | 4.1192 | 1–0 | 0.89 0.22 | 0.19 0.08 | 200 70 | 4 | |
| 4.1192 | 2–1 | 2.70 0.24 | 0.92 0.30 | 280 42 | 4,5 | ||
| 4.1199 | 4–3 | 10.5 | 4.21 0.40 | 375 41 | 6 | ||
| 4.1199 | 5–4 | 12 | 3.74 0.56 | 273 50 | 6 | ||
| 6–5 | 7 | ||||||
| 7–6 | 7 | ||||||
| APM 08279+5255 | 3.9 | 1–0 | 0.150 0.045aaDerived for central only.; 0.22 0.05 | 575 | 8,9,10 | ||
| 3.9 | 2–1 | 0.81bbAssuming a velocity–averaged brightness temperature ratio between 12CO(=21) and 12CO(=10) of 1.35 0.55 (Papadopoulos et al. 2001). | 8 | ||||
| 3.9114 | 4–3 | 7.4 1.0 | 3.7 0.5 | 480 35 | 11 | ||
| 6–5 | 7 | ||||||
| 3.9109 | 9–8 | 17.9 1.4 | 9.1 0.8 | 11 | |||
| 10–9 | 7 | ||||||
| 11–10 | 7 |
References. — [1] Carilli et al. (2002b); [2] Omont et al. (1996); [3] Ohta et al. (1996); [4] Carilli et al. (2002a); [5] Carilli et al. (2003); [6] Cox et al. (2002); [7] Weiss et al. (2006), in prep.; [8] Papadopoulos et al. (2001); [9] Lewis et al. (2002); [10] Riechers et al. (2006), in prep.; [11] Downes et al. (1999)
Note. — For BR 1202-0725, N and S indicate the northern and southern component, NS indicates an integrated measurement over both components.