Chandra Observations of Red Sloan Digital Sky Survey Quasars
Abstract
We present short Chandra observations of twelve bright () quasars from the Sloan Digital Sky Survey chosen to have significantly redder optical colors than most quasars at the same redshift. Of the five quasars with optical properties most consistent with dust reddening at the quasar redshift, four show indirect evidence of moderate X-ray absorption (inferred 1022 cm-2) with a dust-to-gas ratio 1% of the SMC value. The remaining seven objects show no evidence for even moderate intrinsic X-ray absorption. Thus, while optically red quasars are marginally more likely to show signatures of X-ray absorption than optically selected quasars with normal colors, dust-reddened type 1 AGN (as opposed to fully obscured type 2 AGN) are unlikely to contribute significantly to the remaining unresolved hard X-ray background. The red quasar population includes objects with intrinsically red continua as well as objects with dust-reddened continua. Improved sample selection is thus needed to increase our understanding of either subpopulation. To identify dust-reddened quasars likely to exhibit X-ray absorption, some measure of spectral curvature is preferable to simple cuts in observed or relative broad-band colors.
1 Introduction
It has long been suspected that optical surveys for active galactic nuclei are significantly incomplete due to orientation-dependent (and perhaps evolution-dependent) dust obscuration (Antonucci 1993). This suspicion has been confirmed by recent X-ray and infrared investigations that find higher densities of active galactic nuclei (AGN) than do optical surveys to comparable flux limits (e.g., Ueda et al. 2003; Bauer et al. 2004; Stern et al. 2005). The exact fraction of quasars missed by optical surveys is not yet clear, as the missing objects appear to be mostly lower-luminosity AGN (e.g., Ueda et al. 2003; Hao et al. 2005). Nonetheless, it is clear that a full understanding of quasars and their contribution to the X-ray background requires proper consideration of optically obscured quasars.
Indeed, one of the most active topics in X-ray astronomy today is the origin of the hard X-ray background. With the sensitivity of Chandra and XMM-Newton, 90% of the X-ray background can be resolved into point sources at 6 keV, but only 60% at 6–8 keV (e.g., Alexander et al. 2001; Worsley et al. 2005). The spectral shape of the keV X-ray background (Marshall et al. 1980) clearly indicates that a significant fraction of the very hard X-ray background comprises absorbed sources. The demographics of this absorbed population are uncertain at present, and it is unclear how many are bona-fide type 2 AGN with fully obscured broad emission-line and optical continuum regions as opposed to X-ray-absorbed and optically dust-reddened but otherwise normal type 1 (broad line) AGN extincted beyond the flux limits of optical surveys.
Characterizing this population requires not only statistical arguments demonstrating the existence of obscured quasars, but also focused investigations targeting the properties of individual objects that exhibit evidence of obscuration. Some recent studies have claimed that quasars with red near-IR colors () from the Two-Micron All-Sky Survey (2MASS) represent a population of previously undiscovered quasars that could partially account for much of the “missing” hard X-ray background sources (Cutri et al. 2002; Wilkes et al. 2002, 2005). In this paper we take a complementary approach and investigate the nature of quasars that have relative UV/optical colors that are redder than average (at a given redshift). This selection has the benefit of being less sensitive to color differences due to emission lines moving in and out of the bands and of exhibiting larger differences due to extinction, since the effects of extinction are strongest at UV wavelengths. We use Chandra observations of these quasars to look for additional signs of extinction, such as a harder X-ray spectrum and lower than expected X-ray flux.
We present the construction of our sample in § 2, our X-ray observations and data analysis in § 3, the results of our observations in § 4, a discussion of our results in § 5, and our conclusions in § 6. We adopt km s-1 Mpc-1, , and (e.g., Spergel et al. 2006).
2 Sample Selection
2.1 Why Use Relative Optical Colors?
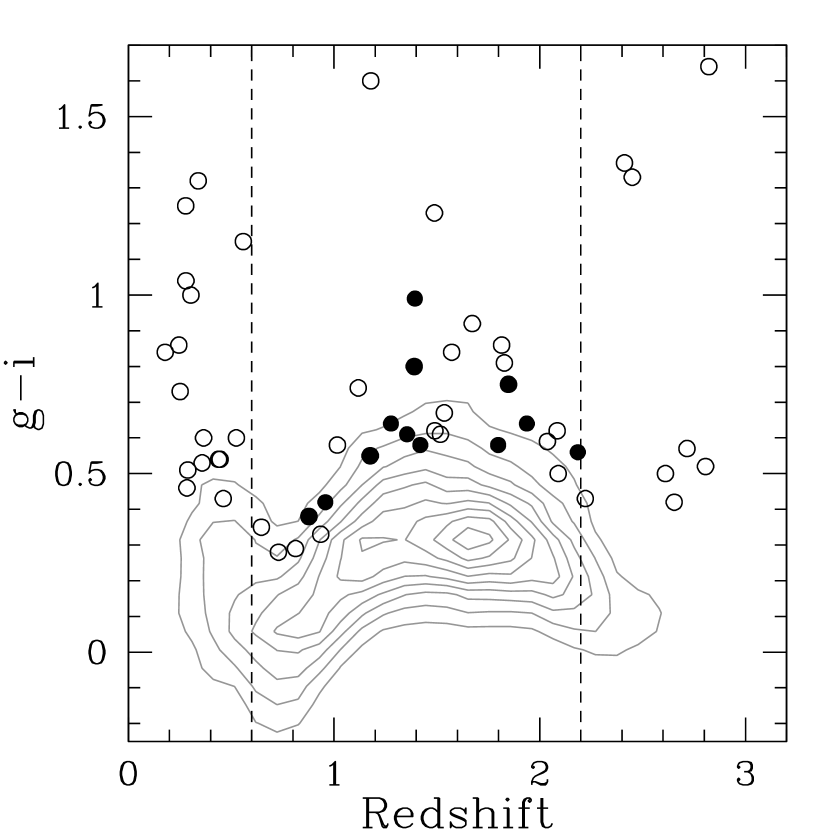
One of the primary problems with color-selecting a sample of “red” quasars for further study is that quasar colors are a strong function of redshift. Large-area digital surveys such as the Sloan Digital Sky Survey (SDSS; York et al. 2000) are now enabling astronomers to characterize the quasar color distribution as a function of redshift (Richards et al. 2001) and are, in fact, resolving their color distribution (Richards et al. 2003). While a fixed observed-frame color cut such as does select quasars that are apparently red, as discussed by Richards et al. (2003) this approach fails to distinguish whether the quasar is intrinsically red (i.e., has a red [optically steep] power-law spectrum), has been reddened by dust extinction, or appears red because of strong emission or absorption in one of the bands or long-wavelength host galaxy contamination. For quasars of known redshift, it is possible to use SDSS colors alone to account for the redshift dependence of quasar colors and, for sufficiently large reddening, to distinguish between a steeper power-law continuum and the curvature of a dust-reddened continuum.
Thus, to define a more redshift-independent red quasar sample, we take advantage of the well-defined structure in the color-redshift relation (see Fig. 1). For each of our quasars we can compute a relative color by subtracting the median color of quasars at that redshift (Richards et al. 2001). Relative colors are thus more nearly equally sensitive to reddened quasars at all redshifts and can be used to classify quasars as a function of color alone. For example, a quasar that has a relative color of 0.2 () is redder than the average quasar by 0.2 magnitudes in observed regardless of its redshift.
Such selection should yield a more homogeneous red AGN sample than a fixed observed-frame color cut such as (Cutri et al. 2002). The relative color probes the shape of the UV/optical continuum due to the accretion disk at most redshifts studied by the SDSS, whereas a selected sample measures the shape of the near-IR bump for and the ratio of the near-IR to optical flux densities for . Furthermore, although a color cut does include dusty quasars, it also selects only slightly redder than average quasars with (see Fig. 5 of Barkhouse & Hall 2001 and § 6.2 of Maddox & Hewett 2006).
Near-IR selection of AGN is superior to optical selection when one is trying to avoid incompleteness caused by dust extincting objects below the survey flux limit. Yet, specifically because the UV/optical colors suffer more extinction, UV/optical colors are better able to distinguish between dust-reddened quasars and unreddened quasars with steeper than average continua. Our SDSS-based sample has one additional advantage in that the flux limit for the optically selected red quasars was determined in the -band instead of the -band, resulting in less of a bias against dust-reddened quasars (as compared to most other optical surveys). Thus an investigation of red quasars using relative optical colors of SDSS quasars provides a happy medium for exploring the red quasar population: it has the benefits of relatively long wavelength selection, but covers wavelengths considerably affected by dust reddening.
2.2 Selection Details
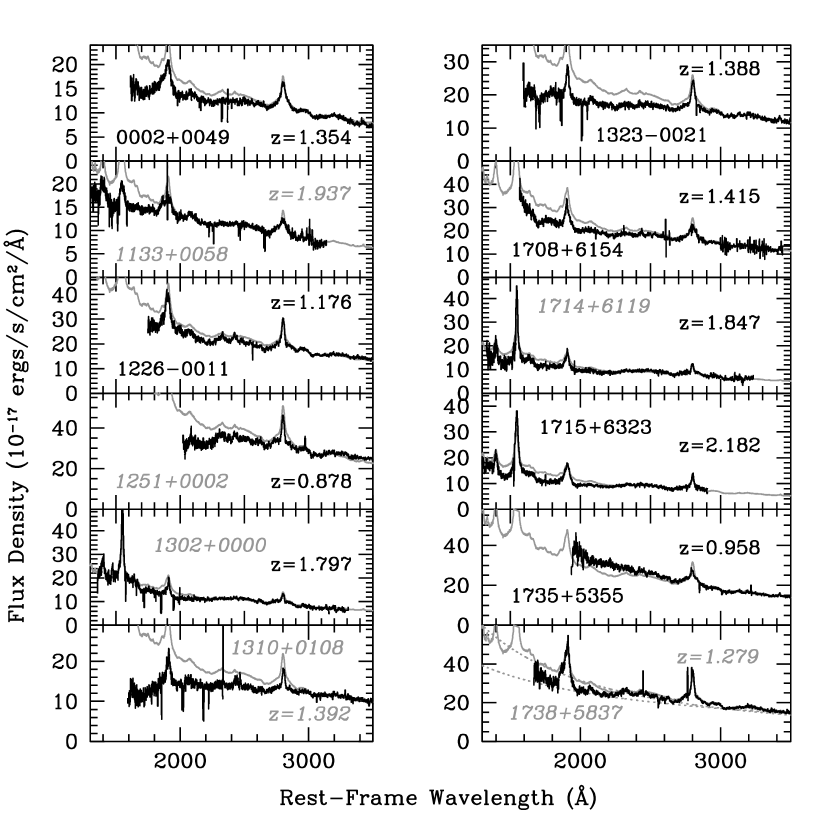
Our initial sample was selected from the 3814 Early Data Release (EDR) quasars (Schneider et al. 2002), giving priority to bright objects (dereddened ) with small Galactic . We considered only spatially unresolved quasars with and ; see Figure 1. The color cut selects the reddest 11.5% of non-BAL, quasars at each redshift, and the redshift selection avoids host galaxy contamination and reduces the effect of absorption from the Ly forest. Avoiding resolved sources also reduces the chances that the red colors are due to host galaxy contamination. The sample was vetted to exclude quasars with broad absorption line (BAL) troughs (Reichard et al. 2003b) which are known to cause both optical reddening and X-ray absorption. (e.g., Gallagher et al. 2006). This was not possible for the eight quasars where C IV 1549, the transition that most often exhibits a BAL trough, is not in the SDSS spectroscopic bandpass. Based on a raw high-ionization SDSS BAL fraction of 9.85% (Trump et al. 2006), we estimate there is a 38% chance that exactly one of these eight quasars is a high-ionization BAL quasar, a 15% chance that exactly two are, and a 3% chance that three or more are. We also excluded quasars detected in the 20 cm FIRST survey (Becker, White, & Helfand 1995), since radio-powerful quasars have different X-ray properties (e.g., Shastri et al. 1993). Table 1 lists the 12 targets for which we obtained X-ray data. Figure 2 shows their SDSS spectra.
An obvious question to ask is whether our selection criterion recovers quasars selected by (and vice versa). In Figure 3 we show the relative color versus the relative color for SDSS-DR3 quasars also detected by 2MASS (Schneider et al. 2005). Objects consistent with being dust reddened form a tail with red colors but undistinguished colors. In terms of observed color we find that while our criterion does indeed recover some quasars with , only 1/3 of EDR quasars with also have . Since the tail of red colors comes predominantly from dust reddening (Hopkins et al. 2004), selection must miss some dust-reddened quasars and include some that are not dust reddened. For example, none of our twelve targets have .111For four of our targets without 2MASS or detections, we performed aperture photometry on calibrated 2MASS Atlas images. We discuss selection further in § 5.1.
Note that our selection criteria were designed to select quasars that suffer from extinction (and reddening) by dust grains, not ones that simply have intrinsically redder than average power-law continua. Unfortunately, the range of power-law slopes in quasars is such that it is not possible to do this with complete certainty. However, any unreddened but intrinsically red quasars that ‘contaminate’ our sample are still of interest, since the relationship between the X-ray properties of quasars and their optical/UV colors is not well characterized.
2.3 Damped Ly Absorbers
In our selection of targets, we did not reject objects with strong intervening absorption lines in their optical spectra. At first glance not rejecting such systems seems reasonable given the amount of reddening expected from a typical intervening absorption system. As shown by Richards et al. (2003) and Hopkins et al. (2004), in a statistical sense the reddening observed in SDSS quasars is dominated by SMC-like dust at the quasar redshifts. However, quasars with intervening absorption lines are three times as likely to have highly reddened spectra as quasars without them (York et al. 2006). And since SMC-like dust has a nearly featureless, nearly power-law exinction curve, it is not always possible for a specific quasar to determine whether the dust is intrinsic to the quasar or along the line of sight.
We can estimate the amount of optical reddening that is expected under the hypothesis that the galaxies causing absorption lines in some of our quasars are the source of reddening. Following Rao & Turnshek (2000, Fig. 25), if the rest-frame equivalent widths are Å and Å, there is a chance the Mg II system comes from a DLA with cm-2, which gives using the SMC extinction law. Quasars with such candidate DLAs are noted in Table 1. The two which also show Ca II absorption lines, J1310+0108 and J13230021, will be specially marked as they are the most likely to be affected by intervening extinction (Wild & Hewett 2005).
Note that for the maximum found for any DLA along a quasar sightline to date, cm-2, the SMC extinction would be only . However, given recent work demonstrating that intervening absorbers sometimes can redden quasars (Khare et al. 2005), it may be that these particular systems have LMC or MW extinction laws which would require a multiplication of by factors of 2 or 9, respectively. If that is the case, then the redness of such objects may not be intrinsic and they cannot be used to address the issue of the X-ray properties of intrinsically red or reddened quasars. We consider this issue further in § 4.2.
3 X-ray Observations and Data Analysis
Chandra observed our 12 red quasar targets between 2003 November 09 and 2004 September 29 (see Table 2). Each target was observed at the aimpoint of the back-illuminated S3 CCD of the Advanced CCD Imaging Spectrometer (ACIS; Garmire et al. 2003) in faint mode.
In general, data analysis followed the procedure detailed in Gallagher et al. (2005), which we outline briefly. Both aperture photometry and the CIAO version 3.2 (see http://cxc.harvard.edu/ciao) wavelet detection tool wavdetect (Freeman et al. 2002) were used in the soft (0.5–2 keV), hard (2–8 keV), and full (0.5–8 keV) bands to determine the measured counts for a point source in each band. Except for J11330058, the quasars were each significantly detected with full-band counts ranging from 7 to 237; the difference in counts between wavdetect and aperture photometry was always counts. The background was in all cases negligible (1 count in the source region). At the median flux of our sample the source density is 8 arcsec-2 (e.g., Bauer et al. 2004), so the chance of a misidentification is extremely small.
For each target, to provide a coarse quantitative measure of the spectral shape we calculated the hardness ratio HR=, where and refer to the hard- and soft-band counts, respectively. A typical, radio-quiet quasar has a power-law continuum in the 0.5–10.0 keV band characterized by the photon index, , and the 1 keV normalization, : photon cm-2 s-1 keV-1. From X-ray spectroscopic studies, is found to average for radio-quiet quasars (e.g., George et al. 2000; Reeves & Turner 2000); such an average quasar would be observed to have HR .
To transform the observed HR into , the X-ray spectral modeling tool XSPEC (Arnaud 1996) was used. The detector response to incident power-law spectra with varying was simulated. The hardness ratio and errors were compared to the modeled HR to determine the that would generate the observed HR. The uncertainties on reflect the statistical uncertainties in the HR. The modeled full-band count rate was normalized to the observed full-band count rate to obtain the power-law normalization, . Using and , the 0.5–8.0 keV flux, , and the flux density at rest-frame 2 keV, , were calculated. The errors quoted for these two values are the Poisson errors (Gehrels 1986) from the full-band counts.
Lastly, we calculated the optical/UV to X-ray index = and its uncertainty. The quantity is the average flux density within the rest-frame range Å in the SDSS spectrum, scaled to account for flux outside the spectroscopic fiber aperture. We took the scale factor to be the flux ratio between the object’s photometric PSF magnitude and its fiber magnitude as synthesized from the spectrum, with both magnitudes measured in the filter into which rest-frame 2500 Å is redshifted. As detailed in §2.2 of Gallagher et al. 2005, the quoted errors in incorporate both the Poisson uncertainty in and the estimated effects of UV variability between the SDSS and Chandra observations (Ivezić et al. 2004), which are on average 500 days apart in the quasar rest frame. We also calculated ; a quasar’s is its relative to the expected for a quasar of its luminosity (Strateva et al. 2005, Eq. 6; see also Steffen et al. 2006). These quantities are presented in Table 3.
3.1 X-ray Spectral Fitting
For those six quasars with full-band counts, we also performed X-ray spectral fitting. The spectra were extracted using 25-radius source cells. Our spectral model was a simple absorbed power-law continuum with both Galactic and intrinsic absorption by neutral gas with solar abundances at the quasar redshift; the photon statistics do not warrant a more complex model. In this low-count regime, the spectra are not binned and the fit is performed with XSPEC by minimizing the -statistic (Cash 1979). The best-fitting and intrinsic for the six quasars with counts are listed in Table 4. Since these quasars have the highest X-ray fluxes in our sample, they are by definition unlikely to be absorbed in the X-ray; indeed, for only one of them is there a significant detection of absorption. This object, J13230021, exhibits the most metal-rich intervening absorption system currently known (§4.2.7).
4 Results
4.1 Correlations Between X-ray and Optical Properties
We begin our X-ray analysis by searching for evidence of X-ray absorption that may occur in conjunction with optical dust extinction and reddening. The signatures of absorption in snapshot X-ray observations are flatter than average X-ray photon indices (i.e., ), since absorption preferentially removes softer X-rays, and unusual values of the optical to X-ray flux ratio, , or the luminosity-corrected optical to X-ray flux ratio, .
We first examine the relationship between and , which is shown in Figure 4. Richards et al. (2003) showed that most quasars have between and and that there exists a tail of redder quasars consistent with being dust reddened. The typical range of is found to be for radio-quiet quasars (e.g., George et al. 2000; Reeves & Turner 2000). Dust causes quasars to appear redder in the optical, while gas absorbs soft X-ray photons. For any observed dust reddening, the accompanying X-ray absorption will be greater (and thus the lower) if the dust-to-gas ratio is smaller. Quasars in the lower right hand corner of panel (a) in Figure 4 are potentially obscured quasars.
In panel (b) of Figure 4 we show vs. the ultraviolet spectral slope, (). measures the quasar’s underlying continuum slope at fixed rest-frame wavelengths that are relatively devoid of emission line flux and is thus a more precise measurement of the continuum color than . Our new data appear to reaffirm the correlation between and found by Gallagher et al. (2005). Combining both datasets, the chance of no correlation is only 0.03% using Kendall’s test. Even considering only quasars with , the chance of no correlation is still only 0.95%. In the plot we show the BCES(YX) (Akritas & Bershady 1996) linear fit to the full combined datasets, . More work, however, is needed to disentangle a correlation between and intrinsic UV spectral slope from a correlation induced by the effects of dusty gas on both parameters. That is, an intrinsically red quasar might have an intrinsically hard X-ray spectrum, whereas a dust-reddened quasar might have an intrinsically soft X-ray spectrum that appears hard due to X-ray absorption.
We next search for for any trends between color and as shown in Figure 5. In panel (a) the lines show the expected relationship between and for neutral gas with three different SMC-like dust-to-gas ratios. For an SMC dust-to-gas ratio, even minimal X-ray absorption can be accompanied by heavy extinction of optical light by dust, and the ratio of emergent X-ray to optical fluxes (in other words, ) increases. But as the dust-to-gas ratio decreases, X-ray wavelengths become increasingly affected relative to the optical. The open points are roughly consistent with a typical SMC reddening as shown by the solid line. The filled points, however, may require a different explanation. Both panels of Figure 5 show that there is intrinsic scatter in which is independent of a quasar’s optical/UV color, but that quasars with relatively red colors may be more likely to be X-ray faint than are quasars with relatively blue colors.222The converse, that relatively X-ray faint quasars are more likely to be abnormally red, is also probably true. When is used as a measure of optical color to split the full plotted sample in half at =0.75, an invariant Kolmogorov-Smirnov (Kuiper) test shows that the distributions for the two halves are different at the 89.2% significance level. However, when the sample is split in half at =0.26, there is only a 55.8% chance the distributions are different.
To test whether the extrema in these figures are consistent with absorption in the X-ray, in Figure 6 we show vs. overlaid on curves that demonstrate the effects of X-ray absorption on a quasar of intrinsic =2 and =0. The heavy curves are for gas with various dust-to-gas ratios at a fixed , while the dotted curves are for completely dust-free neutral gas at the redshifts shown. Dust-free gas absorbs soft X-rays, but does not affect the optical spectrum until the absorption becomes Compton-thick. Thus, the effect of such gas in Figure 6 is to decrease both and . The three points closest to the lower left-hand corner appear consistent with the absorption hypothesis and inconsistent with being due to intrinsic scatter in and . Furthermore, the distribution of points in the diagram is not consistent with random scatter around =2 and =0, but is consistent with quasars with intrinsic =2 and =0 being affected by absorption of varying dust-to-gas ratios, as indicated by the various tracks, HR=2 and =0. However, with the typical measurement accuracy and probable intrinsic scatter of and , this Figure by itself can only be used to unambiguously identify moderately reddened quasars if they have low dust-to-gas ratios. Moderate reddening with a high dust-to-gas ratio can produce a marked effect on a quasar’s optical spectrum without substantially affecting its X-ray properties; a quasar’s optical/UV spectrum is an invaluable source of information on the reddening of such quasars. (See § 4.2 and § 5 for specific examples.)
4.2 Notes on Individual Quasars
Before we can explore the X-ray properties of dust-reddened quasars as a population, we must examine the diagnostic information in Figures 2, 4, and 5 to determine which objects in our sample are most likely to be reddened by dust versus intrinsically red. Both of these groups could suffer from X-ray absorption, which does not always occur in conjunction with dust extinction (e.g. Brandt, Laor, & Wills 2000). The shape of the optical/UV continuum, the relationship between the relative colors, and the X-ray properties affect this determination. We now examine these parameters for each of our objects.
4.2.1 J0002+0049; , , , ,
The optical spectrum shows moderate reddening, for which the intervening absorption system is likely too weak to be responsible. This quasar has the softest X-ray spectrum in the sample and is positive, thus there is no sign of X-ray absorption; the results from spectral-fitting are consistent with this conclusion. These properties might lead us to believe that this quasar is intrinsically red. However, there is evidence for curvature in the optical spectral energy distribution (SED) from the SDSS photometry. Specifically is larger than , which is larger than , as expected for a dust-reddened object. (For an object with a power-law continuum and unexceptional emission-line properties , , and would be equal within the uncertainties.) Thus we conclude that the object is reddened by SMC dust with a normal dust-to-gas ratio; this leads to noticable curvature of the optical spectrum but negligibly effects the X-ray spectrum.
4.2.2 J1133+0058; , , , unknown,
The optical spectrum is consistent with mild dust reddening rather than a flatter than typical power-law slope. Dust reddening is also indicated by the fact that . There is a strong intervening absorption system (a probable DLA) at . This quasar was undetected in our Chandra observation and must thus be very heavily absorbed in the X-ray (equivalent cm-2 at ). A DLA could provide such a column if it was dominated by H2 (Schaye 2001) but nonetheless had a low dust-to-gas ratio, which is rather contrived, or if had a metallicity 10 times solar, which is rather unlikely. We conclude that this quasar experiences some intrinsic X-ray absorption and some from the intervening system, and similarly for its dust reddening. (There is moderately strong narrow C IV absorption 7000 km s-1 from the quasar redshift, which could be a tracer of high-ionization gas intrinsic to the quasar.) We discuss this issue further in §4.2.6 and §4.2.7. In any case, the combination of moderate dust reddening and strong X-ray absorption means that the overall dust-to-gas ratio along the line of sight to this quasar is rather small.
4.2.3 J12260011; , , , ,
The optical spectrum is only mildly red, but dust extinction might be present since . There is no indication of X-ray absorption. This quasar could be either intrinsically red or mildly dust reddened.
4.2.4 J1251+0002; , , , ,
The spectrum of this quasar has little rest-frame UV coverage, but the evidence of moderate curvature in the spectrum and photometry [ ] are consistent with dust reddening. The values of and imply significant X-ray absorption. We conclude that this quasar is dust-reddened with X-ray absorption.
4.2.5 J1302+0000; , , , ,
The optical spectrum is normal. While there is intervening absorption, there is no indication of spectral curvature from reddening. The values of and are consistent with moderate X-ray absorption, but are only from the typical values seen in quasars without X-ray absorption. We argue that the redness of this object is most likely intrinsic and not due to dust.
4.2.6 J1310+0108; , , , ,
The optical spectrum of this quasar is heavily reddened. There is strong intervening absorption (a probable DLA) at and Ca II absorption, and according to (Wild & Hewett (2005) the quasar is reddened by assuming an LMC extinction curve. However, this quasar is significantly absorbed in the X-ray, consistent with an equivalent solar-metallicity absorbing column of cm-2. This is the same situation as for J1133+0058, and we reach the same conclusion: this quasar has both intrinsic and intervening X-ray absorption, and similarly for its dust reddening. Unfortunately, the quasar is at too low a redshift to look for intrinsic C IV absorption as a possible tracer of high-ionization gas. We discuss this issue further in §4.2.7.
4.2.7 J13230021; , , , ,
The optical spectrum of this quasar is heavily reddened, has strong intervening absorption estimated to be of DLA strength (see §2.3), and has Ca II absorption that could be accompanied by optical reddening. (This intervening system is at too low a redshift to be in the (Wild & Hewett (2005) sample.) This quasar has unremarkable and values, but X-ray spectral-fitting yields and a significant detection of absorption. If the X-ray absorption is set to the DLA redshift of , then cm-2 (68% confidence for 2 parameters of interest); an intrinsic absorber requires more than double that column density (see Table 4).
Our absorption detection is consistent with the result of Peroux et al. (2006) that this is the most metal-rich intervening quasar absorption system known, with [Zn/H]=+0.610.20 (metallicity times solar). However, even after adjusting our best-fit solar-metallicity X-ray column downward by a factor of four, the resulting measured in the X-ray is still a factor of larger than this system’s neutral = cm-2 measured in the UV (Khare et al. 2004).
We conclude that an intervening absorption system causes the optical reddening toward this quasar and some of the X-ray absorption toward it, but not all: we infer that there is also high-ionization, X-ray-absorbing gas intrinsic to this quasar. In fact, the spectrum of this quasar shows two strong, narrow C IV absorption systems very near the quasar redshift (Khare et al. 2004), at least one of which is accompanied by strong, narrow N V absorption in an HST spectrum (GO project 9382; PI: S. Rao).
It is somewhat suspicious to postulate that there are three quasars in our sample which have both dust reddening and strong intervening absorption systems but which also require intrinsic X-ray absorption at the quasar redshift (this quasar, J1133+0058 and J1310+0108), even if there is possible evidence for intrinsic high-ionization gas in the first two cases. Nonetheless, this conclusion appears more likely than the alternative that the intervening absorbers are as strong as any ever seen along quasar sightlines and have metallicities 10 times solar. This is especially true for J13230021, where we know the absorber’s metallicity and and there is still a factor of 10 discrepancy with the X-ray column. Moreover, given that dusty intrinsic and intervening absorption systems do exist, both types of systems will be overrepresented in our red quasar sample, and rare systems where both effects are at work will be even more overrepresented. In any case, our conclusion can be tested with better X-ray data to constrain the X-ray absorbing columns (and to ensure that the measured X-ray columns are not systematically high) and with high-resolution UV spectroscopy to constrain the and metallicities of the three intervening absorption systems.
4.2.8 J1708+6154; , , , ,
This quasar’s optical spectrum is moderately red. It has . The X-ray properties are within the normal range in and . All the above evidence is consistent with this quasar being either intrinsically red or only mildly dust-reddened.
4.2.9 J1714+6119; , , , ,
In this quasar, the optical spectrum is mildly red. The X-ray spectrum is fairly hard, but within the normal range. Given that both the C IV and He II emission lines in this quasar are strong and narrow, and that it has red colors in and but a blue color in (due to strong Ly emission?), this object would appear to be intrinsically red rather than dust-reddened. (Richards et al. (2003) presented evidence that quasars with high equivalent width emission lines tend to be redder.)
4.2.10 J1715+6323; , , , ,
The optical spectrum shows mild reddening. The object has red and but blue . There is no strong evidence for X-ray absorption from spectral fitting. This object is most likely to be intrinsically red.
4.2.11 J1735+5355; , , , ,
In this quasar, which has the bluest value in our sample, the optical spectrum is normal or somewhat blue (note the quasar’s much bluer position in Figure 4b relative to the rest of our sample). The Fe II emission lines are very weak; this might be affecting the color. This quasar would appear to be neither dust reddened or intrinsically red, but it does have an abnormal relative color which has caused it to ‘contaminate’ our sample.
4.2.12 J1738+5837; , , , ,
Our final quasar has an optical spectrum that is mildly reddened. It also has , consistent with dust reddening. The and values indicate significantly X-ray absorption. Thus we conclude that this object is dust-reddened as well as X-ray absorbed.
4.2.13 Summary of Notes on Individual Quasars
The quasars in our relatively red quasar sample appear to have a variety of dominant causes for their red colors:
Misclassified as red: 1 (§4.2.11)
5 Discussion
The data presented here show that quasars selected to have the reddest optical colors at a given redshift are not necessarily X-ray absorbed. However, the greater range of optical/UV to X-ray flux ratios and X-ray hardness ratios in quasars that appear optically red shows that they have a (marginally significant) tendency to be X-ray absorbed more often than optically blue quasars. Unfortunately, it does not appear straightforward to accurately predict which red quasars will be absorbed in the X-ray using the optical/UV colors alone.
In our small sample of twelve relatively red quasars, five show some evidence for intrinsic X-ray absorption based on the combination of both more negative values and lower values (when we can constrain ) than normal quasars. It is plausible that at least two effects are at work: 1) Intrinsically red quasars have intrinsically harder X-ray spectra but normal values (Gallagher et al. 2005); 2) Dust-reddened quasars have X-ray spectra hardened (though not necessarily significantly) by absorption in gas accompanying the observed dust, and values decreased by X-ray absorption (for low dust-to-gas ratios).
Interpreting the distributions of and for relatively red quasars can be further complicated by correlations of X-ray and dust reddening properties of quasars with other quasar properties. Gallagher et al. (2005) find that quasars with large C IV blueshifts have X-ray absorption without significant dust reddening, since such quasars have relatively blue optical/UV spectra on average (Richards et al. 2002). Reichard et al. (2003a) noted that the heavily X-ray-absorbed broad absorption line quasars are dust-reddened but intrinsically blue.
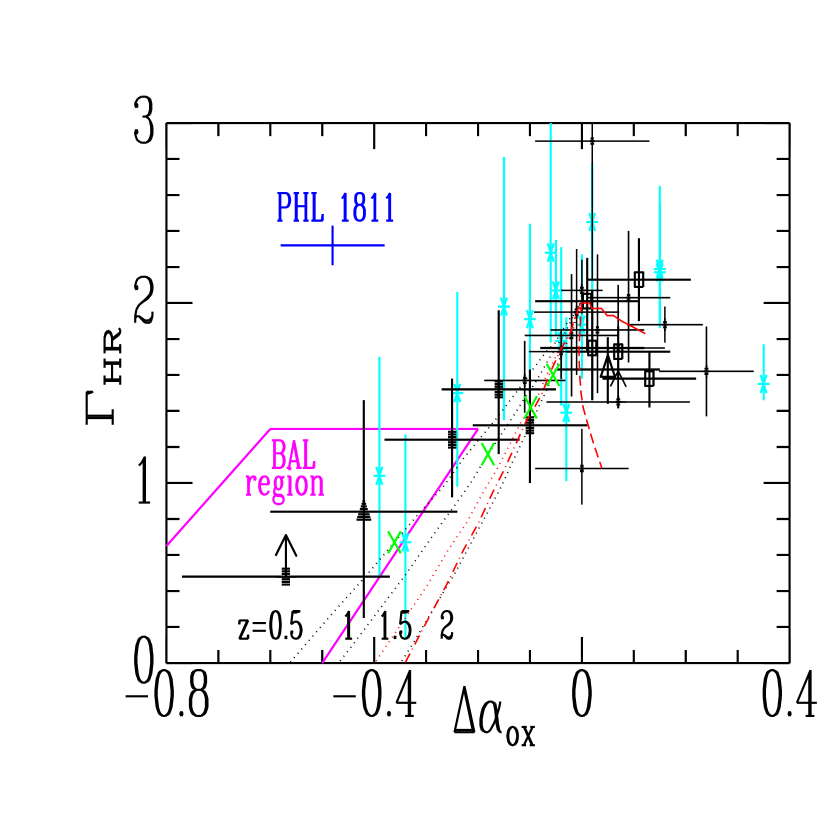
Thus, even with exploratory X-ray data it can be difficult to securely distinguish intrinsically red quasars from quasars reddened by SMC-like dust. To demonstrate this, in Figure 7 we replot vs. . We have added an outline of the region in which broad absorption line (BAL) quasars are found (Gallagher et al. 2006). We have also added points for quasars with and readily available in the literature; namely, the unusual, optically very blue and luminous, yet X-ray faint quasar PHL 1811 (Leighly, Halpern, & Jenkins 2004; Choi, Leighly, & Matsumoto 2005) and the putative soft X-ray weak AGN of Risaliti et al. (2003).333As pointed out by Brandt, Schneider, & Vignali (2004) and Strateva et al. (2005), the bulk of the Risaliti et al. (2003) objects are not actually X-ray weak if the luminosity dependence of is taken into account. The two Risaliti et al. (2003) objects with the most negative also have the lowest (the quasars in question are HS 0848+1119 and HS 0854+0915, discounting the BAL quasar HS 1415+2701 which has only an upper limit on ). Yet even though both fall on the neutral absorption tracks, the lack of spectral curvature in their spectra points to their being intrinsically red rather than dust reddened (although there is a 10% chance that HS 0854+0915 is an unrecognized high-ionization BAL quasar).
Similarly, our best estimate is that the two uppermost filled squares in Figure 6 are quasars with intrinsically red SEDs, but these two objects also lie on the tracks of neutral absorption. Thus, falling on the neutral absorption track in this diagram is no guarantee that neutral absorption is causing the X-ray faintness and spectral flatness. X-ray spectral fitting may help resolve such a degeneracy, but only if the spectrum has sufficient counts to be fit.
Possibly the best candidate for an intrinsically red quasar in our Chandra sample is J0156+0053 from Gallagher et al. (2005). This object has 1, 0, and an optical/UV spectrum with a red continuum and strong emission lines. However, that classification could not be made without reference to the SDSS spectrum because in all our plots this object appears consistent with dust reddening (specifically, with a dust-to-gas ratio 10% of the SMC ratio).
Finally, note that the three leftmost quasars in Figure 6 have properties marginally inconsistent with X-ray absorption from gas with a dust-to-gas ratio even just 10% as large as observed in the SMC, as might be expected from gas in an intervening galaxy. Instead, they are most consistent with absorption from large columns of partially ionized gas with dust-to-gas ratios 1% of the SMC value, consistent with the expected characteristics of gas in the immediate quasar environment. These X-ray-faint objects do overlap part of the - diagram inhabited by BAL quasars (Gallagher et al. 2006), but lie much closer to the neutral absorption tracks for their redshifts than do most BAL quasars. These X-ray-faint objects are unlikely to be BAL quasars but could nonetheless have either ionized intrinsic absorption, or neutral intrinsic absorption with 90–95% partial covering.
5.1 Comparison with AGN
Though both samples are referred to as red, our sample and the AGN studied in the X-ray by Wilkes et al. (2005) are substantially different. The primary differences are that the AGN are less luminous and at lower redshift. Both differences make it more difficult in samples to isolate the nuclear emission in the optical/near-IR (from the host galaxy’s flux) and in the X-ray (from AGN- or starburst-related soft excesses and a larger fraction of hard-band flux from reflection).
For example, substantial reddening of AGN has been claimed based on the low -band luminosities of many AGN in HST imaging (Marble et al. 2003) and low -band luminosities from CFHT imaging (Hutchings et al. 2003). An equally plausible interpretation is that at least some objects are low-luminosity AGN in luminous host galaxies with substantial near-IR emission from hot nuclear dust, which can produce quite red colors if present in sufficient quantities (Scoville et al. 2000; Rodríguez-Ardila & Mazzalay 2006).
If correct, this interpretation would also help explain the X-ray faintness of the four AGN in Wilkes et al. (2005) which are not type 2 AGN: they would in fact have normal . (Note that only one of the four has a value of (2-10 keV) harder than the range spanned by our quasar sample, but that they lack values because their intrinsic nuclear are not known.) To understand the intrinsic nuclear luminosities of AGN, high-resolution near-IR imaging is needed to directly measure the relative AGN and host galaxy contributions to the integrated and band magnitudes.
While quasar samples selected to have do include red quasars,444For example, a high polarization subsample chosen for spectropolarimetry has revealed some reddened broad-line AGN (Smith et al. 2003). the lack of a relation between and in Figure 3 suggests that selection is not the optimal way to select the most complete and least contaminated samples of dust-reddened AGN. Of course, our relatively red quasar sample will miss the most heavily reddened quasars and has its share of contaminants as well. Therefore, better samples are needed to understand the dust reddened quasar population and to separate it from the intrinsically red quasar population. The most promising additional criterion to use in selecting dust-reddened quasars is spectral curvature, which arises from the extinction properties of small dust grains. Spectral curvature should be measurable from broadband photometry (e.g., §4.2.1), especially if it extends from the rest-frame far-UV (e.g., GALEX) through the near-IR, as well as from well-calibrated, wide--coverage spectroscopy.
6 Conclusions
We have used short Chandra observations to demonstrate that optically red quasars are marginally more likely to exhibit evidence for X-ray absorption than optically blue quasars, but that not all optically red quasars exhibit X-ray absorption (§ 4 and § 5). Four of the five quasars in our sample with optical spectra most consistent with dust reddening at the quasar redshift (§ 4.2.13) show signatures in and of X-ray absorption from neutral or partially ionized gas with column densities and dust-to-gas ratios 1% of the SMC value (§ 4.1 and § 5). However, half of our sample shows no evidence for such absorption. We conclude that dust-reddened type 1 AGN (as opposed to fully obscured type 2 AGN) are unlikely to contribute significantly to the remaining unresolved hard X-ray background, at least for the levels of extinction probed by our sample.
Plausible origins have been identified (see the Appendix) for most of the intrinsic dispersion exhibited by quasars in (the correlation of with luminosity, plus flux variability in both bands) and possibly in (the possible correlation of with , plus X-ray spectral variability). However, the existence of rare outliers like PHL 1811 underscores our ignorance of how those parameters interact to produce the observed and values.
Progress in understanding the X-ray properties of the type 1 radio-quiet quasar population will require even more careful work to create samples that are as homogeneous as possible (§ 5.1). Such samples must not only be thoroughly vetted to remove quasars exhibiting strong intervening absorption and BAL troughs, but should also span the observed ranges of luminosity, C IV blueshift, , optical/UV spectral curvature, estimated , and possibly emission-line EW, since all those properties may be interrelated with a quasar’s X-ray properties. While such studies can make use of serendipitous archival observations of random quasars (e.g., Gallagher et al. 2005; Strateva et al. 2005; Risaliti & Elvis 2005), the surface density of relatively bright quasars on the sky is low and the the fraction of the sky covered by hard X-ray observations is small. Serendipitous observations do not yield samples that cleanly span the full range of quasar properties, and so there is a continuing need for targeted X-ray observations of carefully selected quasar samples.
References
- Akritas & Bershady (1996) Akritas, M. G. & Bershady, M. A. 1996, ApJ, 470, 706
- Alexander, Brandt, Hornschemeier, Garmire, Schneider, Bauer, & Griffiths (2001) Alexander, D., Brandt, W., Hornschemeier, A., et al. 2001, AJ, 122, 2156
- Antonucci (1993) Antonucci, R. 1993, ARA&A, 31, 473
- Arnaud (1996) Arnaud, K. A. 1996, in ADASS V, ed. G. Jacoby & J. Barnes, 17
- Barkhouse & Hall (2001) Barkhouse, W. A. & Hall, P. B. 2001, AJ, 121, 2843
- Bauer, Alexander, Brandt, Schneider, Treister, Hornschemeier, & Garmire (2004) Bauer, F. E., Alexander, D. M., Brandt, W. N., et al. 2004, AJ, 128, 2048
- Bauer, Alexander, N., Schneider, Treister, Hornschemeier, & Garmire (2004) Bauer, F. E., Alexander, D. M., N., B. W., et al. 2004, AJ, 128, 2048
- Becker, White, & Helfand (1995) Becker, R. H., White, R. L., & Helfand, D. J. 1995, ApJ, 450, 559
- Brandt, Schneider, & Vignali (2004) Brandt, W., Schneider, D., & Vignali, C. 2004, in AGN Physics with the Sloan Digital Sky Survey, ed. G. T. Richards & P. B. Hall, 303
- Brandt, Laor, & Wills (2000) Brandt, W. N., Laor, A., & Wills, B. J. 2000, ApJ, 528, 637
- Cash (1979) Cash, W. 1979, ApJ, 228, 939
- Choi, Leighly, & Matsumoto (2005) Choi, J., Leighly, K. M., & Matsumoto, C. 2005, American Astronomical Society Meeting Abstracts, 206
- Cutri, Nelson, Francis, & Smith (2002) Cutri, R. M., Nelson, B. O., Francis, P. J., et al. 2002, in AGN Surveys, ed. R. F. Green, E. Y. Khachikian, & D. B. Sanders, 127
- Dickey & Lockman (1990) Dickey, J. M. & Lockman, F. J. 1990, ARA&A, 28, 215
- Freeman, Kashyap, Rosner, & Lamb (2002) Freeman, P. E., Kashyap, V., Rosner, R., et al. 2002, ApJS, 138, 185
- Gallagher, Richards, Hall, Brandt, Schneider, & Vanden Berk (2005) Gallagher, S., Richards, G., Hall, P., et al. 2005, AJ, 129, 567
- Gallagher, Brandt, Chartas, Priddey, Garmire, & Sambruna (2006) Gallagher, S. C., Brandt, W. N., Chartas, G., et al. 2006, ApJ, in press (astro-ph/0404487)
- Garmire, Bautz, Ford, Nousek, & Ricker (2003) Garmire, G. P., Bautz, M. W., Ford, P. G., et al. 2003, in X-Ray and Gamma-Ray Telescopes and Instruments for Astronomy, Proc. SPIE 4851, ed. J. E. Truemper & H. D. Tananbaum, 28
- Gehrels (1986) Gehrels, N. 1986, ApJ, 303, 336
- George, Turner, Yaqoob, Netzer, Laor, Mushotzky, Nandra, & Takahashi (2000) George, I. M., Turner, T. J., Yaqoob, T., et al. 2000, ApJ, 531, 52
- Hao, Strauss, Fan, Tremonti, Schlegel, Heckman, Kauffmann, Blanton, Gunn, Hall, Ivezić, Knapp, Krolik, Lupton, Richards, Schneider, Strateva, Zakamska, Brinkmann, & Szokoly (2005) Hao, L., Strauss, M. A., Fan, X., et al. 2005, AJ, 129, 1795
- Hopkins, Strauss, Hall, Richards, Cooper, Schneider, Vanden Berk, Jester, Brinkmann, & Szokoly (2004) Hopkins, P. F., Strauss, M. A., Hall, P. B., et al. 2004, AJ, 128, 1112
- Hutchings, Maddox, Cutri, & Nelson (2003) Hutchings, J. B., Maddox, N., Cutri, R. M., et al. 2003, AJ, 126, 63
- Ivezić, Lupton, Juric, Anderson, Hall, Richards, Rockosi, Berk, Turner, Knapp, Gunn, Schlegel, Strauss, & Schneider (2004) Ivezić, Ž., Lupton, R. H., Juric, M., et al. 2004, in The Interplay Among Black Holes, Stars and ISM in Galactic Nuclei, ed. T. Storchi Bergmann, L. C. Ho, & H. R. Schmitt, 525
- Khare, Kulkarni, Lauroesch, York, Crotts, & Nakamura (2004) Khare, P., Kulkarni, V., Lauroesch, J. T., et al. 2004, ApJ, 616, 86
- Khare, York, vanden Berk, Kulkarni, Crotts, Welty, Lauroesch, Richards, Alsayyad, Kumar, Lundgren, Shanidze, Vanlandingham, Baugher, Hall, Jenkins, Menard, Rao, Turnshek, & Yip (2005) Khare, P., York, D. G., vanden Berk, D., et al. 2005, in IAU Colloq. 199: Probing Galaxies through Quasar Absorption Lines, ed. P. Williams, C.-G. Shu, & B. Menard, 427–429
- Kraft, Burrows, & Nousek (1991) Kraft, R. P., Burrows, D. N., & Nousek, J. A. 1991, ApJ, 374, 344
- Laor, Fiore, Elvis, Wilkes, & McDowell (1994) Laor, A., Fiore, F., Elvis, M., et al. 1994, ApJ, 435, 611
- Leighly, Halpern, & Jenkins (2004) Leighly, K., Halpern, J., & Jenkins, E. 2004, in AGN Physics with the Sloan Digital Sky Survey, ed. G. T. Richards & P. B. Hall, 277
- Lyons (1991) Lyons, L. 1991, Data Analysis for Physical Science Students (Cambridge: Cambridge University Press)
- Maddox & Hewett (2006) Maddox, N. & Hewett, P. C. 2006, MNRAS, 176
- Manners, Almaini, & Lawrence (2002) Manners, J., Almaini, O., & Lawrence, A. 2002, MNRAS, 330, 390
- Marble, Hines, Schmidt, Smith, Surace, Armus, Cutri, & Nelson (2003) Marble, A., Hines, D., Schmidt, G., et al. 2003, ApJ, 590, 707
- Markowitz, Edelson, & Vaughan (2003) Markowitz, A., Edelson, R., & Vaughan, S. 2003, ApJ, 598, 935
- Marshall, Boldt, Holt, Miller, Mushotzky, Rose, Rothschild, & Serlemitsos (1980) Marshall, F. E., Boldt, E. A., Holt, S. S., et al. 1980, ApJ, 235, 4
- Mateos, Barcons, Carrera, Ceballos, Hasinger, Lehmann, Fabian, & Streblyanska (2005) Mateos, S., Barcons, X., Carrera, F. J., et al. 2005, A&A, 444, 79
- Peroux, Kulkarni, Meiring, Ferlet, Khare, Lauroesch, Vladilo, & York (2006) Peroux, C., Kulkarni, V., Meiring, J., et al. 2006, A&A
- Rao & Turnshek (2000) Rao, S. M. & Turnshek, D. A. 2000, ApJS, 130, 1
- Reeves & Turner (2000) Reeves, J. N. & Turner, M. J. L. 2000, MNRAS, 316, 234
- (40) Reichard, T., Richards, G., Hall, P., et al. 2003a, AJ, 126, 2594
- (41) Reichard, T., Richards, G., Schneider, D., et al. 2003b, AJ, 125, 1711
- Richards, Hall, Vanden Berk, Strauss, Schneider, Weinstein, Reichard, York, Knapp, Fan, Ivezić, Brinkmann, Budavári, Csabai, & Nichol (2003) Richards, G., Hall, P., Vanden Berk, D., et al. 2003, AJ, 126, 1131
- Richards, Vanden Berk, Reichard, Hall, Schneider, SubbaRao, Thakar, & York (2002) Richards, G., Vanden Berk, D., Reichard, T., et al. 2002, AJ, 124, 1
- Richards et al. (2001) Richards et al. 2001, AJ, 121, 2308
- Risaliti & Elvis (2005) Risaliti, G. & Elvis, M. 2005, ApJ, 629, L17
- Risaliti, Elvis, Gilli, & Salvati (2003) Risaliti, G., Elvis, M., Gilli, R., et al. 2003, ApJ, 587, L9
- Rodríguez-Ardila & Mazzalay (2006) Rodríguez-Ardila, A. & Mazzalay, X. 2006, MNRAS, L12
- Schaye (2001) Schaye, J. 2001, ApJ, 562, L95
- Schneider, Hall, Richards, Vanden Berk, Anderson, Fan, Jester, Stoughton, Strauss, SubbaRao, Brandt, Gunn, Yanny, Bahcall, Barentine, Blanton, Boroski, Brewington, Brinkmann, Brunner, Csabai, Doi, Eisenstein, Frieman, Fukugita, Gray, Harvanek, Heckman, Ivezić, Kent, Kleinman, Knapp, Kron, Krzesinski, Long, Loveday, Lupton, Margon, Munn, Neilsen, Newberg, Newman, Nichol, Nitta, Pier, Rockosi, Saxe, Schlegel, Snedden, Szalay, Thakar, Uomoto, Voges, & York (2005) Schneider, D., Hall, P., Richards, G., et al. 2005, AJ, 130, 367
- Schneider, Richards, Fan, Hall, Strauss, Vanden Berk, Gunn, Newberg, Reichard, Stoughton, Voges, Yanny, Anderson, Annis, Bahcall, Bauer, Bernardi, Blanton, Boroski, Brinkmann, Briggs, Brunner, Burles, Carey, Castander, Connolly, Csabai, Doi, Friedman, Frieman, Fukugita, Heckman, Hennessy, Hindsley, Hogg, Ivezić, Kent, Knapp, Kunzst, Lamb, Leger, Long, Loveday, Lupton, Margon, Meiksin, Merelli, Munn, Newcomb, Nichol, Owen, Pier, Pope, Rockosi, Saxe, Schlegel, Siegmund, Smee, Snir, SubbaRao, Szalay, Thakar, Uomoto, Waddell, & York (2002) Schneider, D. P., Richards, G. T., Fan, X., et al. 2002, AJ, 123, 567
- Scoville, Evans, Thompson, Rieke, Hines, Low, Dinshaw, Surace, & Armus (2000) Scoville, N. Z., Evans, A. S., Thompson, R., et al. 2000, AJ, 119, 991
- Shastri, Wilkes, Elvis, & McDowell (1993) Shastri, P., Wilkes, B. J., Elvis, M., et al. 1993, ApJ, 410, 29
- Smith, Schmidt, Hines, & Foltz (2003) Smith, P. S., Schmidt, G. D., Hines, D. C., et al. 2003, ApJ, 593, 676
- Spergel, Bean, Doré, Nolta, Bennett, Hinshaw, Jarosik, Komatsu, Page, Peiris, Verde, Barnes, Halpern, Hill, Kogut, Limon, Meyer, Odegard, Tucker, Weiland, Wollack, & Wright (2006) Spergel, D. N., Bean, R., Doré, O., et al. 2006, ApJ, submitted (astro ph/0603449)
- Steffen, Strateva, Brandt, Alexander, Koekemoer, Lehmer, Schneider, & Vignali (2006) Steffen, A. T., Strateva, I., Brandt, W. N., et al. 2006, AJ, in press (astro-ph/0602407)
- Stern, Eisenhardt, Gorjian, Kochanek, Caldwell, Eisenstein, Brodwin, Brown, Cool, Dey, Green, Jannuzi, Murray, Pahre, & Willner (2005) Stern, D., Eisenhardt, P., Gorjian, V., et al. 2005, ApJ, 631, 163
- Strateva, Brandt, Schneider, Vanden Berk, & Vignali (2005) Strateva, I., Brandt, N., Schneider, D., et al. 2005, AJ, 130, 387
- Tozzi, Gilli, Mainieri, Norman, Risaliti, Rosati, Bergeron, Borgani, Giacconi, Hasinger, Nonino, Streblyanska, Szokoly, Wang, & Zheng (2006) Tozzi, P., Gilli, R., Mainieri, V., et al. 2006, A&A, in press (astro-ph/0602127)
- Ueda, Akiyama, Ohta, & Miyaji (2003) Ueda, Y., Akiyama, M., Ohta, K., et al. 2003, ApJ, 598, 886
- Vanden Berk, Richards, Bauer, Strauss, Schneider, Heckman, York, Hall, Fan, Knapp, Anderson, Annis, Bahcall, Bernardi, Szokoly, Tremonti, Uomoto, Waddell, Yanny, & Zheng (2001) Vanden Berk, D., Richards, G., Bauer, A., et al. 2001, AJ, 122, 549
- Wild & Hewett (2005) Wild, V. & Hewett, P. C. 2005, MNRAS, 361, L30
- Wilkes, Pounds, Schmidt, Smith, Cutri, Ghosh, Nelson, & Hines (2005) Wilkes, B., Pounds, K., Schmidt, G., et al. 2005, ApJ, 634, 183
- Wilkes, Schmidt, Cutri, Ghosh, Hines, Nelson, & Smith (2002) Wilkes, B., Schmidt, G., Cutri, R., et al. 2002, ApJ, 564, L65
- Wills, Laor, Brotherton, Wills, Wilkes, Ferland, & Shang (1999) Wills, B. J., Laor, A., Brotherton, M. S., et al. 1999, ApJ, 515, L53
- Worsley, Fabian, Bauer, Alexander, Hasinger, Mateos, Brunner, Brandt, & Schneider (2005) Worsley, M., Fabian, A., Bauer, F., et al. 2005, MNRAS, 357, 1281
- York, Adelman, Anderson, Anderson, Annis, Bahcall, Bakken, Barkhouser, Bastian, Berman, Boroski, Bracker, Briegel, Briggs, Brinkmann, Brunner, Burles, Carey, Carr, Castander, Chen, Colestock, Connolly, Crocker, Csabai, Czarapata, Davis, Doi, Dombeck, Eisenstein, Ellman, Elms, Evans, Fan, Federwitz, Fiscelli, Friedman, Frieman, Fukugita, Gillespie, Gunn, Gurbani, de Haas, Haldeman, Harris, Hayes, Heckman, Hennessy, Hindsley, Holm, Holmgren, Huang, Hull, Husby, Ichikawa, Ichikawa, Ivezić, Kent, Kim, Kinney, Klaene, Kleinman, Kleinman, Knapp, Korienek, Kron, Kunszt, Lamb, Lee, Leger, Limmongkol, Lindenmeyer, Long, Loomis, Loveday, Lucinio, Lupton, MacKinnon, Mannery, Mantsch, Margon, McGehee, McKay, Meiksin, Merelli, Monet, Munn, Narayanan, Nash, Neilsen, Neswold, Newberg, Nichol, Nicinski, Nonino, Okada, Okamura, Ostriker, Owen, Pauls, Peoples, Peterson, Petravick, Pier, Pope, Pordes, Prosapio, Rechenmacher, Quinn, Richards, Richmond, Rivetta, Rockosi, Ruthmansdorfer, Sandford, Schlegel, Schneider, Sekiguchi, Sergey, Shimasaku, Siegmund, Smee, Smith, Snedden, Stone, Stoughton, Strauss, Stubbs, SubbaRao, Szalay, Szapudi, Szokoly, Thakar, Tremonti, Tucker, Uomoto, Vanden Berk, Vogeley, Waddell, Wang, Watanabe, Weinberg, Yanny, & Yasuda (2000) York, D., Adelman, J., Anderson, J., et al. 2000, AJ, 120, 1579
- York, Khare, Vanden Berk, Kulkarni, Crotts, Lauroesch, Richards, Schneider, Welty, Alsayyad, Kumar, Lundgren, Shanidze, Smith, Vanlandingham, Baugher, Hall, Jenkins, Menard, Rao, Tumlinson, Turnshek, Yip, & Brinkmann (2006) York, D., Khare, P., Vanden Berk, D., et al. 2006, MNRAS, 367, 945


| Name (SDSS J) | aaThe spectral index for the ultraviolet continuum (where ) is measured by fitting the SDSS spectra. | bbThe values for (in units of 1020 cm-2) used in the X-ray simulations are from Galactic H I maps (Dickey & Lockman 1990). | SpectrumccThe SDSS spectrum of each target is identified by the code plate-fiber-MJD, giving its spectroscopic plate number, its fiber number within that plate, and the MJD on which the plate was observed. | CommentsddThe first comment is our best explanation for the object’s redness (see § 4.2): dust – dust reddening at the quasar redshift; SED – an intrinsically red SED; int – dust reddening by an intervening absorber; normal – apparently misclassified as red. Other comments: DLA?/DLA – The SDSS spectrum shows weak/strong evidence for a damped Ly absorber candidate; XRF – X-ray faint source with more than 1 from the - relation of Strateva et al. (2005), where is the RMS scatter in from Table 5 of Steffen et al. (2006). | ||||||
|---|---|---|---|---|---|---|---|---|---|---|
| 000230.71004959.0 | 1.355 | 17.91 | 26.54 | 0.6040.045 | 0.396 | 0.1140.035 | 3.14 | 387-575-51791 | dust; DLA? | |
| 113345.62005813.4 | 1.937 | 17.86 | 27.41 | 0.4580.071 | 0.382 | 0.0500.065 | 2.80 | 282-408-51658 | dust/int?; DLA?, XRF | |
| 122652.01001159.5 | 1.176 | 17.68 | 26.43 | 0.4590.026 | 0.261 | 0.2010.031 | 1.91 | 289-198-51990 | dust/SED? | |
| 125140.32000210.8 | 0.878 | 17.43 | 25.97 | 0.4020.027 | 0.319 | 0.1850.030 | 1.59 | 292-559-51609 | dust; XRF | |
| 130211.04000004.5 | 1.797 | 17.96 | 27.16 | 0.1910.028 | 0.363 | 0.1930.033 | 1.56 | 293-080-51994 | SED; DLA?, XRF | |
| 131058.13010822.2 | 1.392 | 17.80 | 26.66 | 0.7410.048 | 0.626 | 0.4440.029 | 1.95 | 295-325-51985 | dust/int?; DLA, XRF | |
| 132323.78002155.2 | 1.388 | 17.61 | 26.90 | 0.7620.028 | 0.463 | 0.2750.026 | 1.89 | 297-267-51959 | int; DLA | |
| 170817.85615448.5 | 1.415 | 17.64 | 26.91 | 0.2900.031 | 0.259 | 0.1080.032 | 2.51 | 351-550-51780 | dust/SED? | |
| 171419.23611944.7 | 1.847 | 17.92 | 27.27 | 0.0890.038 | 0.426 | 0.3340.042 | 2.64 | 354-360-51792 | SED | |
| 171535.96622336.0 | 2.182 | 17.96 | 27.59 | 0.1160.040 | 0.352 | 0.2960.036 | 2.62 | 352-499-51789 | SED | |
| 173551.92535515.7 | 0.956 | 17.77 | 25.84 | 0.2280.023 | 0.235 | 0.0730.026 | 3.42 | 360-219-51816 | normal | |
| 173836.16583748.5 | 1.279 | 17.51 | 26.81 | 0.3770.028 | 0.320 | 0.1850.028 | 3.63 | 366-038-52017 | dust; XRF |
| Name | Obs. ID | Date (MJD) | Exposure | CountsaaDetections for the full, soft, and hard bands are determined by wavdetect (as described in §3). Errors are 1 Poisson errors (Gehrels 1986), except for non-detections where the limits are the confidence limits from Bayesian statistics (Kraft, Burrows, & Nousek 1991). The count rate is for the full band, 0.5–8.0 keV. | Count RateaaDetections for the full, soft, and hard bands are determined by wavdetect (as described in §3). Errors are 1 Poisson errors (Gehrels 1986), except for non-detections where the limits are the confidence limits from Bayesian statistics (Kraft, Burrows, & Nousek 1991). The count rate is for the full band, 0.5–8.0 keV. | HRbbThe HR is defined as , where and are the counts in the hard (2.0–8.0 keV) and soft (0.5–2.0 keV) bands, respectively. Errors in the HR are propagated from the counting errors using the numerical method of Lyons (1991). | |
|---|---|---|---|---|---|---|---|
| (SDSS J) | Time (ks) | Soft | Hard | (10-3 ct s-1) | |||
| 000230.71004959.0 | 4861 | 2003 Nov 09 (52952) | 5.67 | 130 | 20 | 26.63 | |
| 113345.62005813.4 | 4858 | 2004 Mar 29 (53093) | 4.26 | ||||
| 122652.01001159.5 | 4865 | 2004 Feb 12 (53047) | 4.90 | 87 | 16 | 21.03 | |
| 125140.32000210.8 | 4859 | 2004 Mar 08 (53072) | 4.04 | 27 | 12 | 9.89 | |
| 130211.04000004.5 | 4862 | 2004 May 12 (53150) | 4.90 | 25 | 8 | 6.73 | |
| 131058.13010822.2 | 4854 | 2004 Mar 26 (53090) | 5.45 | 7 | 5 | 2.39 | |
| 132323.78002155.2 | 4855 | 2004 May 09 (53147) | 4.36 | 102 | 29 | 30.05 | |
| 170817.85615448.5 | 4864 | 2003 Nov 16 (52959) | 4.06 | 153 | 46 | 49.02 | |
| 171419.23611944.7 | 4856 | 2003 Nov 16 (52959) | 4.62 | 32 | 13 | 9.74 | |
| 171535.96632336.0 | 4857 | 2004 Sep 29 (53277) | 4.25 | 50 | 12 | 14.81 | |
| 173551.92535515.7 | 4863 | 2003 Nov 09 (52952) | 5.42 | 188 | 47 | 43.34 | |
| 173836.16583748.5 | 4860 | 2003 Nov 16 (52959) | 3.87 | 5 | 1.81 | ||
| Name (SDSS J) | aa is a coarse measure of the hardness of the X-ray spectrum determined by comparing the observed HR (see Table 2) to a simulated HR that takes into account temporal variations in the instrument response and the Galactic toward the target (see 3). | bbThe full-band X-ray flux, , has units of erg cm-2 s-1 and is calculated by integrating the power-law spectrum given by and normalized by the full-band count rate from 0.5–8.0 keV. The errors are derived from the 1 errors in the full-band count rate. | ccX-ray and optical flux densities were measured at rest-frame 2 keV and 2500 Å, respectively; units are erg cm-2 s-1 Hz-1. | ccX-ray and optical flux densities were measured at rest-frame 2 keV and 2500 Å, respectively; units are erg cm-2 s-1 Hz-1. | ccX-ray and optical flux densities were measured at rest-frame 2 keV and 2500 Å, respectively; units are erg cm-2 s-1 Hz-1. | ddThe rest-frame 2 keV and 2500 Å luminosity densities ( and , respectively) have units of erg s-1 Hz-1. | ee is the difference between the observed and the expected calculated from Equation 6 of Strateva et al. (2005) using . The general quasar population has an observed RMS scatter around =0 of 0.146 at (Table 5 of Steffen et al. 2006). | |
|---|---|---|---|---|---|---|---|---|
| 000230.71004959.0 | 2.13 | 27.096 | 30.983 | |||||
| 113345.62005813.4 | 31.452 | |||||||
| 122652.01001159.5 | 2.01 | 26.826 | 31.042 | |||||
| 125140.32000210.8 | 1.24 | 26.107 | 30.861 | |||||
| 130211.04000004.5 | 1.52 | 26.668 | 31.365 | |||||
| 131058.13010822.2 | 0.84 | 25.782 | 31.069 | |||||
| 132323.78002155.2 | 1.63 | 27.094 | 31.179 | |||||
| 170817.85615448.5 | 1.58 | 27.309 | 31.225 | |||||
| 171419.23611944.7 | 1.32 | 26.791 | 31.314 | |||||
| 171535.96632336.0 | 1.75 | 27.260 | 31.545 | |||||
| 173551.92535515.7 | 1.73 | 26.896 | 30.846 | |||||
| 173836.16583748.5 | 25.450 | 31.197 |
| Name | -stat/ | Total | ||
|---|---|---|---|---|
| (SDSS J) | (1022 cm-2) | Counts | ||
| 000230.71004959.0 | 214/512 | 151 | ||
| 122652.01001159.5 | 210/512 | 103 | ||
| 132323.78002155.2 | 230/512 | 131 | ||
| 170817.85615448.5 | 280/51 | 197 | ||
| 171535.96632336.0 | 183/51 | 62 | ||
| 173551.92535515.7 | 270/51 | 232 |
Appendix A Intrinsic Scatter in and
Between this paper and Gallagher et al. (2005), we have a sample of about two dozen objects with data of sufficient quality and uniformity to investigate the intrinsic dispersion in and among radio-quiet quasars at .
Accounting for our measurement errors and excluding the three clearly anomalous objects with the most negative , all of which we have classified as predominantly dust reddened, we find the intrinsic dispersion in to be , assuming a Gaussian distribution. (The standard deviation in observed in the sample of Strateva et al. (2005) is 0.13, but they do not estimate the intrinsic dispersion.) This is equivalent to a dispersion of 35% in the X-ray luminosity at a fixed UV luminosity. Scatter in the line-of-sight dust extinction will contribute to this dispersion, but its amplitude is consistent with it being entirely due to X-ray variability (Manners, Almaini, & Lawrence 2002). Our uncertainties already include a statistical correction for UV variability.
As for , excluding the two lower limits we find the observed dispersion in to be , in good agreement with George et al. (2000) and Mateos et al. (2005). The dispersion in around the correlation with is much lower (). Nonetheless, it still may be larger than the dispersion in attributable to time variability (; Markowitz, Edelson, & Vaughan 2003). We agree with Risaliti & Elvis (2005) that the remaining dispersion in is not attributable to differences in obscuration, because in Figure 4 even the bluest quasars show a scatter in . Nor is it attributable to trends with redshift or luminosity, since does not seem to correlate with either (Tozzi et al. 2006).
In summary, we suggest that the observed dispersion in seen in quasars lacking UV absorption is entirely explained by the known correlation of with luminosity, the effects of flux variability, and a small contribution from dust extinction. On the other hand, only 60% of the observed dispersion in is explained by the effects of spectral variability plus the observed correlation of with . The remaining dispersion may arise because does correlate with numerous other optical and ultraviolet spectral properties (e.g., Laor et al. 1994; Wills et al. 1999). Those latter studies, among others, have suggested that a steep corresponds to a large Eddington ratio. Thus, although the exact mechanisms which determine the observed values and trends of and in quasars may be unclear, it appears that we have identified the predominant sources of scatter in those relationships.