Chandra Observations of Galactic Center: High Energy Processes at Arcsecond Resolution
Abstract
About 2 million seconds of Chandra observing time have been devoted to the Galactic center (GC), including large-scale surveys and deep pointings. These observations have led to the detection of about 4000 discrete X-ray sources and the mapping of diffuse X-ray emission in various energy bands. In this review, I first summarize general results from recent studies and then present close-up views of the three massive star clusters (Arches, Quintuplet, and GC) and their interplay with the Galactic nuclear environment.
1 Introduction
While Sgr A* itself is only weakly active at present, much of the high-energy activity in the GC is initiated apparently by the three young massive stellar clusters, located within 50 pc radius of the super-massive black hole Sgr A* (Fig. 1): Arches [with an age of yrs], Quintuplet [ yrs], and GC [ yrs] (e.g., Figer et al. 2004; Stolte et al. 2002, 2005; Genzel et al. 2003). Massive stars themselves can be moderately bright X-ray sources (e.g., colliding stellar wind binaries). Such stars also release large amounts of mechanical energy in form of fast stellar winds and supernovae, heating and shaping the surrounding interstellar medium (ISM) and affecting the accretion of the black hole. Furthermore, stellar end-products of massive stars (neutron stars and black holes) can also be strong X-ray sources. X-ray observations are thus a powerful tool for probing such high-energy phenomena and processes.
The GC is a region where the spatial resolution of X-ray observations matters. This is why Chandra has invested heavily on the GC, conducting repeated large-scale raster surveys [existing 360 ks (Wang et al. 2002a) and upcoming 600 ks (PI: Muno)] and numerous deep pointed observations: about 1 Ms on Sgr A (Baganoff et al. 2003), 100 ks each on Sgr B (Takagi et al. 2002), Sgr C (PI: Murakami), and Arches (Wang et al. 2006a), as well as 50 ks on Radio Arc (Yusef-Zadeh et al. 2002a). The main instrument used in these Chandra observations is the ACIS-I, which covers a field of and an energy range of 0.5-10 keV. But below keV, X-rays from the GC are heavily absorbed by the ISM. The spatial resolution ranges from on-axis to at the outer boundaries of the field.
While much of the data analysis is still ongoing, here I will first summarize some of the general results on detected discrete sources and diffuse X-ray emission and will then focus on the three massive star clusters, highlighting various high-energy phenomena and processes involved.
2 General results on point-like X-ray sources
The Chandra observations have led to the detection of about 4000 discrete sources; about 2400 of them are from the deep Sgr A observations (Wang et al. 2002a; Muno et al. 2003, 2006; Wang et al. 2006a). Most of these sources are located physically in the vicinity of the GC, judged from their X-ray spectral characteristics and number statistics. The number-flux relation (or the so-called log-log relation) of the GC sources can be approximated as a power law with an index of . But the relation is flatter (over the luminosity range of ) in the vicinity of the Arches and Quintuplet clusters (Muno et al. 2006; Wang et al. 2006a), apparently due to the concentrations of massive stars and possibly their end-products.
The GC X-ray sources represent a heterogeneous population of high-energy objects. Bright sources (1E 1740.7-2942 and 1E 1743.1-2843) with 2-10 keV luminosities are low-mass X-ray binaries (LMXBs). There is a clear dearth of X-ray sources with , although a few transients are detected in this intermediate luminosity range (e.g., Muno et al. 2005; Sakano et al. 2005; Wijnands et al. 2006; Wang et al. 2006a). Sources within the range of tend to be colliding wind massive star binaries (Wang et al. 2006a) and possibly young pulsars (Wang et al. 2002b; Wang et al. 2006b). The nature of fainter sources () are less certain; many of them are likely to be CVs, consistent with the lack of bright stellar counterparts in near-IR and radio surveys (e.g., Laycock et al. 2005; Bandyopadhyay 2005). A fraction of these sources have very hard X-ray spectra (e.g., with power law photon indices less than 0; Muno et al. 2004a). Such sources are most likely intermediate polars, in which X-ray-emitting regions are at least partially obscured and the observed X-rays represent the reflected emission (Ruiter, Belczynski, & Harrison 2006).
3 General results on diffuse X-ray emission
Despite of their large number, the detected discrete X-ray sources typically account for only about 10% of the total observed X-ray emission from the GC. The spectra of the remaining “diffuse” emission and the accumulated spectrum of the sources are similar, in terms of both the continuum shape and the presence of prominent emission lines such as He-like S and Fe K transitions, which indicate a broad thermal plasma temperature range of keV (Wang et al. 2002a; Muno et al. 2004b). The spatial distribution of the diffuse emission appears to follow closely the K-band stellar light (Muno et al. 2006). Therefore, a bulk of the emission likely originates in the old stellar population (coronally active binaries and CVs), as has been proposed for the Galactic ridge hard X-ray emission (Revnivtsev et al. 2005).
There is no clear evidence for a significant presence of truly diffuse gas with keV, as was believed for many years. But a non-thermal diffuse hard X-ray component does seem to be important (Wang et al. 2002a; see also the presentation by B. Warwick). The strongest evidence for this component is the ubiquitous presence of the 6.4-keV line emission, globally correlated with the molecular gas in the GC region. The line emission arises from the filling of inner shell vacancies of neutral or weakly ionized irons, which can be effectively produced by ionizing radiation with energies keV. Because of the high equivalent width ( keV) of the observed line, the source of the ionizing radiation must be currently obscured or absent. This reflection interpretation gives the most convincing interpretation for the 6.4-keV line emission associated with the giant molecular clouds, Sgr B2 and Sgr C. The required ionizing source is believed to be Sgr A*, which might be substantially brighter () several hundred years ago. Indeed, the continuum emission from Sgr B, presumably due to the reflection through electron Thompson scattering, is shown to have a hard X-ray spectrum (power law photon index ) in the 2-200 keV range, consistent with what is expected from a typical AGN (Revnivtsev et al. 2004). However, the reflection interpretation is less successful in explaining the 6.4-keV line emission observed in fields closer to Sgr A* (e.g., Wang et al. 2002a). While the line intensity is globally correlated with the emission from trace molecules, a peak-to-peak correlation is often absent. The lack of such a correlation is not expected, because molecular clouds should be optically thin to the X-ray radiation. But it is possible that their density peaks may be optically thick to the emission such as CS (J=2-1).
An alternative mechanism to produce the K-shell vacancies is the collision of irons with low energy cosmic ray electrons (LECRe; Valinia et al. 2000). In this case, one also expect a hard X-ray emission from the bremsstrahlung process. The problem with this mechanism is the low efficiency of the emission (typically ); most of the energy is consumed in the ionization loss. It is not clear how the required energy density of the LECRe could be maintained globally even in the GC region.
4 Chandra view of the massive star clusters in the GC region
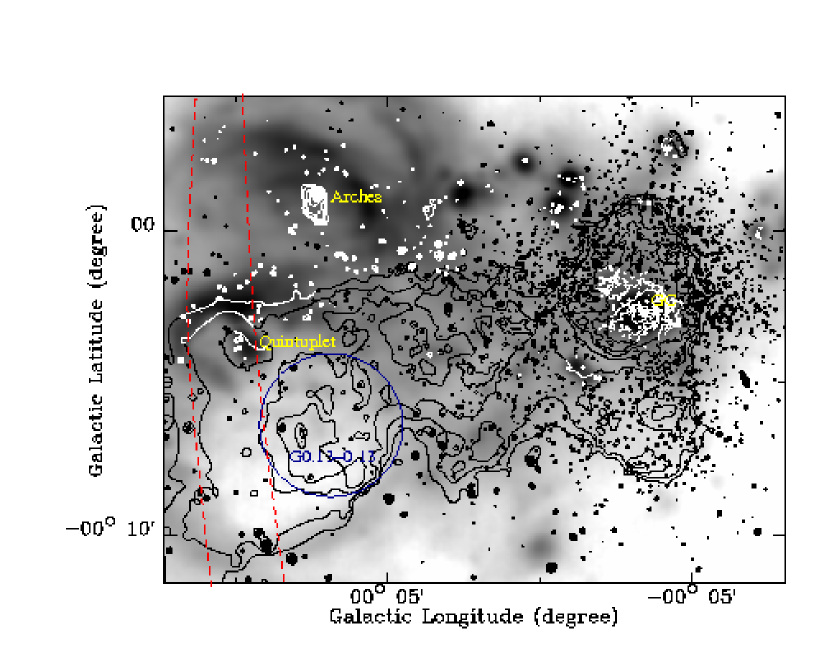
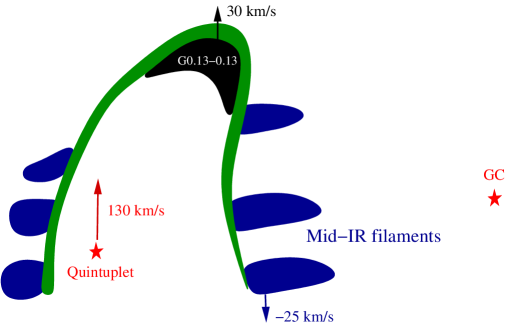
Fig. 1 presents the global perspective of the Arches and Quintuplet clusters in the GC environment. This most active region also includes various prominent thermal and nonthermal radio filaments, dense molecular clouds, and strong diffuse X-ray emission, all of which are concentrated on the positive Galactic longitude side of Sgr A∗ (Wang et al. 2006a and references therein). This lopsided distribution of these features may partly be a chance coincidence. But some of the features are likely to be related, although they seem to have very different line-of-sight velocities. The thermal mid-IR-emitting filaments are clearly due to the radiative heating of the Arches and Quintuplet clusters, while the strong 6.4-keV line emission is associated with the dense molecular gas (Wang et al. 2002a; Yusef-Zadeh et al. 2002b). Fig. 2 illustrates a scenario that provides a unified interpretation of various distinct interstellar features observed in the region. The densest cloud G0.13-0.13 in the region (Handa et al. 2006) is projected inside the west part of the distinct mid-IR cavity (Fig. 1; Price et al. 2001) and is probably located at the far side of a tunnel dug out by the cloud (Fig. 2). This tunnel in projection is seen as the cavity and is apparently filled with hot plasma, responsible for the enhanced diffuse X-ray emission (Fig. 1; Wang et al. 2006a). This scenario is consistent with the lack of an enhanced near-IR extinction toward G0.13-0.13 and with the high excitation of molecular gas associated with the cloud, apparently due to shock-heating (Handa et al. 2006). The compression of the inter-cloud medium (the cavity wall in Fig. 2), hence the attached magnetic field, may even explain the nonthermal radio filaments. The diffuse X-ray emission, both thermal and nonthermal, are likely products of the mechanical energy input from the massive star clusters. Much work is still required to clarify what is actually going on in this unusually dynamic region of the GC.
4.1 The Arches and Quintuplet Clusters
Both the Arches and Quintuplet clusters are associated with local enhancements of X-ray emission (e.g., Fig. 3), which was discovered serendipitously at large off-axis angles in early Chandra observations (Yusef-Zadeh et al. 2002a; Wang et al. 2002a; Law & Yusef-Zadeh 2004). A recent 100 ks observation allows for an in-depth study of both discrete and diffuse components of the X-ray emission from these two clusters (Wang et al. 2006a).
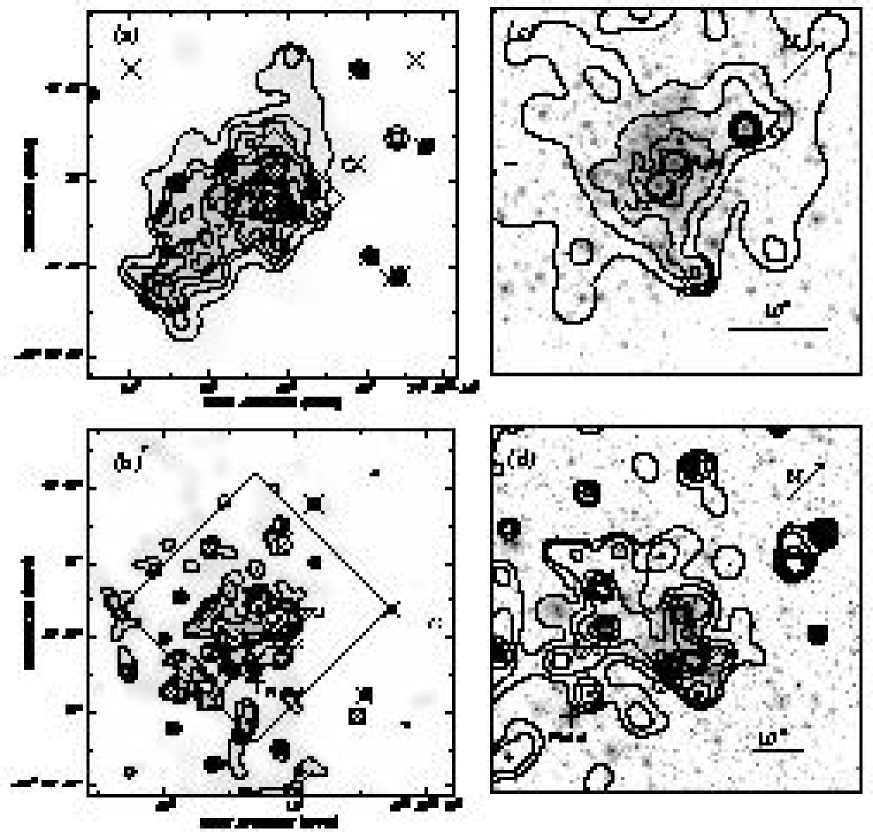
The three bright X-ray sources in the Arches core region all have near-IR counterparts, classified as WN stars (Fig. 3b). These sources have remarkably similar spectra, in terms of both the continuum shape and the strong presence of the 6.7-keV line (Fig. 5). The spectrum can be characterized by an optically-thin thermal plasma with a temperature of keV and a metal (chiefly iron) abundance of 1.8 solar. The 0.3-8 keV luminosity of each source is . With these properties, the sources are most likely colliding wind massive star binaries, although their luminosities are somewhat higher than all known such objects. The X-ray metal abundance measurement, based primarily on the He-like Fe K line, is also interesting, which is insensitive to the exact temperature of the plasma. The optically-thin thermal emission process is also quite simple, astrophysically. Furthermore, the iron abundance in the stellar winds should not be contaminated by the nuclear synthesis of these stars and thus reflect the value in the ISM of the GC.


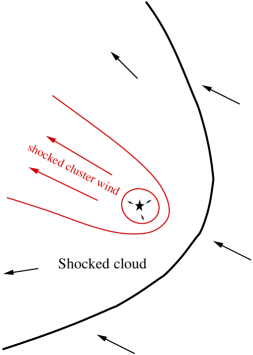
The nature of the source-removed “diffuse” emission is more complicated. The overall spectrum of the emission shows both 6.4-keV and 6.7-keV emission lines. The 6.7-keV line arises predominately in the region close to the core of the Arches cluster. The region has an extent of and appears to be elongated towards the east, morphologically matching an extinction deficit around the cluster (Stolte et al. 2002). The 6.4-keV line emission is more widely distributed, but is particularly enhanced in the southeast extension of the diffuse X-ray emission (Fig. 3a and Fig. 5). All these can be interpreted as the collision between the cluster wind of the Arches cluster and a dense gas cloud (Fig. 7). The steep decline of the observed surface intensity of the diffuse X-ray emission with the off-cluster radius within is consistent with the prediction of the emission from the expanding cluster wind (Fig. 8a), whereas the flattening of the intensity distribution at larger radii (but ) likely reflects the reverse shock heating and confinement of the wind.

.
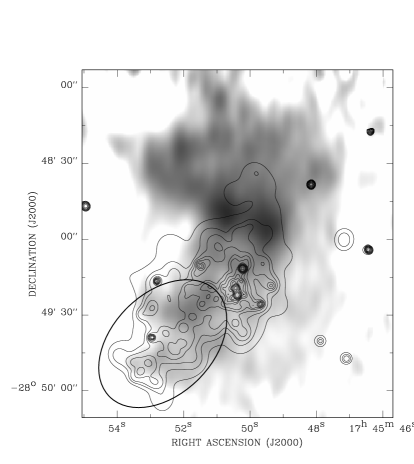
The presence of the cloud in the vicinity of the Arches cluster is known. In the CS map made by Serabyn & Gusten (1987) with the 30 IRAM telescope, the cloud is labeled as “Peak 2”. Fig. 7 shows a recent interferometry map made with OVRO (Wang et al. 2006a). The cloud has a line-of-sight velocity of (i.e., moving toward us), which is similar to many other clouds or filaments in the region. In comparison, the cluster is moving at away from us. Therefore, the relative velocity between the two is at least about . Because the filling factor of molecular clouds in the region is estimated to be about 0.3 (Serabyn & Gusten 1987), a chance collision between the cluster and such a cloud is not rare. The far-IR spectroscopy further shows the presence of a component of dusty gas at a velocity of , unique at the location of the Arches cluster (Cotera et al. 2005). This component may represent shocked cloud gas, deflected toward us.
The collision between the cluster and the cloud (Fig. 7) also provides a plausible explanation of the large-scale diffuse X-ray emission (Fig. 7). Indeed, the overall morphology of the diffuse X-ray emission resembles a bow shock. Presumably, the motion of the cloud relative to the cluster is roughly toward the east in the sky. The diffuse X-ray emission, except in the core region around the Arches cluster, is reasonably well correlated with the 6.4-keV line intensity, but shows little peak-to-peak correlation with the CS line intensity. The diffuse X-ray emission is enhanced particularly in the region southeast of the cluster, probably tracing the eastern edge of the cloud. But the northern part of the cloud, where the CS line emission is the strongest, shows no enhancement in the 6.4-keV line emission. The cloud does not seem to be dense enough to be optically thick to the CS line emission. Therefore, the radiation reflection interpretation does not work in this case. Certainly, the source of the radiation cannot be the Arches cluster itself. The luminosity of the cluster falls several orders of magnitude short of the required. The most probable origin of the diffuse X-ray X-ray emission is then LECRe that may be produced locally in and around the clusters (Wang et al. 2006a).
The older and looser Quintuplet cluster is weak in X-ray emission, both point-like and diffuse (Fig. 3b and d, Fig. 8b). The X-ray sources in the core of the cluster also show more diverse spectral characteristics, with substantially different intrinsic spectral shapes and absorptions. Some of these sources are probably colliding dusty winds in massive star binaries. The Pistol star, despite of its enormous bolometric luminosity, is not detected. But the 3 upper limit to the 0.3-8 keV luminosity, 3 , is consistent with the nominal relation for massive stars. The diffuse X-ray emission from the Quintuplet cluster () is about a factor of 10 lower than that from the Arches cluster and can be naturally explained by the cluster wind and a limited number of low-mass pre-main sequence young stellar objects (YSOs).
There appears to be a general deficiency of YSOs in the two clusters, relative to the prediction from the standard Miller & Scalo initial mass function (IMF). Compared with the X-ray emission from YSOs in the Orion nebula (Feigelson et al. 2005), the observed total diffuse X-ray luminosities from the Arches and Quintuplet clusters suggest that they contain no more than and YSOs. These numbers are a factor of 10 and 5 smaller than what would be expected from the IMF and the massive star populations observed in the cores of the two clusters. One possibility is that the IMF flattens at intermediate masses, as indicated in a near-IR study of the inner regions of the Arches cluster (Stolte et al. 2005). The top heavy IMF may be a result of the star formation in the extreme environment of the GC. In particular, collisions between dense molecular clouds such as G0.13-0.13 may be responsible for the formation of massive clusters.
4.2 The GC cluster
The deficiency of YSOs in the GC cluster has been proposed by Nayakshin et al. (2005), based on the observed diffuse X-ray intensity of the region (Fig. 10; Baganoff et al. 2003). From the X-ray constraint on the total mass of the cluster, they further conclude that it cannot be a remnant of a massive star cluster that originated at several tens of parsecs away from Sgr A* and then dynamically spiralled in. The GC cluster was thus most likely formed in situ in a self-gravitating circum-nuclear disk. Therefore, the top heavy IMF appears to be a general characteristic of star formation in the GC region. But the exact form of the IMF is yet to be determined for the clusters.
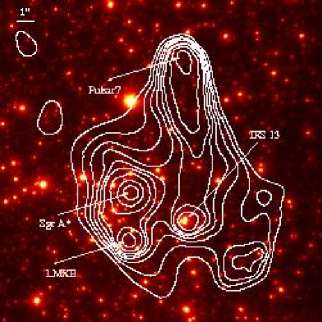

The diffuse X-ray emission from the GC cluster region appears significantly different from those from the Arches and Quintuplet clusters. The spectrum of the emission shows a Fe K emission line at an intermediate energy keV (e.g., Fig. 10b; Baganoff et al. 2003), which is a clear signature for the non-equilibrium ionization (NEI) state of the X-ray-emitting plasma with an ionization timescale (Wang et al. 2006b). The source of the plasma is likely to be the stellar winds from massive stars in the GC cluster. We may assume that the pre-shock stellar winds are cold ( K) and generally have velocities of ). Fig. 10 shows that the distribution of the stars is not very centrally concentrated, except for the compact sub-cluster complex IRS 13. The density of the shocked wind plasma is typically not very high (order ). Thus, much of the shock-heated plasma may be out of the collisional ionization equilibrium, at least in individual wind-wind shock regions.
Further constraints on the properties of the plasma may be obtained from studying its interaction with individual stars or sub-clusters. The X-ray study of IRS 13 provides such a possibility. The X-ray emission from this sub-cluster is clearly resolved and shows a non-NEI plasma spectrum (Fig. 10c). Therefore, the source most likely represents stellar wind-wind collisions. The X-ray emission may be enhanced due to a strong ram-pressure confinement by the overall GC cluster wind, plus a potential outflow from Sgr A*, as predicted in the radiatively inefficient accretion flow models (Yuan, Quataert, & Narayan 2003). The confinement is indicated by the X-ray morphology that is slightly offset from the centroid position of IRS 13 and elongated toward to the west (Wang et al. 2006b).
The properties of the plasma around Sgr A* should also affect its accretion. The quiescent X-ray emission from Sgr A* is resolved to have a size of about a couple of arc-seconds. This size corresponds to the Bondi accretion radius of the super-massive black hole. The accretion flow is believed to be responsible for the X-ray emission. Interestingly, the observed spectrum of the emission resembles that of the surrounding diffuse plasma and shows the Fe K line at keV (Fig. 10d; Wang et al. 2006b; Xu et al. 2006). Therefore, the flow is also in an NEI state. A detailed modeling of the flow, confronted with the observed spatial and spectral distributions of the X-ray emission, will help to constrain the accretion dynamics.
The X-ray emission from the GC region is complicated by the presence of a comet-like pulsar wind nebula (PWN), a few arc-seconds northwest of Sgr A* (Fig. 10; Wang et al. 2006b). The suspected pulsar, presumably moving at a high speed relative to the ambient medium, is located at the northern head of the nebula. This PWN interpretation naturally explains not only the morphology, but also the nonthermal spectrum (Fig. 10a) and the spectral steepening with the off-source distance due to the synchrotron cooling of ultra-relativistic electrons (and positrons). Furthermore, the inverse-Compton scattering of the intense ambient infrared photon field by the electrons provides a ready explanation for the TeV emission from the GC (Aharonian et al. 2004). The lack of a synchrotron-emitting radio or infrared counterpart of the PWN is at least partly due to the fast Compton-cooling (hence little accumulation) of relatively low-energy electrons, for which the Klein-Nishina suppression of the inverse-Compton scattering efficiency is not important. The presence of this young pulsar raises a number of questions: where does it originate? and where is the supernova remnant? The most logic origin of the pulsar is the GC cluster itself. But the remnant is more difficult to isolate, the properties of which depend sensitively on the density and temperature structure of the medium (e.g., Tang & Wang 2005). Considering the orbital motion around Sgr A*, it is even possible that the pulsar may be produced together with the well-known SNR Sgr A West, although an alternative pulsar candidate has already been proposed for the remnant (see the contribution by S. Park).
Clearly, the above is a very incomplete and subjective review of recent Chandra results on the GC. We will certainly learn a great deal more from the existing and upcoming Chandra observations before GC-2009 Workshop in China.
Some of the ideas presented above are developed during or after many stimulating discussions with workshop participants, to whom I am grateful. I also thank my collaborators for their contributions to the various research projects mentioned above and the organizers of the workshop for the invitation and the hospitality. This work is supported by NASA through the grant SAO/CXC GO4-5010X.
References
Aharonian, F., et al. 2004, A&AL, 425, 13
Baganoff, F. K., et al. 2001, Nature, 413, 45
Baganoff, F. K., et al. 2003, ApJ, 591, 891
Bandyopadhyay, R. M, et al. 2005, MNRAS, 364, 1195
Cotera, A. S., Colgan, S. W. J., Simpson, J. P., & Rubin, R. H. 2005, ApJ, 622, 333
Eisenhauer, F., et al. 2005, ApJ, 628, 246
Feigelson, E. D., et al. 2005, ApJS, 160, 379
Figer, D. F., Rich, R. M., Kim, S. S., Morris, M., & Serabyn, E. 2004, ApJ, 601, 319
Genzel, R., et al. 2003, ApJ, 594, 812
Handa, T., et al. 2006, ApJ, 636, 261
Law, C., & Yusef-Zadeh, F. 2004, ApJ, 611, 858
Laycock, S., et al. 2005, ApJL, 634, 53
Muno, M. P., et al. 2003, ApJ, 589, 225
Muno, M. P., et al. 2004a, ApJ, 613, 1179
Muno, M. P., et al. 2004b, ApJ, 613, 326
Muno, M. P., et al. 2005, ApJL, 622, 113
Muno, M., Bauer, F. E., Bandyopadhyay, R. M., & Wang, Q. D. 2006, ApJ, in press (astro-ph/0601627)
Nayakshin, S., & Sunyaev, R. 2005, MNRAS, 364, 23
Price, S. D., et al. 2001, ApJ, 121, 2819
Revnivtsev, M. G., et al. 2004, A&AL, 425, 49
Revnivtsev, M. G., et al. 2005, A&A, submitted (astro-ph/0510050)
Rockefeller, G., Fryer, C. L., Melia F., & Wang, Q., D. 2005, ApJ, 623, 171
Ruiter, A. J., Belczynski, K., & Harrison, T. E. 2006, ApJL, 640, 167
Serabyn, E., & Güesten, R. 1987, A&A, 184, 133
Sakano, M., Warwick, R. S., Decourchelle, A., & Wang, Q. D. 2005, MNRAS, 357, 1211
Stolte, A., Grebel, E. K., Brandner, W., & Figer, D. F. 2002, A&A, 394, 45
Stolte, A., Brandner, W., Grebel, E. K., Lenzen, R., & Lagrange, A. 2005, ApJL, 628, 113
Takagi, S., Murakami, H., & Koyama, K. 2002, ApJ, 573, 275
Tang, S. K., & Wang, Q. D. 2005, ApJ, 628, 205
Valinia, A., Tatischeff, V., Arnaud, K., Ebisawa, K., & Ramaty, R. 2000, ApJ, 543, 733
Wang, Q. D., Gotthelf, E. V., & Lang, C., 2002, Nature, 415, 148
Wang, Q. D., Lu, F. J., & Lang, C. C. 2002, ApJ, 581, 1148
Wang, Q. D., Dong, H., & Lang, C. C. 2006a, MNRAS, in press (astro-ph/0606282)
Wang, Q. D., Lu, F. J., & Gotthelf, E. V. 2006b, MNRAS, 367, 937
Wijnands, R., et al. 2006, A&A, 449, 1117
Xu, Y. D., et al. 2006, ApJ, 640, 319
Yuan, F. Quataert, E., & Narayan, R. 2003, ApJ, 598, 301
Yusef-Zadeh, F., et al., 2002a, ApJ, 570, 665
Yusef-Zadeh, F., Law, C., & Wardle, M. 2002b, ApJ, 568, 121