High energy neutrino astronomy using upward-going muons in Super-Kamiokande-I
Abstract
We present the results from several studies used to search for astrophysical sources of high-energy neutrinos using the Super-Kamiokande-I (April 1996 to July 2001) neutrino-induced upward-going muon data. The data set consists of 2359 events with minimum energy 1.6 GeV, of which 1892 are through-going and 467 stop within the detector. The results of several independent analyses are presented, including searches for point sources using directional and temporal information and a search for signatures of cosmic-ray interactions with the interstellar medium in the upward-going muons. No statistically significant evidence for point sources or any diffuse flux from the plane of the galaxy was found, so specific limits on fluxes from likely point sources are calculated. The 90% C.L. upper limits on upward-going muon flux from astronomical sources which are located in the southern hemisphere and always under the horizon for Super-Kamiokande are .
Subject headings:
neutrinos: astrophysics —upward muons: astrophysics1. Introduction
There have been attempts to find extraterrestrial neutrino sources since the first underground experiments to observe cosmic-ray neutrinos (Reines et al., 1965; Achar et al., 1965). Only two such sources have been observed so far, MeV electron neutrinos from the Sun (Davis, 2003; Koshiba, 2003) and from SN1987A (Hirata et al., 1987; Bionta et al., 1987).
At GeV and higher energies, the observational method involves analyzing the arrival directions of neutrino-induced muons traversing underground detectors, since muons over about 1 GeV travel in roughly the same direction as their parent neutrinos. It is desirable to observe as high an energy sample of neutrinos as possible, as not only does this pointing accuracy improve with energy, but astrophysical signals are expected to have harder spectra than atmospheric neutrinos, gaining in signal-to-noise ratio in direct proportion to the energy threshold (Gaisser et al., 1995). Muons above a few GeV cannot be contained in the detector, so we restrict our search to only upward-going muons (UGMs) entering the detector. Such muons may be produced some distance away from the active detector volume, by charged current interactions of muon neutrinos (and anti-neutrinos) in the rock surrounding the detector. The effective volume for such instruments is thus roughly equal to the muon detection area times the range of the muon in the surrounding rock. The combination of these factors means that any astrophysical point source of neutrinos found by this analysis would in the TeV energy range.
Neutrinos may come from either astrophysical sources or cosmic ray interactions with Earth’s atmosphere or the interstellar medium. Atmospheric neutrinos led to the observation of muon neutrino oscillations (Fukuda et al., 1998) but constitute an irreducible background in the search for astrophysical neutrinos. Furthermore, muons produced in the atmosphere penetrate from the surface at rates greater than muons from neutrino interactions in the surrounding rock, even in the deepest of mines. However, this background can be largely removed by considering only muons arriving from below the horizon, which can only be due to neutrino interactions.
Given that cosmic rays are highly accelerated hadrons and neutrinos are produced as decay products of energetic hadron interactions, it follows that substantial neutrino fluxes must exist as well, although with orders of magnitude uncertainty in fluence. Many studies carried out over the last 25 years agree that a detector on the order of muon collection area would be required to see such sources (Learned & Mannheim, 2000) if they are at the lower end of the likely range of fluence. Thus, at the sensitivity level of Super-Kamiokande (“Super-K ”) (about 1200 muon collecting area), the chance to unambiguously identify a source may be relatively small but certainly not negligible. Additionally, bursting, highly beamed like objects such as gamma-ray bursts and blazars or other transient X-ray/-ray sources for which the main mechanism is unknown and neutrino flux predictions are highly uncertain, may produce fluxes of neutrinos detectable by Super-K .
We report on analyses of the first five years of Super-K UGM data, searching for point sources and for diffuse flux from the galactic plane. No significant evidence for high energy neutrino sources has been found. We report upper limits on neutrino-induced UGM fluxes from the directions of known high energy gamma ray sources, which in many cases are lower than those previously set.
2. The Super-Kamiokande Detector
Super-K is a 50 kton ring imaging water Cherenkov detector. Results presented here are derived from the “SK-I” running period, which began when Super-K started taking data in April 1996 and ended when it was shut down for maintenance in July 2001.
The detector is located in the Mozumi mine of the Kamioka Mining and Smelting Company, in Gifu prefecture, Japan, directly underneath the peak of Mt. Ikenoyama with a minimum overburden of 2,700 m water equivalent. Its geodetic location is at 36.4∘ N, 137.3∘ E, and altitude 370 m. When looking at UGMs, Super-K ’s northern location makes it sensitive to source locations on the celestial sphere with declination () less than .
The inner detector volume is a cylinder of radius 16.9 m and height 36.2 m, viewed during SK-I by 11,146 50 cm diameter inward-facing Hamamatsu photo-multiplier tubes (PMTs). Approximately 40% of the inner detector surface area is photo-cathode, with the remainder covered by light-absorbing black plastic. The outer detector volume, completely surrounding and optically isolated from the inner detector, is a layer of water 2.5 m thick viewed by 1,885 outward-facing 20 cm PMTs. A more detailed description of the detector can be found in Fukuda et al. (2003).
By using amplitude and timing information from the PMT signals, muon tracks in the inner detector can be reconstructed with tens of centimeters accuracy for endpoints and a few degrees accuracy for direction, depending upon particle momentum (Fukuda et al., 2003; Desai, 2004; Ashie et al., 2005). The outer detector is used to identify particles entering and exiting the inner detector.
3. Data and Background
3.1. Data
The dataset for these studies consists of all UGMs, both through-going and those that stopped within the inner detector. Contamination from cosmic ray muons prohibits the use of downward-going muons. Events were required to have path length in the detector greater than 7 m (corresponding to a muon energy greater than 1.6 GeV) to ensure good reconstruction accuracy. Parent neutrino energies, as determined by Monte Carlo simulation, are broadly distributed, with peaks around 10 GeV for stopping muons and 100 GeV for through-going muons. Further details on the data filtering and reconstruction may be found elsewhere (Ashie et al., 2005).
Events with deposited energy greater than 1,750,000 equivalent photoelectrons (approximately 200 GeV deposited in the detector) were cut due to the likelihood of phototube saturation. A separate study has been done using those events (Swanson et al., 2006). A based method of tagging higher energy UGMs is discussed in Desai (2004), but is not used in this paper’s analysis.
The total UGM livetime for the SK-I dataset was 1679.59 days, about 87% of calendar time over the whole period. Detector conditions were sufficiently stable throughout the livetime sample that we may assume them constant for this analysis. Also, the exposure was sufficiently constant ( of 75.3/95) in sidereal time to be taken as uniform for this period, as shown in Fig. 1.
The final SK-I UGM data set contains 1892 through-going muons and 467 stopping muons.

3.2. Event Background
In the energy range considered, the non-astrophysical background to our studies is dominated by atmospheric neutrinos. To understand if the Super-K data also contain some small contribution from astrophysical sources, source-free reference data are generated, used to test search methods, and compared with the real data set. Two methods were used: Monte Carlo simulations of atmospheric neutrino events, including detailed simulation of detector effects; and the process of “bootstrapping” the real event data (Simpson & Mayer-Hasselwander, 1986).
In the bootstrap method, simulated event directions are generated by randomly selecting uncorrelated event times and directions from the real event database, and combining these time/direction pairs into a new simulated “event” which will project back to a different point on the sky than either of the real events from with the time and direction were drawn. This procedure is repeated until a statistically adequate sample is obtained. One thousand “fake” sky maps with the same total number of UGMs as the database were generated to obtain the background estimates. Because real event times and directions are used, any systematics due to UGM angular distribution, detector angular acceptance, neutrino oscillation effects, live time variations between sky locations, etc., will be automatically included in the background estimate, while any correlations present in the data will be destroyed. However, given the limited statistics of the real data in any given declination band (shuffling in time only changes the event’s right ascension), these backgrounds can be too granular, introducing non-Poissonian effects.
Analyses that did not employ the bootstrap method instead used Monte Carlo data to simulate the background. In order to compare expected background distributions with the 2359 UGM events observed, 40 years of simulated atmospheric neutrino data (14610.0 equivalent live days) were generated using Monte Carlo techniques (Desai et al., 2004). Because the Monte Carlo events are generated without associated times, random times within the same livetime range as the dataset were assigned to Monte Carlo events to generate fake data samples.
4. Time-Integrated Searches
This section describes searches for possible astrophysical point sources of neutrino-induced UGMs looking just at the integrated data set, to see if there is a steady-state excess of events from some point in the sky. Previously the data were examined for evidence of such an excess from the centers of the Earth, Sun, and Galaxy to set limits on possible WIMP annihilation (Desai et al., 2004). Time-dependent searches are described in § 5.
4.1. Poisson Probability Sky Maps
Several independent studies were performed on the SK-I dataset. The intuitive starting place for a point source search is a simple binned sky map. To generate such a sky map, the portion of the sky visible at Super-K for UGMs (i.e., below about declination) is divided into bins, the number of events in each is then counted and a probability for finding the number of events due to background is generated for each bin. One study used square bins which evenly tiled the visible sky in an igloo pixelisation (Crittenden & Turok, 1998). This size is somewhat smaller than the more optimal half-angle cone discussed in § 4.3, but is the closest size igloo structure able to evenly map onto the sky. This square-bin study was performed four times, with bin center shifts of in right ascension and declination applied to account for potential sources near boundaries.
Another study employed overlapping circular skymap bins, improving the sensitivity to potential sources near bin boundaries and better matching the radial rather than rectangular expected shape of a source distribution. Though better able to avoid the potential effects of bin edges masking a real source, this oversampling by overlapping bins introduces non-Poissonian statistical effects which complicate error estimation.
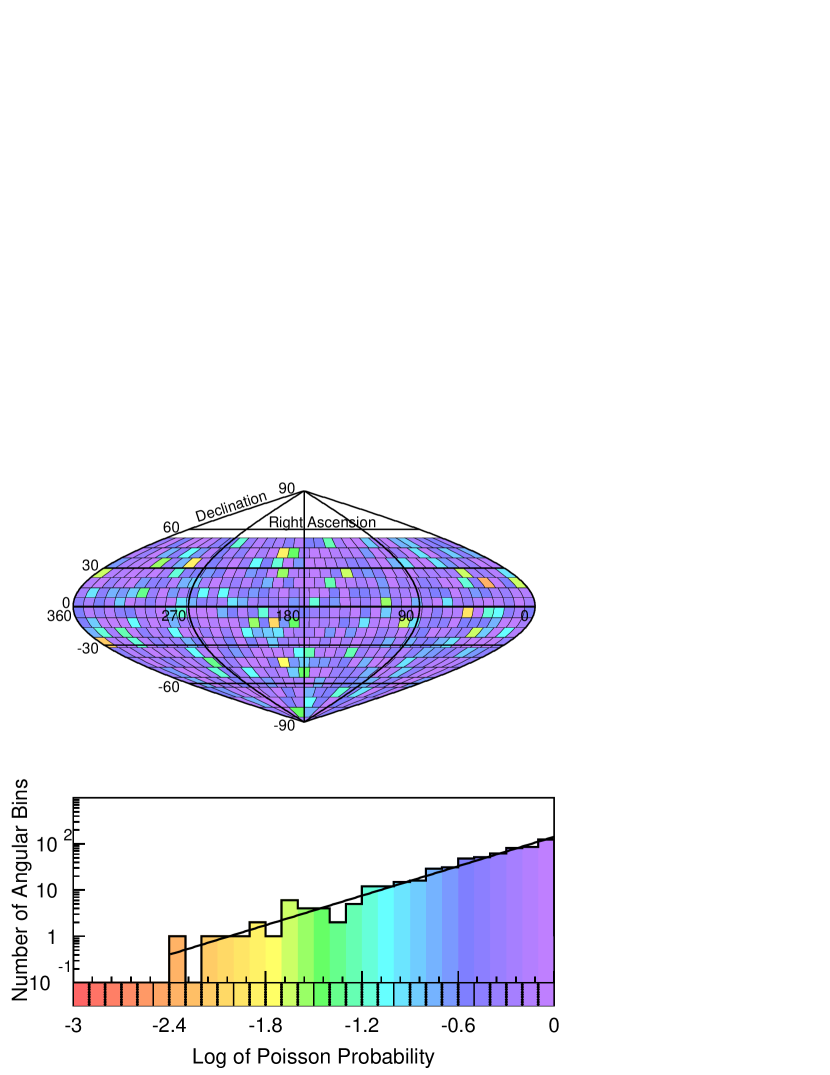
Both the square and circular bin studies used bootstrap estimates of the background noise in each bin. They both produced cumulative Poisson probability sky maps, an example of which is shown in Fig. 2 for one of the square bin searches. A point source would appear here as one or more bins with an anomalously high count relative to Poisson probability. However, in both searches the data were consistent with the expected background, as shown in the histogram of observed Poissonian probabilities in the lower half of the figure. A sample drawn from a Poisson distribution should fit a power law of unit slope. The fit to the observed probability distribution has a slope of , with a reduced 0.83. No significantly improbable bins appeared in any of the sky maps described above.
4.2. Clustering Analysis
Binned searches, such as the sky maps described above, treat the center of each bin as a test direction in which to look for a source, decreasing the sensitivity if a source really lies near a bin boundary. Another approach is to look for statistically significant clustering of events on the sky map in a binning-free way. One such method (Oyama et al., 1989; Ambrosio et al., 2001) involves using each event as a test direction. By examining the number of events in a cone around the test direction and comparing to the distribution produced by the background, one can look for regions of excess without boundary effects.
This cluster-search algorithm was used on the Super-K UGM data. The expected background was calculated by dividing a Monte Carlo data sample equivalent to 40 years of Super-K operation into eight sets of 2359 simulated events to match the size of the actual data set. Using each event as a test direction, the number of events in a cone of half-angle around each test direction were counted. The study was also done with an expanded cone of . The distributions produced by the data show no significant deviation from those produced by the the average of the eight Monte Carlo-generated background estimates, Fig. 3. The search has a comparable solid-angle to the binned all-sky surveys in § 4.1, and the matches the cones used for flux limits in § 4.3.

4.3. Specific Flux Limits
None of the all-sky search methods described previously found a statistically significant excess of neutrino-induced muons over expectation from the atmospheric neutrino background. We thus conclude that Super-K has not detected any sources of astrophysical neutrinos.
Upper limits on the possible astrophysical neutrino-induced muon flux can be then be set for locations on the celestial sphere with . Super-K ’s northern location limits the exposure of the experiment to mainly sources in the Southern hemisphere.
Flux limits have been calculated for a list of high-energy astrophysical objects which have been described in the literature as potential neutrino sources. For convenience of comparison, we started with the same list of sources analyzed by MACRO (Ambrosio et al., 2001). To these we added the catalog of SGR’s (discussed in § 5.1.2) and other potential steady-state sources of TeV neutrinos such as LS5039 (Aharonian et al., 2005), WR20a (Bednarek, 2005), 1ES 1959+650 (Reimer et al., 2005), B1509-58, B1706-44, and B1823-13 (Link & Burgio, 2005). For the flux estimates, UGMs within of the source were selected as the signal. An angular window of contains about 52% of the signal for an atmospheric neutrino spectrum and 92% of the signal for a neutrino spectrum. To evaluate the expected background, we used the atmospheric neutrino Monte-Carlo events. Each Monte Carlo event was assigned a time from that of the observed UGMs, in order to match the livetime distribution of the observed events. Then using this time and observed zenith and azimuthal angle, we can obtain the right ascension and declination for every Monte Carlo event, from which the angular separation between this event and any celestial object can be estimated.
The numbers of signal and background were used to compute a 90% C.L. number of UGMs attributable to a background fluctuation using the procedure described in Caso et al. (1998), and that number was used to compute a flux in as discussed in Fukuda et al. (1999). The results are summarized in Table 1.
4.4. Diffuse Flux from Galactic Plane
Galactic and extra-galactic cosmic rays can interact in with the interstellar medium (ISM) of our galaxy, producing a cascade of high energy particles, including neutrinos. There have been various estimates of this flux in the literature (Stecker, 1979; Berezinsky et al., 1993; Ingelman & Thunman, 1996; Candia, 2005).
The density of hydrogen in our galaxy scales with height approximately as with . Thus, most of the signal would come from the galactic plane. To search for UGMs from cosmic rays interacting with the galactic ISM, we first looked for an excess within around the Galactic plane. Since the flux of ISM-induced neutrinos is expected to be comparable to that of atmospheric neutrinos only at energies above 100 GeV (Ingelman & Thunman, 1996), we performed this search with only upward through-going muons. The galactic latitude distribution of upward through-going muons is shown in Fig. 4. Compared with the same distribution for the Monte Carlo data, there was no statistically significant excess within of galactic latitude of zero degrees. Thus at the 90% CL, after subtraction of expected atmospheric neutrino background, less than 21 upward through-going muons observed at Super-K are from cosmic rays interacting with the ISM. This flux limit is consistent with the predictions from the model by Berezinsky et al. (1993), which when extrapolated to the size of Super-K predicts about 2.3 events. We also note that recently a similar search for high energy neutrinos from the galactic plane has been performed with the AMANDA-II detector (Kelley, 2005).

5. Time-Dependent Searches
In addition to direction, we also have timing information to aid in the search for point sources. This section describes searches for possible astrophysical point sources of neutrino-induced upward going muons which also consider the arrival times of the events in question, to be more sensitive to potentially transient sources than the “DC”-style searches described in § 4. For these searches the timing cut used helps reduce the atmospheric neutrino background, allowing the use of a larger angular cone size ( half-angle) as compared to time-integrated searches in order to maximize any possible signal.
5.1. Triggered space-time correlation searches
If a potential source is known to be transient or come in bursts from electromagnetic observations, the neutrino data can be examined in coincidence with these external “trigger” observations. The SK-I data set has already been searched for time coincidences with BATSE GRB triggers. (Fukuda et al., 2002).
5.1.1 Markarian 501 Space-Time Correlation Study
The flaring episode of Markarian 501 (Weekes, 2000) between February and October of 1997 was used to search for possible time coincidences with the SK-I UGM data. MRK 501 is a BL Lac object and a known TeV -ray source.
A half-angle cone centered on MRK 501 was used to count events recorded during periods of heightened activity, which accounted for 13.5% of SK-I live time. Another 67.5% was logged definitely before or after the flaring event. The remainder of the livetime corresponded to periods when MRK 501 was not observable by air Cherenkov telescopes, so its level of activity could not be determined and was not used in this analysis.
One UGM was observed within this half-angle cone and during the flaring period. The estimated background which was estimated using the Monte-carlo data was 1.6. Given this background, at least seven events would be required in order to claim a signal detection. Therefore, the SK-I dataset provides no evidence for MRK 501 acting as a high-energy neutrino point source during its 1997 gamma ray outbursts.
5.1.2 SGRs Space-Time Correlation Study
Soft Gamma Repeaters (SGRs) are a small class (four confirmed and three tentative candidates) of high energy transient sources which emit bursts of X-rays and gamma-rays with durations lasting from 0.1 to 500 sec, and are located in the galactic plane (Hurley, 2000; Woods & Thompson, 2006). Originally confused with GRBs, their burst properties differ from those of GRBs in two respects: SGR bursts are repetitive, and have a softer spectral energy distribution. On rare occasions, SGRs have also emitted giant flares with hard spectra up to MeV energies. The total photon fluence received at earth varies from to almost . The number of bursts as a function of energy is given by . The currently favored model for burst emission from SGRs (Thompson & Duncan, 1995) is magnetic field decay during crustquakes in neutron stars with G (which are called “magnetar”). The flux of high-energy neutrinos during a giant flare has already been estimated for the SGR 1806-20 flare on December 27, 2004, which was during SK-II (Ioka et al., 2005; Halzen et al., 2005). There are also models for steady-state emission of high energy neutrinos from selected SGRs (Zhang et al., 2003).
We searched the SK-I data for space-time correlations between UGMs and SGR bursts in an analysis similar to that used previously for GRBs (Fukuda et al., 2002). SGR burst times were obtained from the Interplanetary Network (IPN) catalog (K. Hurley, private communication). During SK-I only four SGRs were observed to emit bursts. These are SGR 1806-20 (33 bursts), SGR 1900+14 (67 bursts), SGR 1627-41 (51 bursts), and SGR 1801-23 (2 bursts). We searched for coincidences within a window of day and . For this time window size, the total number of bursts from SGRs occurring in separate time bins was 74. The space-time coincidences found between SGRs and UGMs are shown in Fig. 5.

No coincidences were found from SGR 1806-20, SGR 1627-41 and SGR 1801-23 and SGR 1627-41. One UGM was found within of SGR 1900+14 and within several hours of four bursts starting 1998 May 26, 21:30:29 UT and ending 1998 May 27, 04:22:01 UT. The difference in times between the bursts and the UGM were -3.88, -3.75, 2.08, and 2.97 hours.
The expected background in a day window calculated using the Monte Carlo data is 0.013 events. Given that 74 different SGR bursts were examined, the total background becomes 0.96. Therefore the UGM found coincident with SGR 1900+14 is consistent with the background and not statistically significant.
5.2. Untriggered Searches for Burst Sources
In the space-time correlation studies for UGMs described above, the reported times and sky coordinates of astrophysical photon signals from other detectors were used as triggers to look for correlations in the SK-I neutrino data. We also looked for bursts of UGMs from astrophysical sources independent of photon observations, in order to detect transient sources of high energy neutrinos for which there may be no electromagnetic counterpart. The method used was to regard each observed UGM as a trigger itself, and look for other upward muon events arriving within a time window of one hour and an angular window of .

As we see from Fig. 6, using the entire SK-I dataset, one doublet was found to meet this criteria. Two UGMs separated by arrived within 19 minutes. The projected right ascension and declination for these two events were , ’ and , ’ respectively.
The arrival times of the events were Modified Julian Date = 50927.64412 and 50927.65757, or 1998 April 24, 15:27:32 and 15:46:54 UT.
The expected rate of such coincidences is per UGM. When multiplied by the number of trial factors (number of UGMs minus one), the probability that this doublet comes from a background fluctuation is about 5%, which is not statistically significant. Thus we conclude that we do not see any evidence for bursts of UGMs from an astrophysical source in the SK-I dataset.
6. Summary
Several independent methods for finding astrophysical sources of high energy neutrinos have been applied to the SK-I (1996 to 2001) upward-going muon data using both directional and temporal information. None have uncovered a statistically significant excess above the atmospheric neutrino background as estimated from bootstrapped data and Monte Carlo simulations. Thus, upper limits were set on the upward-going muon flux. The 90% limits from astronomical sources which are located in southern hemisphere and always under the horizon for Super-K are .
References
- Achar et al. (1965) Achar, C.V. et al. 1965, Phys. Lett., 18, 196
- Aharonian et al. (2005) Aharonian, F., Anchordoqui, L., Khangulyan, D., & Montaruli, T. 2005, preprint (astro-ph/0508658)
- Ambrosio et al. (2001) Ambrosio, M. et al., (MACRO Collaboration). 2001, ApJ. 546 1038
- Ashie et al. (2005) Ashie, Y. et al., (Super-K Collaboration). 2005, Phys. Rev. D, 71, 112005.
- Bednarek (2005) Bednarek, W. 2005, MNRAS, 363, L46
- Berezinsky et al. (1993) Berezinsky, V. S., Gaisser, T. K., Halzen, F., & Stanev, T. 1993, Astropart. Phys., 1, 281
- Bionta et al. (1987) Bionta, R .M. et al. 1987, Phys. Rev. Lett., 58, 1494
- Candia (2005) Candia, J. 2005, J. Cosmology Astropart. Phys, 0511, 002
- Caso et al. (1998) Caso, C. et al. 1998, Eur. Phys. J. C3, 1
- Crittenden & Turok (1998) Crittenden, R. G. & Turok, N. G. 1998, preprint (astro-ph/9806374)
- Davis (2003) Davis, Raymond, Jr. 2003, Rev. Mod. Phys., 75, 985 (2003)
- Desai (2004) Desai, S. 2004, Ph.D thesis, Boston Univ.
- Desai et al. (2004) Desai, S. et al., (Super-K Collaboration). 2004, Phys. Rev. D, 70, 083523
- Fukuda et al. (1998) Fukuda, Y. et al., (Super-K Collaboration). 1998, Phys. Rev. Lett., 81, 1562
- Fukuda et al. (1999) Fukuda, Y. et al., (Super-K Collaboration). 1999, Phys. Rev. Lett., 82, 2644
- Fukuda et al. (2002) Fukuda, S. et al., (Super-K Collaboration). 2002, ApJ, 578, 317
- Fukuda et al. (2003) Fukuda, S. et al., (Super-K Collaboration). 2003, Nucl. Instrum. Meth. A501, 418
- Gaisser et al. (1995) Gaisser, T. K., Halzen, F., & Stanev T. 1995, Phys. Rep. 258, 173
- Halzen et al. (2005) Halzen, F., Landsman, H, & Montaruli, T. 2005, preprint (astro-ph/0503348)
- Hirata et al. (1987) Hirata, K .S. et al. 1987, Phys. Rev. Lett., 58, 1490
- Hurley (2000) Hurley, K. 2000, in Gamma-Ray Bursts, 5th Huntsville Symposium, AIP Conf. Proc. 526, ed. R. M. Kippen, R. S. Mallozzi, & G .J. Fishman, 763, (astro-ph/9912061)
- Ingelman & Thunman (1996) Ingelman, G. & Thunman, M. 1996, preprint (hep-ph/9604286)
- Ioka et al. (2005) Ioka, K., Razzaque, S., Kobayashi, S., & Meszaros, P. 2005, ApJ, 633, 1013
- Kelley (2005) Kelley, J.L. (for the IceCube Collaboration). 2005, preprint (astro-ph/05095461)
- Koshiba (2003) Koshiba, M. 2003, Rev. Mod. Phys., 75, 1011
- Learned & Mannheim (2000) Learned, J.G. & Mannheim, K. 2000, Annu. Rev. Nucl. Part. Sci., 50, 679
- Link & Burgio (2005) Link, B. & Burgio, F. 2005, Phys. Rev. Lett., 94, 181101
- Oyama et al. (1989) Oyama, Y. et al. 1989, Phys. Rev. D, 39, 1481
- Reimer et al. (2005) Reimer, A., Boettcher, M., & Postnikov, S. 2005, ApJ, 630, 186
- Reines et al. (1965) Reines, F. et al. 1965, Phys. Rev. Lett., 15, 429
- Simpson & Mayer-Hasselwander (1986) Simpson, G. & Mayer-Hasselwander, H. A&A, 1986, 162, 340
- Stecker (1979) Stecker, F. ApJ, 1979, 228, 919
- Swanson et al. (2006) Swanson, M. et al., (Super-K Collaboration). 2006, preprint (astro-ph/0606126)
- Thompson & Duncan (1995) Thompson, C. & Duncan, R. C. 1995, MNRAS, 275, 255
- Weekes (2000) Weekes, T. 2000, “High Energy Gamma Ray Astronomy: International Symposium”, F. Aharonian, ed., AIP Conference Proceedings 558, p. 15.
- Woods & Thompson (2006) Woods, P.M., & Thompson, C. 2006, in Compact Stellar X-ray Sources, ed. W. H. G. Lewin & M. van der Klis (UK: Cambridge University Press), (astro-ph/0406133)
- Zhang et al. (2003) Zhang, B. et al. 2003, ApJ, 595, 346
| Source | RA | Dec | # events | Bkgnd | flux limits |
|---|---|---|---|---|---|
| (∘) | (∘) | () | |||
| SMC X-1 11X-Ray Binary | 19.3 | -73.4 | 0 | 3.0 | 1.25 |
| LMC X-2 11X-Ray Binary | 80.1 | -72.0 | 5 | 3.1 | 3.49 |
| SN 1987A22SN Remnant | 83.9 | -69.3 | 2 | 3.2 | 1.9 |
| LMC X-411X-Ray Binary | 83.2 | -66.4 | 3 | 3.3 | 2.3 |
| GX301.2 11X-Ray Binary | 186.7 | -62.8 | 5 | 3.5 | 3.35 |
| Cen X-5 11X-Ray Binary | 177.0 | -62.2 | 4 | 3.65 | 2.73 |
| GX 304-1 11X-Ray Binary | 195.3 | -61.6 | 4 | 2.1 | 3.33 |
| Cen X-3 11X-Ray Binary | 170.3 | -60.5 | 0 | 3.2 | 1.27 |
| Cir X-1 11X-Ray Binary | 230.2 | -57.2 | 5 | 3.3 | 3.46 |
| 2U 1637-53 11X-Ray Binary | 250.2 | -53.7 | 3 | 2.9 | 1.99 |
| 4U 1608-522 11X-Ray Binary | 243.2 | -52.4 | 5 | 3.6 | 3.10 |
| GX 339.4 11X-Ray Binary | 255.7 | -48.8 | 1 | 2.4 | 2.02 |
| Vela 33Pulsar | 128.8 | -45.2 | 1 | 2.7 | 1.77 |
| GX 346-7 11X-Ray Binary | 264.7 | -44.4 | 4 | 2.4 | 4.29 |
| AR X-1 0 11X-Ray Binary | 256.6 | -43.0 | 2 | 2.9 | 2.66 |
| SN 1006 22SN Remnant | 225.7 | -41.9 | 3 | 2.4 | 3.65 |
| Vela X-1 11X-Ray Binary | 135.5 | -40.6 | 2 | 1.7 | 3.23 |
| 2U 1700-37 44Emission Line Star | 226.0 | -37.8 | 0 | 2.6 | 1.90 |
| SGR X-4 11X-Ray Binary | 275.9 | -30.4 | 4 | 2.0 | 4.44 |
| L10 55Dark Nebula | 269.4 | -30.1 | 3 | 2.0 | 4.41 |
| GX 1+4 11X-Ray Binary | 263.0 | -24.7 | 2 | 1.5 | 2.89 |
| SN 1604 22SN Remnant | 262.7 | -21.4 | 3 | 1.8 | 3.79 |
| GX 9.9 11X-Ray Binary | 262.9 | -17.0 | 2 | 1.6 | 4.00 |
| Sco X-1 11X-Ray Binary | 245.0 | -15.6 | 3 | 1.25 | 5.43 |
| Aqr X-1 66Cataclysmic binary | 310.0 | -0.9 | 0 | 1.7 | 2.5 |
| 4U 336+01 11X-Ray Binary | 54.2 | 0.6 | 2 | 1.5 | 4.54 |
| Aql X-1 11X-Ray Binary | 287.8 | 0.6 | 0 | 1.7 | 2.53 |
| 2U 1907+02 77Symbiotic Star | 286.8 | 2.3 | 1 | 1.9 | 3.35 |
| Ser X-1 11X-Ray Binary | 280.0 | 5.0 | 3 | 1.6 | 4.61 |
| SS433 44Emission Line Star | 287.9 | 5.0 | 2 | 1.5 | 3.52 |
| 2U 0613+09 11X-Ray Binary | 93.4 | 9.1 | 0 | 1.3 | 2.7 |
| Geminga 33Pulsar | 98.4 | 17.8 | 0 | 1.3 | 2.94 |
| Crab 33Pulsar | 83.6 | 22.0 | 0 | 2.0 | 3.09 |
| 2U 035+30 11X-Ray Binary | 58.8 | 31.0 | 3 | 1.1 | 6.78 |
| Cyg X-1 11X-Ray Binary | 299.5 | 35.2 | 3 | 1.6 | 6.84 |
| Her X-1 11X-Ray Binary | 254.4 | 35.3 | 2 | 1.5 | 6.94 |
| Mrk 421 88Blazar | 166.11 | 38.2 | 2 | 1.0 | 5.98 |
| Cyg X-2 11X-Ray Binary | 326.2 | 38.3 | 2 | 0.8 | 6.07 |
| Mrk 501 88Blazar | 253.5 | 39.8 | 0 | 1.0 | 4.39 |
| Cyg X-3 99Wolf-Rayet Star | 308.1 | 40.9 | 1 | 0.8 | 6.66 |
| Per X-1 1010Cluster | 49.6 | 41.5 | 0 | 1.2 | 4.66 |
| SGR 1806 1111SGR | 271.5 | -20.41 | 1 | 2.3 | 2.82 |
| SGR 1900 1111SGR | 286.8 | 9.3 | 1 | 1.6 | 3.62 |
| SGR 1627 1111SGR | 246.8 | -41.0 | 2 | 1.9 | 3.11 |
| SGR 1801 1111SGR | 270.3 | -23.0 | 1 | 2.2 | 2.78 |
| SGR 0525 1111SGR | 81.2 | -66.0 | 5 | 2.75 | 3.64 |
| LS 5039 11X-Ray Binary | 276.5 | -14.8 | 1 | 1.2 | 3.18 |
| WR 20a 99Wolf-Rayet Star | 156 | -57.8 | 3 | 2.7 | 2.51 |
| 1ES 1959+650 1111SGR | 300 | 6.8 | 3 | 1.3 | 6.31 |
| B1509-58 33Pulsar | 227.2 | -58 | 6 | 2.8 | 3.67 |
| B1706-44 33Pulsar | 257.2 | -44.5 | 1 | 2.9 | 2.14 |
| B1823-13 33Pulsar | 275.6 | -13.2 | 3 | 1.35 | 5.43 |