The Evolution of the ISM in the Mildly Disturbed Spiral Galaxy NGC 4647
Abstract
We present matched-resolution maps of HI and CO emission in the Virgo Cluster spiral NGC 4647. The galaxy shows a mild kinematic disturbance in which one side of the rotation curve flattens but the other side continues to rise. This kinematic asymmetry is coupled with a dramatic asymmetry in the molecular gas distribution but not in the atomic gas. An analysis of the gas column densities and the interstellar pressure suggests that the /HI surface density ratio on the east side of the galaxy is three times higher than expected from the hydrostatic pressure contributed by the mass of the stellar disk. We discuss the probable effects of ram pressure, gravitational interactions, and asymmetric potentials on the interstellar medium and suggest it is likely that a perturbation in the gravitational potential could be responsible for all of the galaxy’s features. Kinematic disturbances of the type seen here are common, but the curious thing about NGC 4647 is that the molecular distribution appears more disturbed than the HI distribution. Thus it is the combination of the two gas phases that provides such interesting insight into the galaxy’s history and into models of the interstellar medium.
Subject headings:
galaxies: individual (NGC 4647) — galaxies: spiral — galaxies: ISM — galaxies: kinematics and dynamics — galaxies: evolution — ISM: molecules1. Introduction
Galaxies that are rich in cold gas tend to have roughly equal amounts of gas in the atomic and in the molecular phase. But, to the best of our knowledge, star formation only occurs in the molecular phase. Therefore, the global balance between atomic and molecular gas is crucial to the long-term evolution of galaxies and their stellar populations. What determines the balance between atomic and molecular gas in a galaxy, and how does that balance evolve as the environment of the galaxy changes?
On theoretical grounds we would expect that the density and temperature of the gas, the strength of the dissociating UV field, and the metallicity all affect the relative amounts of molecular and atomic gas (Hidaka & Sofue, 2002; Elmegreen, 1993). The gas should also be in hydrostatic equilibrium with a pressure that is mostly determined by the stellar distribution, since stars contribute the bulk of the mass in the inner parts of galaxies where the —HI transition occurs.
If a galaxy is disturbed by gravitational interactions or by falling into an intracluster medium, the balance between atomic and molecular gas may be altered. Indeed, Miller & Owen (2003) and Miller, Owen, & Hill (2003) observe increased star formation activity in the members of a galaxy group or subcluster that recently merged into a larger cluster. In a bottom-up (cold dark matter) cosmology such disturbances should be common, and they may be important both to the star formation histories and the morphological evolution of galaxies. In turn, the disturbances and asymmetries in galaxies can inform our understanding of cosmology as they allow us to place constraints on the merger/interaction rate.
The semi-analytic simulations of galaxy formation (e.g. Somerville & Primack (1999); Kauffmann et al. (1993) and successors) are attempts to understand the observed properties of galaxies by predicting their star formation histories in a cosmological context. To this end the semi-analytic simulations typically assume that the star formation rate can be calculated from empirically motivated recipes involving the gas content and the recent merger history. However, these empirical recipes may not capture important phases of galaxy evolution. Thus it is desirable to have a more physically motivated understanding of the interstellar medium (ISM) and star formation that can be applied to both semi-empirical studies and future detailed N-body/hydrodynamic simulations.
Krumholz & McKee (2005) have recently put together a detailed model for the star formation rate in galaxies. They begin with the molecular cloud microphysics, in which fractal turbulence drives a small fraction of the gas to high enough density that it collapses to form stars. They extend the physics to galaxy-wide scales by then considering the molecular clouds as gravitationally bound entities formed in a disk that is marginally stable against gravitational collapse using the Toomre criterion (Toomre, 1964; Binney & Tremaine, 1987). We note that this model still depends critically on knowing how much of the gas disk is in molecular form and how much is atomic. In the absence of observations, that information must be obtained from a hypothesis such as that of Blitz & Rosolowsky (2004), which predicts atomic and molecular column density ratios as a function of the midplane hydrostatic pressure in a disk. Future work on simulations of galaxy evolution could be made more realistic by incorporation of such physically-based models of a multiple-phase ISM and its effects on the star formation rate.
Our current contribution to this effort is an observational study that begins to test such physical models on a gently disturbed galaxy. We present an analysis of the kinematics of the neutral interstellar medium in the Virgo Cluster spiral NGC 4647, along with an analysis of the relationships between atomic gas, molecular gas, and star formation in the galaxy. We investigate whether the observed molecular/atomic balance and the disturbed kinematics can be understood in the context of the galaxy’s environment. The form and magnitude of the kinematic disturbance in NGC 4647 are common, so the processes affecting this galaxy might be applicable to many spirals. However, few mildly disturbed spiral galaxies have been mapped at matching resolutions in both atomic and molecular gas, so opportunities for this type of analysis are rare.
2. Meet NGC 4647
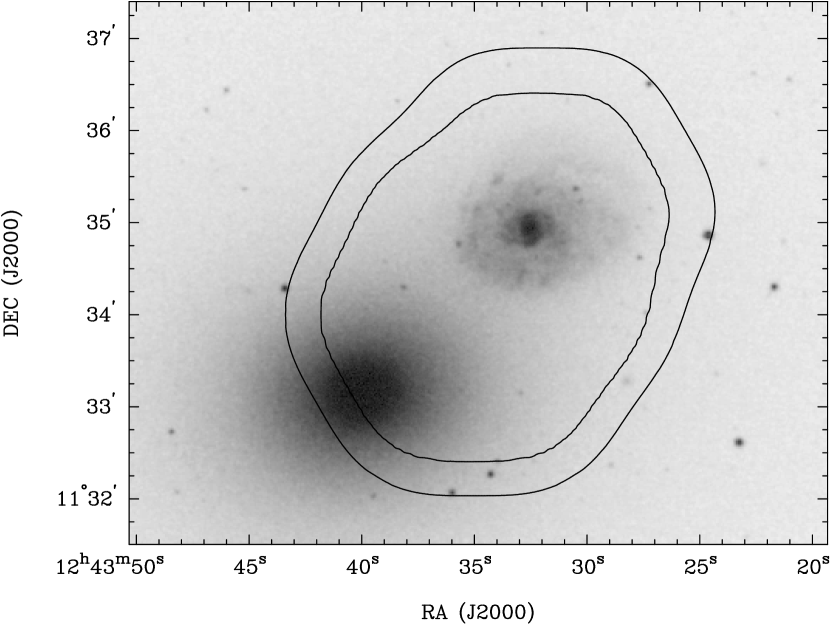
NGC 4647 is a gas-rich Virgo Cluster spiral whose interstellar medium has been gently disturbed and whose surroundings suggest some possible causes of the disturbance. It is 3.2° = 0.95 Mpc in projection from M87. The galaxy’s distance has been estimated via the Tully-Fisher method to be Mpc (Gavazzi et al., 1999), so that it is close to the midplane of the Virgo Cluster. It is also notable for being in a close pair with the elliptical galaxy NGC 4649 (M60); the two are 2.6′ apart or 13 kpc in projection (Figure 1). The galaxies are close in radial velocity as well, with NGC 4647 at 1415 4 km s-1 and NGC 4649 at 1114 17 km s-1 (de Vaucouleurs et al., 1991). Surface brightness fluctuations give the distance to NGC 4649 to be 16.8 1.2 (random) 1.2 (systematic) Mpc (Tonry et al., 2001), so this independent distance measurement is also consistent with the two galaxies being physically close to each other. We therefore adopt a distance of 17 Mpc to both galaxies and entertain the possibility that they are gravitationally interacting.
The location of NGC 4647 in the midst of the Virgo Cluster also suggests that the galaxy may have suffered ram pressure stripping by the intracluster medium. The galaxy is mildly HI-deficient; according to Kenney & Young (1989) the HI mass is a factor of 3 lower than what one would expect for an isolated galaxy of the same optical diameter. This deficiency is very typical of late-type spirals that are 3° in projection from M87. The molecular/atomic mass ratio is also typical for galaxies of the same HI deficiency (Kenney & Young, 1989).
The stellar distribution of NGC 4647 (traced by an R-band image) and H emission are both modestly asymmetric, with an enhancement in H surface brightness at the outer edge of the star-forming disk on the side closer to NGC 4649 (Koopmann & Kenney, 2004). Here we look in greater detail at the gas distribution and kinematics to search for clues to the processes responsible for disturbing the ISM in NGC 4647.
3. Observations and Data Reduction
3.1. CO imaging
12CO 1-0 emission from the NGC 4647–4649 system was imaged with the 10-element Berkeley-Illinois-Maryland Association (BIMA) millimeter interferometer at Hat Creek, CA (Welch et al., 1996). The BIMA observations were carried out in the D configuration (projected baselines 2.3 to 11 k) for a total of 5.5 hours on 2001 June 15, 4.25 hours on 2003 June 8, and 2 hours on 2003 June 28. Observations were made in mosaic mode using a hexagonal grid of 7 pointings with center-to-center separations of 60″. The 2001 observations were made with a pointing center of 12h43m35.0s, +11°34′00″(J2000), and the 2003 observations were made with a pointing center of 12h43m32.0s, +11°35′07″. This coverage was designed to give sensitivity to CO emission throughout the disk of NGC 4647 as well as in the region between the two galaxies and the central regions of NGC 4649. Sage & Wrobel (1989) reported a single-dish CO detection of the elliptical NGC 4649, so the mosaic observations were partly designed to investigate those claims. Figure 1 shows the field of view of these data. The velocity range covered by the CO data is 888 to 1897 km s-1.
Reduction of the BIMA data was carried out using standard tasks in the MIRIAD package (Sault, Teuben, & Wright, 1995). Absolute flux calibration was obtained from observations of Saturn and the secondary flux calibrator 3C273. Phase drifts as a function of time were corrected by means of a nearby calibrator observed every 30 to 40 minutes. Gain variations as a function of frequency were corrected by the online passband calibration system; inspection of the data for 3C273 indicate that residual passband variations are on the order of 10% or less in amplitude and 2° in phase across the entire band.
The calibrated visibility data were weighted by the inverse square of the system temperature, then Fourier transformed. The MIRIAD task invert performs an appropriately weighted linear combination of the data from the different pointings. No continuum emission was evident in the line-free channels, so no attempt at continuum subtraction was made. The dirty images were deconvolved using both the Clark clean algorithm and a maximum entropy algorithm, but the two methods gave indistinguishable results. The resulting image cube’s resolutions and noise levels are given in Table 1. Integrated intensity images were produced by the masking method: the deconvolved image cube was smoothed along both spatial and velocity axes, and the smoothed cube was clipped at about 2.5 in absolute value. The clipped version of the cube was used as a mask to define a three-dimensional volume in which the emission is integrated over velocity. This masking method for producing moment maps is described in greater detail by Wong (2001) and by Regan et al. (2001). Integrating the “moment zero” image again over the spatial directions then gives the total CO flux of the galaxy. In addition, a velocity field is constructed by fitting a Gaussian line profile to the CO spectrum at each position within the galaxy.
The total CO flux we measure from NGC 4647 is 450 with an uncertainty of 10–15% from absolute calibration; it is consistent with the previous single-dish measurement. Kenney & Young (1988) used the FCRAO telescope, with a beam FWHM of 45″, and they quote a total flux of 600120 . Within the error bars, these two measurements agree. It is important to note, however, that the flux quoted by Kenney & Young (1988) has been multiplied up by a factor of 1.5 to account for “unobserved” gas. This correction factor is an educated guess of how much emission was not sampled by their 5 pointings (spaced by the FWHM) along the galaxy’s optical major axis. We can make a more accurate comparison of the fluxes by convolving our integrated intensity map with a 45″ Gaussian, mimicking the sensitivity pattern of the FCRAO telescope. When this is done, we predict that the FCRAO telescope should measure 212 from the central position on the galaxy. This estimate is in excellent agreement with the measured value of 219 35 . We conclude that the BIMA interferometer has not missed any substantial component of CO flux from NGC 4647. For 17 Mpc distance and a CO-to-H2 conversion factor of 2.0 molecules cm-2 (K km s-1)-1 the mass is then . The mass of helium can be included by multiplying up by a factor of 1.36.
3.2. HI imaging
HI emission from NGC 4647 was observed with the National Radio Astronomy Observatory’s Very Large Array (VLA)111The National Radio Astronomy Observatory is operated by Associated Universities, Inc., under cooperative agreement with the National Science Foundation. in its D and C configurations on 2002 January 4 and 2002 December 2 and 7. We obtained 3.7 hours on source in the D configuration and 7.2 hours on source in the C configuration. The system was observed with one pointing centered in between the two galaxies. The initial D configuration observations were made with a wide bandwidth, 6.25 MHz, in order to cover the velocities of both NGC 4647 and NGC 4649; imaging of these data revealed that all of the HI emission from the system was coming from NGC 4647. Subsequent C configuration observations were made with a smaller 3.125 MHz bandwidth (centered on the velocity of NGC 4647) and higher velocity resolution. A nearby point source was observed every 30 to 45 minutes as a phase calibrator. The absolute flux scale was set by observations of J1331+305 and bandpass calibration was determined from the same source. All data calibration and image formation was done using standard calibration tasks in the AIPS package. Initial imaging revealed which channel ranges were free of HI line emission. Continuum emission was subtracted directly from the raw uv-data by making first order fits to the line-free channels.
The calibrated data were Fourier transformed using several different uvdata weighting schemes chosen to enhance the spatial resolution or the sensitivity to large-scale structures. A low resolution HI image was made covering the entire 6.25 MHz bandwidth using the D configuration data alone and the “natural” uv weighting scheme (all data points are assigned equal weight). A medium resolution HI image was made by combining all the C and D configuration data with natural weighting. The highest resolution HI image uses the C configuration data alone and Briggs’s robust weighting scheme (Briggs, Schwab, & Sramek, 1999), as implemented in the AIPS task IMAGR with a robustness parameter 0.3. Final images’ resolutions and sensitivities are given in Table 1. Dirty images were cleaned down to a residual level of approximately 1.0 times the rms noise fluctuations. Integrated intensity (moment) maps and velocity fields were made in a similar manner as for the CO images.
| CO | HI: high res | HI: med res | HI: low res | |
|---|---|---|---|---|
| Velocity range, km s-1 | 898 – 1897 | 1093 – 1738 | 1093 – 1738 | 626 – 1914 |
| Velocity resolution, km s-1 | 10.09 | 10.4 | 20.8 | 20.8 |
| Beam size, ″ | 14.79 13.38 | 15.63 13.55 | 36.00 30.69 | 45.75 43.75 |
| Beam position angle, ∘ | 14.3 | |||
| Linear resolution, kpc | 1.2 1.1 | 1.3 1.1 | 3.0 2.5 | 3.8 3.6 |
| rms noise, | 100 | 0.35 | 0.18 | 0.43 |
| N(HI) sensitivity, cm-2 | 5.7 | 1.1 | 1.5 | |
| N(H2) sensitivity, cm-2 | 2.8 |
Note. — All velocities in this paper are in a heliocentric system using the optical definition. The distance to NGC 4647 is taken to be 17 Mpc. Column density sensitivities are 3 in one channel; the limit assumes a CO-to-H2 conversion factor of 2.0 molecules cm-2 per K km s-1 of brightness temperature in 12CO 1-0.
The highest sensitivity HI cube (medium resolution, combined C+D configurations) contains a total of 7.0 0.1 of HI emission from NGC 4647. The uncertainty in this value comes from a spread among different techniques for making the integrated intensity image and from different sum regions. The lowest resolution HI cube gives an integrated flux of 6.9 , consistent with the above. The highest resolution HI cube also gives a flux consistent with the above (7.1 0.3 ). Accounting for uncertainty in the absolute flux calibration, we derive a total flux of 7.0 0.2 of HI from NGC 4647. At 17 Mpc, this flux corresponds to of HI.
Helou, Hoffman & Salpeter (1984) measured the HI flux of NGC 4647 with the Arecibo telescope and found 8.2 with an error of 10% to 20% (not including absolute calibration uncertainty). Warmels (1988) used the WSRT to measure a total HI flux of 6.6 with an error of 15% to 20%. Earlier D configuration VLA observations of NGC 4647 are reported by Cayatte et al. (1990), who claim an HI flux of 10.10 0.44 . It is not clear why the 1983 VLA dataset would give such a different flux from the current data, but we note that our present observations have about 5 times better sensitivity than those 1983 data when measured at the same spatial resolution. Thus, we believe that our new VLA map has recovered all of the HI emission from the galaxy; it is significant to note that even the highest resolution HI cube still detects all of the HI emission. Figure 2 shows the integrated HI and CO spectra of NGC 4647.
4. Results
4.1. HI distribution
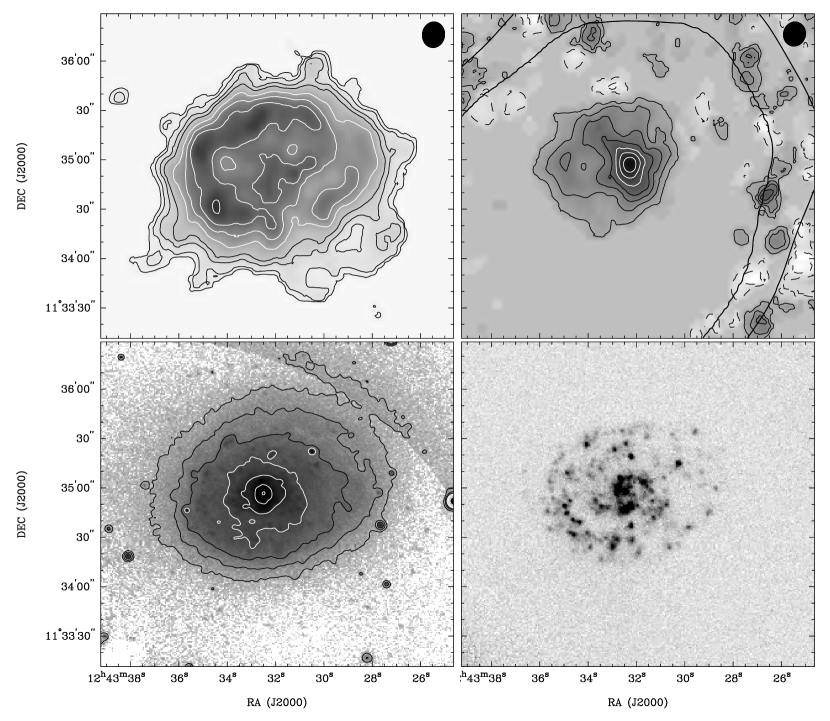
Figure 3 shows the HI column density in NGC 4647 along with images of the CO intensity, an R-band image, and continuum-subtracted H, all at the same linear scale. We have also computed the radial distribution of HI in NGC 4647 from azimuthal averages over elliptical annuli in the approaching and receding halves of the galaxy (Figure 4). “Approaching” and “receding” are defined with respect to the adopted center of the galaxy and the kinematic major axis that are described in Section 4.3 below.
The HI column density in NGC 4647 is relatively flat at 7.5 in the interior of the galaxy. (Gas surface densities quoted in in this paper are corrected to face-on and include a factor of 1.36 for helium; column densities in are as observed.) One notable feature of the HI distribution is an arm or segment of a ring with enhanced column densities at radii of 30–45″ = 2.5 to 3.7 kpc on the east side of the galaxy. HI column densities are 10% to 20% higher in the arm than in the central plateau; the highest HI column densities in the galaxy are here. While the arm is strongest on the east and north sides of the galaxy, it is weak or nonexistent on the western side. Beyond the arm, on the north and east sides of the galaxy, the HI column density declines steeply; it falls below 1.25 at a radius of 67″ (5.5 kpc), just a little over one FWHM beyond the ridge of the arm.
The second notable feature of the HI distribution in NGC 4647 is a very shallow dropoff in column density toward the southwest. There is no well defined ridge or arm on this side, and whereas the HI extends to 67″ on the northeast side of the galaxy it peters out to 90″ (7.4 kpc) on the southwest side. Both radii are measured at the same 1.25 in the data cube with 15″ resolution. At low resolution (45″), the HI column density drops below the sensitivity limit of at 130″ (10.7 kpc) radius on the southwest side; however, there is relatively little HI at radii beyond 90″ since the low resolution map does not contain any more flux than the high resolution map (Section 3.2). The larger HI extent on one side is reminiscent of the asymmetric HI in M101 (Baldwin, Lynden-Bell, & Sancisi, 1980). Curiously, though, the southwest side of NGC 4647 has the shallowest HI gradient but this is also the side with the steepest decline in CO intensity (Section 4.2).
In the earlier map of NGC 4647 by Cayatte et al. (1990), the HI appeared to be slightly extended in the direction of NGC 4649. Those authors suggested that this extension could be caused by gas transfer from NGC 4647 to NGC 4649, possibly fueling the nuclear activity in NGC 4649. Our present images show no sign of any HI extension towards NGC 4649, so we conclude that we are not presently observing gas transfer from the spiral to the elliptical.
4.2. CO distribution
The major features of the molecular distribution in NGC 4647 are a large concentration near the center of the galaxy, a plateau on the east and a steep radial dropoff to the southwest (Figures 3 and 5).
The central molecular clump is poorly resolved by these 15″ data, but thirty percent (4.1 , including helium) of the molecular mass of the galaxy is found within 15″ of the central peak. At this radius the average circular velocity of the two sides of the galaxy is 77 km s-1 (Section 4.3), so the implied dynamical mass is 1.7 or only four times the mass of the molecular concentration. The central molecular clump thus makes a non-negligible contribution to the dynamics in the interior of the galaxy. The molecular peak is also 3″ (250 pc) west of the -band nucleus, and this offset may have important consequences for the gas kinematics in the nuclear regions.
The eastern half of the galaxy shows an extended molecular disk that is coincident with the ring or arm segment seen in HI. While the atomic gas shows a 20% enhancement in column density from one side to the other at this 40″ radius, the molecular gas shows a much stronger enhancement. Molecular surface densities (corrected to face-on and including helium) are 30 M⊙ pc-2 in the arm/ring and are a factor of two to three smaller on the west side (Figure 5). Thus the CO emission is strongly asymmetric and extends twice as far from the galaxy center on the eastern side as on the western side.
Because of the asymmetry in the CO distribution, the western side of the galaxy shows a gradual decrease in atomic gas surface density but a very sharp cutoff in molecular surface density. The molecular distribution of the galaxy then appears to have an edge at a position angle of roughly . This cutoff also makes itself visible in the spectra (Figure 2), where it is plain that the CO does not extend far enough on the low velocity side of the galaxy to sample the flat part of the rotation curve. The HI spectrum shows both “horns” but the CO spectrum shows only one horn.
Star formation activity in NGC 4647 roughly follows the CO surface brightness. H intensities are highest in the nucleus of the galaxy, on the central CO clump, and are lowest on the western side where there is little molecular gas (Figure 3). A few small HII regions on the western side suggest that there is probably a modest amount of molecular gas there but when averaged over the 15″ beam size it is below our sensitivity limits. We also estimate the star formation efficiency (SFE) in the molecular gas by convolving the continuum-subtracted H image to the same resolution as the CO image and dividing the two. By this measure the SFE is not significantly different on the two sides of the galaxy (at least over the regions where molecular gas is detected). The SFE in the galaxy nucleus is also comparable to that in the disk, but the southeast quarter of the galaxy has a SFE a factor of two to three higher than the northeast quarter. Local molecular peaks in the arm of the galaxy tend to occur in between HII regions, when measured on the scale of our CO resolution (1.2 kpc). It would undoubtedly be useful to investigate possible effects of extinction on the H surface brightness through FIR or radio continuum images.
4.3. Gas Kinematics
4.3.1 Asymmetry
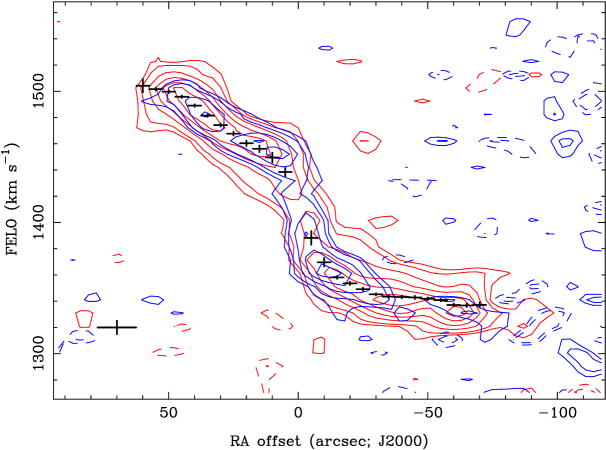
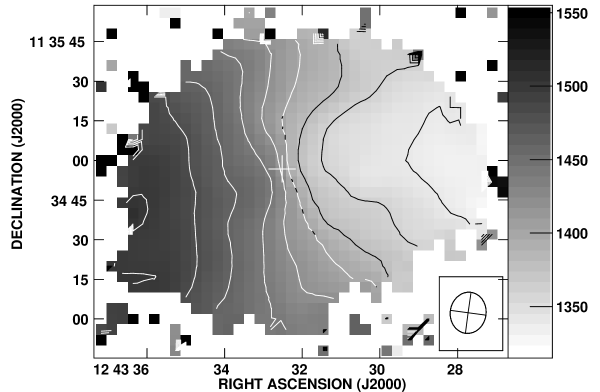
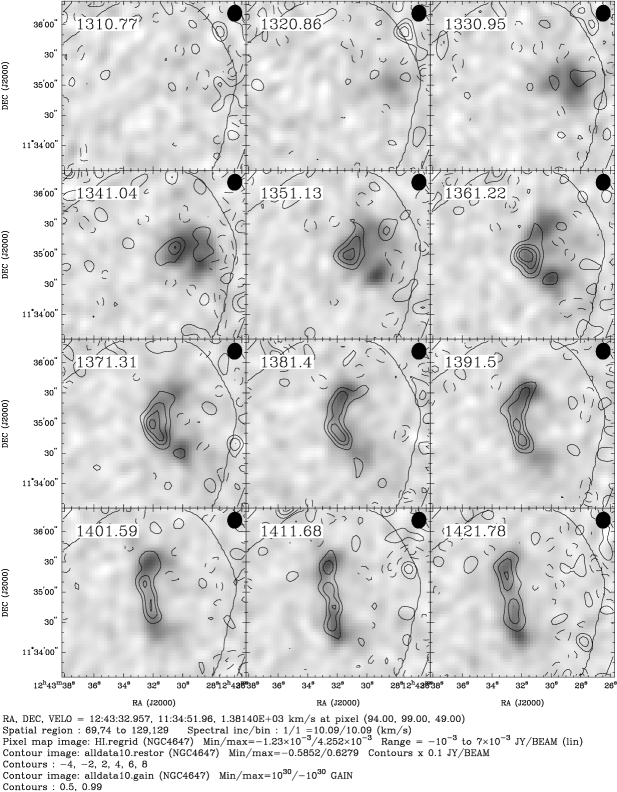
The atomic gas in NGC 4647 shows a striking asymmetry in its kinematics (Figure 6). In the western (approaching) half, the side more distant from NGC 4649, the rotation curve rises quickly and flattens, giving a typical spider-diagram pattern with isovelocity contours that bend toward the major axis. However, on the eastern side of the galaxy the velocity contours are much straighter and more suggestive of a linearly rising rotation curve. This pattern is also evident in the individual channel maps (Figure 7), which show the bent butterfly-wing structures on the west side of the galaxy but linear features in the east. Similarly, the major axis position-velocity diagram (Figure 8) shows that the west side rotation curve (RA offsets ) flattens whereas the east side kinks at a radius of 10″ and continues to rise.
4.3.2 Kinematic parameters
Analysis of the HI velocity field allows us to estimate the important kinematic parameters of NGC 4647 and to quantify the kinematic asymmetries discussed above. We carried out a set of tilted ring fits with the rotcur task in the GIPSY software package, according to the method described by Begeman (1989) and summarized by Swaters et al. (1999).
We first determine the position of the optical nucleus in NGC 4647 and compare that to the kinematic center of the galaxy. Ecliptic coordinates were transferred from a POSSII Digitized Sky Survey plate to the nearly-Mould-R image of Koopmann, Kenney, & Young (2001) using seven stars distributed uniformly around NGC 4647 and NGC 4649. The position of the galaxy nucleus in this image is 12h 43m 32.58s, +11° 34′ 56.8″ (epoch J2000) with an uncertainty of half a pixel (0.4″). A kinematic center is determined by first fitting all annular rings in the galaxy with all of their parameters (center, position angle, inclination, velocity) left free, and the average of all of the fitted centers gives a kinematic center position only 2.5″ away from the optical position. Additionally, a very simple fit of an inclined disk with a rotation curve (as encoded in the AIPS task GAL) gives a kinematic center 4″ away from the optical nucleus. As the resolution of the radio data is 15″, we consider the kinematic centers to be consistent with the position of the optical nucleus and we adopt the latter for the dynamical center of the galaxy.
Subsequent tilted ring fits with fixed centers show significant trends in the systemic velocity from 1407 km s-1 at radii less than 20″ to 1425 km s-1 at 60–80″. We attribute this trend to the asymmetry in the velocity field – more specifically, to the fact that the approaching side rotation curve flattens whereas the receding side rotation curve keeps rising. A value of 1410 km s-1 is adopted for the systemic velocity since it minimizes the differences between the two sides at radii .
The kinematic position angle of the galaxy is significantly better constrained than the systemic velocity. Tilted ring fits for position angle (with kinematic center fixed as described above) give position angles 98°– 99°, and no trend with radius. We also fit the model exponential velocity field to receding and approaching sides independently and find that both sides of the galaxy give angles consistent with the tilted ring fits. We take the position angle of the kinematic major axis to be 98.5° 0.5°, where the uncertainty indicates the dispersion between various fits. Note, however, that this position angle is significantly different from that adopted by Rubin et al. (1999) for longslit H kinematics, which was 124°. It is now clear that the reason NGC 4647 appears to show minor axis rotation in the work of Rubin et al. (1999) is that their adopted kinematic minor axis is 30° offset from the true orientation– we observe no minor axis rotation when the proper kinematic position angles are used.
The kinematic major axis obtained from the HI velocity field is in good agreement with the near-IR morphological major axis. We obtained the Two Micron All-Sky Survey (2MASS) K-band image of the NGC 4649-4647 system, masked out NGC 4647, and used the Multi-Gaussian Expansion routines of Cappellari (2002) to model NGC 4649 and remove it. In subsequent MGE fits of NGC 4647 itself and isophote fits using the ELLIPSE routine in STSDAS, we find the isophotal major axis position angles between 97.6° and 100.7°.
The receding half of the galaxy, with its almost linear isovelocity contours, gives very poor constraints on the inclination of the disk. Therefore the best information on the inclination comes from fits to the approaching half alone, with fixed center and position angle. Tilted ring fits are consistent with the fit of the simple exponential velocity field and both give inclinations 39.3° 1.8°. The value is also consistent with the inclination adopted by Rubin et al. (1999) as determined from optical isophotes. Figure 9 shows the final rotation curve derived from the tilted ring fits, where the receding and approaching sides were fit independently (weighted by the square of the cosine of the angle to the kinematic major axis).
The magnitude and spatial distribution of the kinematic asymmetry in NGC 4647 can be estimated by taking the rotation curve derived from the approaching (flatter) side alone, constructing a model velocity field, and subtracting from the observed velocity field. The residual velocities are on the order of 20 km s-1 at on the east side of the galaxy. If these residual velocities arise in tangential motions in the plane of the disk, then correcting for inclination gives a 30 km s-1 velocity difference from one side of the galaxy to the other (compared to a circular speed of 115 km s-1).
4.3.3 Atomic vs. Molecular and Ionized Gas Kinematics
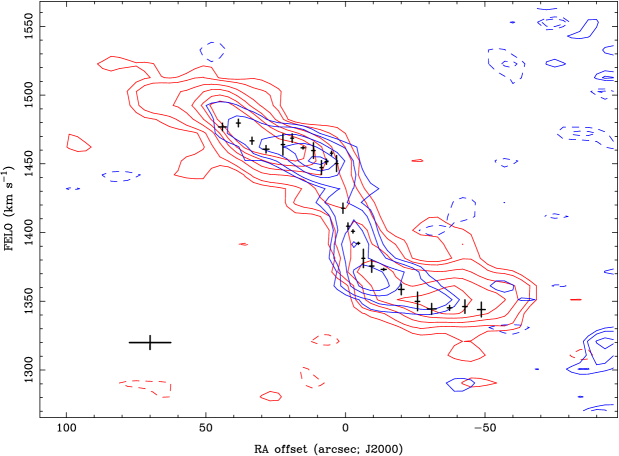
Molecular and ionized gas kinematics in NGC 4647 agree well with the atomic gas. For example, aside from the fact that the CO is more centrally concentrated than HI and does not extend as far as HI on the western side, the channel maps in Figure 7 are nearly identical in CO and HI. The position-velocity diagrams in Figures 8 and 10 also show good agreement between HI, CO, and H kinematics.
There is one notable difference between molecular and atomic gas kinematics: Figure 8 shows that at radii between 10″ and 30″ on both sides of the nucleus the HI line profiles are asymmetric. The line profiles have tails extending to smaller rotation speeds, which is symptomatic of gas lagging the rotation curve by as much as 40 km s-1 (60 km s-1, after correcting for the inclination of the disk). This HI “beard” has also been observed in other spirals (Fraternali et al., 2001; Barbieri et al., 2005) and is interpreted as gas above and below the plane of the disk. We note that the molecular gas does not show these asymmetric line profiles, so the gas that is inferred to be up out of the plane is primarily atomic.
4.3.4 Dispersions, Disk Instabilities, and Star Formation
Gaussian fits to individual line profiles are used to estimate the velocity dispersions of the HI and CO. The contribution to the linewidth from beam smearing is estimated at each point as the local dispersion in the velocity field (weighted by a Gaussian of the same size as the spatial resolution). Broadening by beam smearing and finite channel width are then subtracted from the line width in quadrature. Aside from the nuclear regions where beam smearing dominates, the corrected HI dispersions in the disk are 12 3 km s-1; the latter quantity indicates the width of the distribution rather than an uncertainty in measurement. The molecular gas has somewhat narrower lines, consistent with dispersions 7 3 km s-1. There is no measurable difference in the velocity dispersions on the two sides of the galaxy.
The star formation rate in the disk may depend not only on the gas surface density, but also on the degree to which the gas disk is gravitationally unstable to the formation of molecular clouds (Krumholz & McKee, 2005). The disk instability is normally parametrized by Toomre’s parameter (Toomre, 1964; Binney & Tremaine, 1987),
which is based on a comparison of the local sound speed and the epicyclic frequency to the gas surface density . Large values of the parameter indicate stability against the formation of self-gravitating entities.
Given the differences in the properties of the two sides of NGC 4647’s disk, the galaxy makes an interesting test case for the study of star formation. The gas velocity dispersion is equal on the two sides of the galaxy; however, the epicyclic frequency may not be. Under the assumptions that the HI and CO velocity fields still trace the local circular velocity and that the inclination of the disk is the same on both sides of the galaxy, we may use the results in Figure 9 to estimate the epicyclic frequency. The side with the rising rotation curve has s-1 at a radius of 4 kpc, whereas the flatter side of the rotation curve has s-1 at the same radius. These initial estimates hint that the higher gas surface densities on the east side of the galaxy may be offset by a higher epicyclic frequency on that side, producing roughly equal values of Toomre’s parameter on both sides.
4.4. , , and Pressure
The asymmetry in the CO intensity (Section 4.2) could conceivably reflect either the underlying distribution of molecular gas or an asymmetry in the CO luminosity per unit mass. For example, a factor of two to three variation in the CO-to-H2 conversion factor from one side of the galaxy to the other could reproduce the observations while keeping the total gas surface density equal on both sides. This conversion factor is expected to depend on several properties of the molecular clouds, including the gas density, temperature, and the interstellar UV field to which the clouds are exposed. Here we simply comment that the UV field is probably stronger in the eastern half of the galaxy than in the western half, since the H luminosity is higher in the east (Figure 3). A stronger UV field could either lead to higher temperatures and increased CO luminosity (Weiss et al., 2001) or to preferential destruction of CO and lower CO luminosity (Israel, 1997; Lequeux et al, 1994), and distinguishing between these alternatives is beyond the scope of the present paper.
We also note that if the conversion factor varies but the total gas surface density is constant, then the star formation efficiency must be higher on the eastern side of the galaxy in order to produce the higher H intensities there (Section 4.2). A higher star formation efficiency on the eastern side might be in conflict with the Toomre-style stability analysis of section 4.3.4, which showed that the epicyclic frequency is expected to be higher in the east. Evidently the assumption of a variable conversion factor raises at least as many questions as it answers. Thus we proceed under the assumption that the conversion factor is constant and the galaxy really does have factors of two to three higher total gas surface density on the eastern side than on the western side.
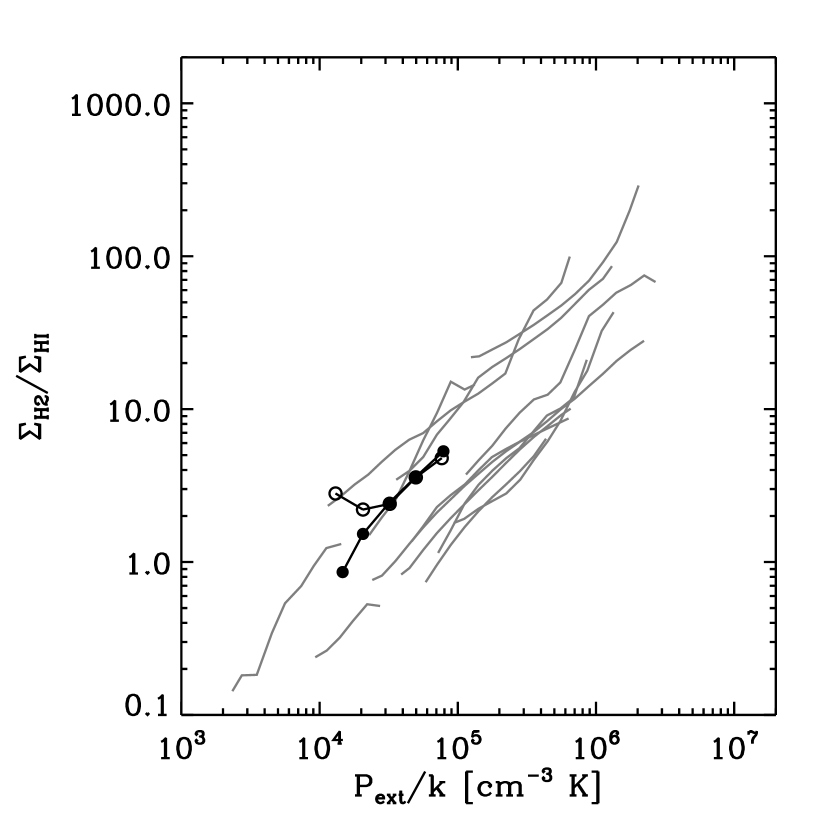
Blitz & Rosolowsky (2004) propose that the H2/H I column density ratio in a disk galaxy is determined by the hydrostatic pressure. This kind of a model could have important applications in simulations of galaxy evolution, since it provides a way to calculate the molecular surface density for star formation purposes. The asymmetric gas distribution in NGC 4647 provides an unusual opportunity to test this model. From a different perspective, if the model is correct then the observed column densities in NGC 4647 offer a way to calculate the interstellar pressure on the two sides of the galaxy and to find out which (if either) of the two sides is consistent with the properties of other spirals.
We explore these questions by constructing a map of the hydrostatic pressure in the galaxy using the method of Blitz & Rosolowsky (2006). Their formulation models disks of galaxies as two gravitationally-coupled fluids with the stellar scale height and midplane volume density much larger than those of the gas at any given position in the disk. For an infinite disk, the implied midplane pressure in the gas component is
| (1) |
where and are the inclination corrected surface densities of neutral gas and stars respectively. The gas velocity dispersion is given by and is the stellar scale height. We convert the integrated intensity of the H I and CO maps into mass surface densities using the standard conversion factor of for the 21-cm emission and a CO-to-H2 conversion factor of . The column densities are then converted to mass surface density assuming a mean particle mass of 1.36 per hydrogen nucleus and an inclination of (§4.3.2). We convert the masked -band image of the galaxy to a stellar surface density assuming a mass-to-light ratio of (Bell & de Jong, 2001). After convolving the H2 and stellar surface density maps to match the resolution of the H I map, we aligned the H I and stellar surface density maps to the H2 map. Using the resulting maps of and , the external pressure can be calculated directly from Equation 1, provided the gas velocity dispersion and stellar scale height are known. Following Blitz & Rosolowsky (2006), we assume that a gas velocity dispersion of 8 km s-1 appropriate for most galaxies and determine a stellar scale-height (420 pc) from a fit to the stellar scale-length (3.2 kpc) using the relationship of Kregel et al. (2002).
In Figure 11, we plot the molecular gas fraction as a function of the midplane hydrostatic pressure in the two halves of the galaxy (separated along the kinematic minor axis). For the western half of the galaxy, the surface density ratio scales with the hydrostatic pressure as it does in other galaxies (). The scale constant ( is consistent with the other galaxies in the Virgo Cluster that were included in the Blitz & Rosolowsky (2006) sample. In the eastern half of the galaxy, the surface density ratio for low apparent pressures (large radii) is a factor of 3.3 higher than in the western half. In other words, the eastern half is proportionally more molecule-rich than the western half for a given apparent pressure in the ISM. Provided that the pressure in the ISM does indeed regulate the molecular gas fraction, this result implies that the eastern half of the galaxy must be subject to larger pressures in the ISM than are inferred from the mass components of NGC 4647 alone. The pressure deficit is , and this deficit is twice as large as the midplane hydrostatic pressure in the outer disk of the western side of the galaxy.
5. Discussion
In a CDM universe galaxy-galaxy mergers and encounters are recognized as major processes that have determined the spectrum of galaxy properties. From an observational perspective, galaxy asymmetries can serve as indicators of the merger/interaction rate. One may measure the incidence of asymmetries and then make the leap to the merger/interaction rate via several important assumptions such as the timescale over which asymmetries will remain detectable. That timescale depends crucially on an understanding of the processes responsible for the asymmetries and how they affect the gas, stars, and star formation activity.
In this context our observations of the mildly disturbed galaxy NGC 4647 raise several questions. NGC 4647 shows two kinds of lopsidedness, in its kinematics and in its gas distribution. More specifically, the gas distribution is asymmetric in two ways: the total gas surface density is significantly higher on the east side than on the west, and the gas disk is also more highly molecular on the east side than on the west. How common are these types of asymmetries, and what causes them? We address the problems in two stages. In section 5.1, a comparison to other mildly lopsided galaxies suggests processes that may create the kinematic asymmetry and enhanced gas surface densities on the east side of the galaxy (or the depressed surface densities on the west side). Section 5.2 discusses local pressure enhancements that may drive the ISM into a more highly molecular state on the east side of the galaxy. In section 5.3 we list some remaining questions and propose tests that would give greater insight into NGC 4647 in particular and spirals in general.
5.1. Lopsided Galaxies
It has been known for some time that many spirals are asymmetric or lopsided. For example, Rix & Zaritsky (1995) and Zaritsky & Rix (1997) find that some 30% of field spirals have lopsided stellar distributions. Baldwin, Lynden-Bell, & Sancisi (1980) show asymmetries in the HI distributions of spirals, and Richter & Sancisi (1994) find that 50% of field spirals show asymmetric global HI profiles that are probably attributable to lopsided gas distributions. Rubin et al. (1999) studied H rotation curves for Virgo spirals, and they find that half show significant kinematic disturbances. In many of these, the disturbance takes the form of an asymmetry in which the velocity field is different on the two sides of the galaxy. From studies of HI position-velocity diagrams and velocity fields Swaters et al. (1999) estimate that the incidence of kinematic lopsidedness is 15%–30% among non-interacting field spirals.
The relatively high incidence of asymmetries (even among field spirals) is significant, since it implies that the responsible mechanisms must either be frequent or long-lasting. Typical dynamical timescales in spiral disks are only on the order of yr. In this context, four general processes have been proposed as sources of kinematic and/or morphological lopsidedness: ram pressure in a cluster environment, gravitational interactions between galaxies, asymmetric accretion of gas from the cosmic web or from satellites, and asymmetric or off-center gravitational potentials.
NGC 4647 is undoubtedly experiencing some ram pressure in its passage through the Virgo intracluster medium. Section 5.2 makes quantitative estimates of the ram pressure. At a purely qualitative level, the sharp HI edge on the northeast side and the shallow dropoff in the HI column density on the southwest (Section 4.1) are suggestive of gentle stripping. The kinematic asymmetry in NGC 4647 may also be evidence of the non-circular velocities induced by significant ram pressure (Hidaka & Sofue, 2002). Finally, the form of the CO asymmetry in NGC 4647 is very like that in NGC 4419, which was attributed to ram pressure by Kenney et al. (1990).
However, it is not at all obvious that ram pressure by itself is a convincing explanation for the ensemble of properties displayed in NGC 4647. The east side of the galaxy appears strongly disturbed, with its enhanced CO emission and rising rotation curve. At 40″ radius the total gas density is twice as high on the east side as on the west side. In contrast, the west side appears very gently (if at all) disturbed. Its rotation curve is well behaved out to at least 70″. Unless the galaxy is proceeding exactly edge-on through the intracluster medium, so that the west side is shielded by the east side, we might expect that the effects of ram pressure would be more noticeable on the low density side of the galaxy than on the high density side. In this respect the ram-pressure stripped galaxy NGC 4419 is actually quite different from NGC 4647; both have asymmetric molecular distributions, but in NGC 4419 the atomic gas is very severely stripped as well (Kenney et al., 2004; Chung et al., 2006).
Asymmetric gravitational potentials can also produce kinematic features like those observed in NGC 4647 and other spirals. For example, Schoenmakers, Franx, & de Zeeuw (1997) add a perturbation of the form to the potential of an axisymmetric galaxy and calculate the effects on its velocity field. Based on that work Swaters et al. (1999) have shown that a perturbation in the potential, where the axis of the perturbation is aligned with the kinematic major axis of the galaxy, can produce a velocity field that flattens on one side but continues to rise on the other. A 5%–10% perturbation in the potential can induce 10%–20% amplitude differences in the rotation curves of the two sides of the galaxy. This kind of a lopsided potential is the explanation favored by Swaters et al. (1999) to explain the HI velocity fields of DDO 9 and NGC 4395, which are similar in character to NGC 4647. Noordermeer et al. (2001) have also shown that the lopsided kinematics of NGC 4395 (and, by analogy, NGC 4647) could be explained by setting the galaxy disk off-center with respect to the dark matter halo. Battaglia et al. (2006) also propose that the halo of NGC 5055 is offset from the center of its disk.
A lopsided gravitational potential would affect the stellar distribution in NGC 4647 in addition to the gas distribution. There are subtle hints of a asymmetry in the stellar distribution of the galaxy; for example, in the broadband red image of Figure 3 the outermost contours are compressed on the southern side of the galaxy and extended on the northwest. The galaxy nucleus is therefore not quite centered in the middle of the outer contours. NGC 4649 has been modeled and subtracted, but more careful analysis should be done to quantify any degree of asymmetry in the stellar distribution of NGC 4647.
NGC 4647, of course, is also an obvious candidate for a gravitational interaction with NGC 4649. Bournaud et al. (2005) have modelled distant, high velocity encounters of similar-mass galaxies, and they find that for impact parameters 130–450 kpc and velocities 160–450 km s-1, the retrograde in-plane encounters can make asymmetries in which the ratio of the perturbed to the unperturbed gravitational force is greater than 0.1 for several Gyr. These amplitudes are similar to those required by Swaters et al. (1999).
A statistical analysis of the distribution of galaxy lopsidednesses leads Bournaud et al. (2005) to propose that asymmetric accretion of gas from the cosmic web must be a significant contributor to lopsidedness in general. The mechanism simply requires that the incoming gas have a nonzero impact parameter. They find that if accretion rates are fairly high — several yr-1, or enough to double the galaxy masses over a Hubble time — a galaxy may develop an asymmetry with an amplitude of 10% to 20%. The asymmetries in the gas and stellar distributions can persist even for several Gyr after accretion stops. As NGC 4647 is embedded in the Virgo cluster’s hot ICM it is unclear how this process might apply to NGC 4647, what the phase of the accreted gas would be, or whether the effect on galaxy kinematics would match the observations.
We suspect that the process that is responsible for the kinematic asymmetry also enhances the gas densities on the eastern side of the galaxy. But the opposite perspective is also interesting: the pile-up in gas surface density may contribute to the kinematic asymmetry. We estimate the dynamical mass of the galaxy taking a rotation speed of 115 km s-1 at a radius of 70″ on the approaching (flatter, probably less disturbed) side of the rotation curve; these values give 1.8 within 5.8 kpc. Some 7.7% of this dynamical mass is attributable to molecular gas plus helium. Since most of the molecular gas is found on the east side of the galaxy, that gas distribution may well contribute to a few percent perturbation in the gravitational potential. The gas density asymmetry is also a perturbation whose axis is roughly aligned with the kinematic major axis, so it has the correct form to explain the kinematic asymmetry according to the models of Swaters et al. (1999). Therefore, even if the original cause produced both the kinematic and the gas density asymmetries together, the resulting density asymmetry may help to maintain the kinematic asymmetry over timescales longer than a dynamical time.
5.2. Producing the Pressure Asymmetry
If pressure regulates the chemical state of the ISM, as suggested by Blitz & Rosolowsky (2006), then the asymmetry in molecular gas fraction is produced by an asymmetry in ISM pressure in the disk. Pressure, by itself, cannot explain the enhanced gas column density on the east side of the galaxy. However, once the gas is piled up on one side, pressure could explain the amount of the ISM that is molecular. The analysis of section 4.4 finds that the observed asymmetry in the molecular gas fraction would imply an excess pressure of beyond that required for the hydrostatic support of the disk of NGC 4647. Thus, we consider again the effects of the intracluster medium, the proximity of NGC 4649, and asymmetric gravitational potentials as possible sources of extra pressure on the east side of NGC 4647.
At the Mpc separation between M87 and NGC 4647, the intercluster medium (ICM) of Virgo has a density of and a temperature of keV (Kenney & Young, 1989). The isotropic pressure in the ICM is significant: , on the order of 10% of the midplane hydrostatic pressure in the outer parts of NGC 4647’s disk. If NGC 4647 is moving with respect to the ICM, it suffers additional ram pressure
| (2) |
The equation has been normalized to the one-dimensional velocity dispersion of the Virgo Cluster (Huchra, 1985). NGC 4647 has a line-of-sight motion relative to M87 of only 100 km s-1, but if its tangential velocity carries it eastward on the sky at 1000 km s-1 or so then the ram pressure could be strong enough to effect the inferred pressure difference. It remains to be seen whether the extra pressure could be applied delicately enough to avoid major disruptions in the kinematics of the downstream side of the galaxy.
Provided that NGC 4647 is physically close to NGC 4649, the hot gas in NGC 4649 can increase the pressure on the eastern side of NGC 4647 through two mechanisms. The first is ram pressure between NGC 4647 and the halo of NGC 4649. Indeed, the diffuse X-ray emission from NGC 4649 extends out to the projected distance of NGC 4647 with a suggestion of a bow shock between the two (Randall et al., 2004). If the galaxies are approaching each other, a lower limit on the relative velocities of the gas systems is =400 km s-1. An enhancement in the plasma density of 0.002 particles cm-3 on the eastern side of NGC 4647 would produce the necessary pressure to account for the observed asymmetry. Using the density profile of the X-ray halo of NGC 4649 (Brighenti & Mathews, 1997), we estimate that this particle density occurs at roughly 12 kpc from the center of NGC 4649. The ISM of NGC 4647 may also be compressed by the isotropic pressure of the hot halo gas; again, the thermal pressure of NGC 4649 is at a distance of kpc from the center of the galaxy (Brighenti & Mathews, 1997). The two galaxies would have to be no farther apart than their current projected separation for these mechanisms to drive the molecular asymmetry.
The difficulty with appealing to a close approach of NGC 4647 and NGC 4649 to explain the kinematic and pressure asymmetries is, again, it seems unlikely that the disk of NGC 4647 could survive the tidal forces and remain unscathed. We take the mass of NGC 4649 to be at least based on the total magnitude and a -band mass-to-light ratio of 9.5–16 (De Bruyne et al., 2001). Strictly speaking, the dynamical analysis of De Bruyne et al. (2001) measures the mass-to-light ratio within the effective radius so that this dynamical mass of is probably an underestimate. For galaxy separations as small as 30 kpc, the tidal acceleration at the edge of NGC 4647’s HI disk is two-thirds as large as the spiral’s own centripetal acceleration. We therefore consider it extremely unlikely that NGC 4647 and NGC 4649 are presently receding from a past encounter at a few tens of kpc. It may be possible that they are still approaching each other.
Alternatively, if something (NGC 4649, or an off-center dark matter halo) generates a mild mode in the potential of NGC 4647 as described in section 5.1, the gas must speed up and slow down as it executes its nearly circular orbit. The ram pressure of gas flowing down into the trough in the potential may be sufficient to account for the expected asymmetry in pressure. This possibility is especially appealing since it naturally connects the asymmetries in the velocities, the gas surface density, and the molecular fraction. The ram pressure of such a flow is
| (3) |
where is the relative velocity at which gas approaches the potential minimum. For flow velocities comparable to the observed velocity differences on the two sides of the galaxy, the combination of the ram pressure with the ICM and the pressure of the gas accumulating in the potential could explain the observed gas distributions.
Finally, since the implied hydrostatic pressure scales linearly with the gas velocity dispersion, we note that the molecular asymmetry could be explained without recourse to an additional source of pressure if the gas velocity dispersion is higher on the east side of the galaxy than on the west. However, to account for the molecular asymmetry entirely, the velocity dispersion would have to be km s-1 on the east side. Such high dispersions are ruled out by our observations (section 4.3.4).
5.3. Remaining Questions
How long the asymmetries in the kinematics and the gas distribution of NGC 4647 will last depends critically on their causes. If the disturbance is temporary, such as a fly-by of NGC 4649, then the spiral can be expected to settle back to a more symmetric state eventually. Alternatively, an offset dark matter halo might produce a long-lasting asymmetric state. The discussions above do not provide a definitive answer to the source of the asymmetries in NGC 4647, but a variety of observational and simulation-based tests can help confirm or rule out various processes.
Part of the difficulty with understanding NGC 4647 is that the separation between NGC 4647 and NGC 4649 is still unknown (as is the true relative velocity of the two). However, if the asymmetries of NGC 4647 are due to a galaxy-galaxy interaction then we would expect the stellar kinematics of NGC 4649 to reflect that interaction. N-body simulations could be used to predict the character and the magnitude of those interaction signatures.
We have also discussed whether hydrodynamic processes such as ram pressure stripping or off-center gas accretion could be responsible for the kinematic and gas distribution features of NGC 4647, but we do not know the history of NGC 4647’s interaction with the ICM. The importance of hydrodynamic processes could be assessed by comparing the gas kinematics to the kinematics of the old stellar populations. If the stellar kinematics are symmetric, then the asymmetries in the gas can probably be attributed to temporary hydrodynamic effects. In addition, hydrodynamic simulations could be used to test whether the ensemble of properties displayed by NGC 4647 implies the presence of both ram pressure and gravitational disturbances (as Vollmer (2003) has suggested for NGC 4654).
A comparison of the asymmetry in the gas surface density to the models of Swaters et al. (1999) suggested that the lopsided gas distribution might contribute to the observed kinematic asymmetry in the gas. That idea could be tested with appropriate hydrodynamic simulations. In addition, simulations that can follow heating, cooling, and formation and dissociation of molecules could investigate whether the conversion from HI into follows naturally from the differences in the gas velocity from one side to the other.
H images of NGC 4647 are noticeably asymmetric (Figure 3), and we have shown that the H surface brightness roughly traces the CO surface brightness. If the conversion factor is roughly constant throughout the galaxy, the star formation efficiency is constant as well. Yet the epicyclic frequency, an important component of a local gravitational stability analysis, may be significantly different on the two sides of the galaxy. More detailed analyses of the stability of this asymmetric disk could give valuable insight into large-scale star formation processes.
The pressure model of Blitz & Rosolowsky (2004) is consistent with our observations of NGC 4647, to the extent that there are several viable candidate sources for the implied extra pressure on the east side of the galaxy. Further progress in testing the model could be stimulated by a better knowledge of how many spirals show relatively symmetric atomic gas but strongly asymmetric molecular gas.
We note that NGC 4647 is actually classified as kinematically regular (non-disturbed) by Rubin et al. (1999). Its kinematic asymmetries are indeed milder than those of many Virgo spirals, as one can see by perusing the rotation curves presented by those authors. But the asymmetries of NGC 4647 are more obvious in two-dimensional velocity field data than in one-dimensional longslit data. The properties of NGC 4647 therefore suggest that the true incidence of disturbances among Virgo spirals is higher than the 50% measured by Rubin et al. (1999).
Furthermore, NGC 4647 would probably not have been identified as asymmetric on the basis of its global HI profile alone (Figure 2). The galaxy therefore suggests that the incidence of asymmetric gas distributions may be higher than the 50% rate inferred by Richter & Sancisi (1994). It is only the combination of the HI and the CO data that revealed the true peculiarities in its gas distribution. Likewise, it is the combination of these two gas phases that will give the tightest constraints on the galaxy’s history. Additional matched resolution HI and CO maps of Virgo spirals would be very helpful for understanding the evolution of the ISM in mildly disturbed galaxies.
6. Summary
Images of HI and CO emission at 15″ resolution in the Virgo Cluster spiral NGC 4647 show that the neutral gas is strongly lopsided. A spiral arm or a segment of a ring on the east side of the galaxy shows up as enhanced HI column densities and a plateau in the molecular gas distribution. The west side shows a very steep dropoff in molecular content but atomic gas dribbles out to large radii. Thus, at radii larger than 30″ (2.5 kpc) the ISM is much more highly molecular on the east side of the galaxy than on the west side. As a result, total gas surface densities are twice as high on the east side of the galaxy as on the west side. The galaxy also shows a kinematic asymmetry; the rotation curve flattens on the west side of the galaxy but continues to rise on the east side. The velocity difference between the two sides is nearly 30% at the edge of the HI distribution.
An analysis of the surface densities of atomic gas, molecular gas, and the stellar disk suggests that the enhanced molecular fraction on the east side can be explained if the interstellar pressure is higher there than in the west. The implied pressure difference is about a factor of two (2.4 cm-3 K) in the outer regions of the disk. We conclude that the pressure model of Blitz & Rosolowsky (2004) is probably consistent with the gas distribution in NGC 4647 since there are several different plausible mechanisms that could provide such a pressure difference.
We discuss possible causes of the kinematic and gas distribution asymmetries in NGC 4647, focusing mainly on ram pressure and on asymmetries in the gravitational potential. The facts that (1) the gas distribution asymmetry is strong in the molecular gas but weak in the atomic gas and (2) the galaxy kinematics are less disturbed on the side where the total gas density is a factor of two lower lead us to suggest that ram pressure by itself may not be a satisfactory explanation for the gas pileup on the east side. In addition, attributing the pressure difference directly to NGC 4649 requires the two galaxies to be so close that tidal forces should destroy the disk of NGC 4647. Thus we favor attributing both the kinematic and the morphological asymmetries to a lopsided gravitational potential that may or may not be related to the presence of NGC 4649. Gas settling into a potential well might explain the larger velocities on the east side, and shocks could convert the gas to molecular form.
We also note several remaining questions that are raised by these results and suggest directions for future work. For example, observations of the stellar kinematics of NGC 4649 should help test for a gravitational interaction between the two galaxies. Stellar kinematics of NGC 4647 could distinguish whether the forces disturbing its gas are gravitational or hydrodynamical in origin. Hydrodynamic simulations could test whether the kinematic asymmetry drives the large-scale variation in the molecular fraction of the gas. A better understanding of the cause(s) of the disturbance will help to predict how long the disturbances will remain detectable.
The comparison of the low density atomic medium and the high density molecular medium is vital to obtaining a complete picture of the ISM in this mildly disturbed galaxy. Furthermore, all indications are that a large fraction of spiral galaxies (both in clusters like Virgo and in the field) have kinematic disturbances like those in NGC 4647. Additional comparisons of atomic and molecular gas in mildly disturbed galaxies should offer important insights into the evolution of the molecular phase as galaxies settle into groups and clusters.
Finally, star formation activity (traced by H emission) follows the CO intensity very well on scales larger than about a kpc. By this measure the local star formation efficiency is constant throughout the galaxy to within factors of two to three.
References
- Akeson (1998) Akeson, R. 1998, BIMA memo series #68
- Baldwin, Lynden-Bell, & Sancisi (1980) Baldwin, J. E., Lynden-Bell, D., & Sancisi, R. 1980, MNRAS, 193, 313
- Barbieri et al. (2005) Barbieri, C. V., Fraternali, F., Oosterloo, T., Bertin, G., Boomsma, R., & Sancisi, R. 2005, A&A, 439, 947
- Battaglia et al. (2006) Battaglia, G., Fraternali, F., Oosterloo, T., & Sancisi, R. 2006, A&A, 447, 49
- Begeman (1989) Begeman, K. G. 1989, A&A, 223, 47
- Bell & de Jong (2001) Bell, E. F., & de Jong, R. S. 2001, ApJ, 550, 212
- Binney & Tremaine (1987) Binney, J. S., & Tremaine, S. 1987
- Blitz & Rosolowsky (2004) Blitz, L., & Rosolowsky, E. 2004, ApJ, 612, L29
- Blitz & Rosolowsky (2006) Blitz, L., & Rosolowsky, E. 2006, ApJ, accepted (astro-ph/0605035)
- Bournaud et al. (2005) Bournaud, F., Combes, F., Jog, C. J., & Puerari, I. 2005, A&A, 438, 507
- Brighenti & Mathews (1997) Brighenti, F., & Mathews, W. G. 1997, ApJ, 486, L83
- Briggs, Schwab, & Sramek (1999) Briggs, D. S., Schwab, F. R., & Sramek, R. A. 1999, in Synthesis Imaging in Radio Astronomy II, eds. G. B. Taylor, C. L. Carilli, and R. A. Perley (ASP Conf. Ser., Vol. 180), pp 127–150
- Cappellari (2002) Cappellari, M. 2002, MNRAS, 333, 400
- Cayatte et al. (1990) Cayatte, V., van Gorkom, J. H., Balkowski, C., & Kotanyi, C. 1990, AJ, 100, 604
- Chung et al. (2006) Chung, A., et al. 2006, in preparation (see also http://www.astro.yale.edu/viva)
- De Bruyne et al. (2001) De Bruyne, V., Dejonghe, H., Pizzella, A., Bernardi, M., & Zeilinger, W. W. 2001, ApJ, 546, 903
- de Vaucouleurs et al. (1991) de Vaucouleurs, G., de Vaucouleurs, A., Corwin Jr., H.G., Buta, R. J., Paturel, G., & Fouque, P. 1991, Third Reference Catalogue of Bright Galaxies, Version 3.9
- Elmegreen (1993) Elmegreen, B. G. 1993, ApJ, 411, 170
- Fraternali et al. (2001) Fraternali, F., Oosterloo, T., Sancisi, R., & van Moorsel, G. 2001, ApJ, 562, 47
- Gavazzi et al. (1999) Gavazzi, G., Boselli, A., Scodeggio, M., Pierini, D., & Belsole, E. 1999, MNRAS, 304, 595
- Helou, Hoffman & Salpeter (1984) Helou, G., Hoffman, G. L., & Salpeter, E. E. 1984, ApJS55, 433
- Hidaka & Sofue (2002) Hidaka, M., & Sofue, Y. 2002, PASJ, 54, 33
- Huchra (1985) Huchra, J. P. 1985, ESO Workshop on the Virgo Cluster, 181
- Israel (1997) Israel, F. P. 1997, A&A, 328, 471
- Jarrett et al. (2003) Jarrett, T. H., Chester, T., Cutri, R., Schneider, S. E., & Huchra, J. P. 2003, AJ, 125, 525
- Kauffmann et al. (1993) Kauffmann, G., White, S. D. M., & Guiderdoni, B. 1993, MNRAS, 264, 201
- Kenney et al. (2004) Kenney, J. D. P., Crowl, H., van Gorkom, J., & Vollmer, B. 2004, Spiral Galaxy - ICM Interactions in the Virgo Cluster, IAU Symposium 217, 370
- Kenney & Young (1988) Kenney, J. D., & Young, J. S. 1988, ApJS, 66, 261
- Kenney & Young (1989) Kenney, J. D., & Young, J. S. 1989, ApJ, 344, 171
- Kenney et al. (1990) Kenney, J. D. P., Young, J. S., Hasegawa, T., & Nakai, N. 1990, ApJ, 353, 460
- Koopmann & Kenney (2004) Koopmann, R., & Kenney, J. D. P. 2004, ApJ613, 866
- Koopmann, Kenney, & Young (2001) Koopmann, R., Kenney, J., & Young, J. S. 2001, ApJS, 135, 125
- Kregel et al. (2002) Kregel, M., van der Kruit, P. C., & de Grijs, R. 2002, MNRAS, 334, 646
- Krumholz & McKee (2005) Krumholz, M. R., & McKee, C. F. 2005, ApJ, 630, 250
- Lay (1999) Lay, O. 1999, BIMA memo series # 72
- Lequeux et al (1994) Lequeux, J., Le Bourlot, J., Pineau des Forêts, G., Roueff, E., Boulanger, F., & Rubio, M. 1994, A&A, 292, 371
- Miller & Owen (2003) Miller, N. A., & Owen, F. N. 2003, AJ, 125, 2427
- Miller, Owen, & Hill (2003) Miller, N. A., Owen, F. N., & Hill, J. M. 2003, AJ, 125, 2393
- Noordermeer et al. (2001) Noordermeer, E., Sparke, L. S., & Levine, S. E. 2001, MNRAS, 328, 1064
- Randall et al. (2004) Randall, S. W., Sarazin, C. L., & Irwin, J. A. 2004 ApJ600, 729.
- Richter & Sancisi (1994) Richter, O.-G., & Sancisi, R. 1994 A&A 290, L9
- Rix & Zaritsky (1995) Rix, H.-W., & Zaritsky, D. 1995, ApJ, 447, 82
- Regan et al. (2001) Regan, M. W., Thornley, M. D., Helfer, T. T., Sheth, K., Wong, T., Vogel, S. N., Blitz, L., & Bock, D. C.-J. 2001, ApJ, 561, 218
- Rubin et al. (1999) Rubin, V. C., Waterman, A. H., & Kenney, J. D. P. 1999, AJ 118, 236
- Sage & Wrobel (1989) Sage, L. J., & Wrobel, J. M. 1989, ApJ, 344, 204
- Sault, Teuben, & Wright (1995) Sault, R. J., Teuben, P. J., & Wright, M. C. H. 1995, in ASP Conf. Ser. 77, Astronomical Data Analysis Software and Systems IV, ed. R. A. Shaw, H. E. Payne, & J. J. E. Hayes (San Francisco: ASP), 433
- Schoenmakers, Franx, & de Zeeuw (1997) Schoenmakers, R. H. M., Franx, M., & de Zeeuw, P. T. 1997, MNRAS 292, 349
- Somerville & Primack (1999) Somerville, R. S., & Primack, J. R. 1999, MNRAS, 310, 1087
- Swaters et al. (1999) Swaters, R. A., Schoenmakers, R. H. M., Sancisi, R., & van Albada, T. S. 1999, MNRAS 304, 330
- Toomre (1964) Toomre, A. 1964. ApJ139, 1217
- Tonry et al. (2001) Tonry, J. L., Dressler, A., Blakeslee, J. P., Ajhar, E. A., Fletcher, A. B., Luppino, G. A., Metzger, M. R., & Moore, C. B. 2001, ApJ, 546, 681
- Vollmer (2003) Vollmer, B. 2003, A&A, 398, 525
- Warmels (1988) Warmels, R. H. 1988, A&AS, 72, 57
- Weiss et al. (2001) Weiss, A., Ninninger, N., Hüttemeister, S., & Klein, U. 2001, A&A, 365, 571
- Welch et al. (1996) Welch, W. J. et al. 1996, PASP, 108, 93
- Wong (2001) Wong, T. 2001, Ph.D. thesis, University of California at Berkeley.
- Zaritsky & Rix (1997) Zaritsky, D., & Rix, H.-W. 1997, ApJ, 477, 118


![[Uncaptioned image]](/html/astro-ph/0606410/assets/x8.png)
Fig. 7. — Continued.