The VLT-FLAMES Survey of Massive Stars: Stellar parameters and rotational velocities in NGC 3293, NGC 4755 and NGC 6611
An analysis is presented of VLT-FLAMES spectroscopy for three Galactic clusters, NGC 3293, NGC 4755 and NGC 6611. Non-LTE model atmosphere calculations have been used to estimate effective temperatures (from either the helium spectrum or the silicon ionization equilibrium) and gravities (from the hydrogen spectrum). Projected rotational velocities have been deduced from the helium spectrum (for fast and moderate rotators) or the metal line spectrum (for slow rotators). The origin of the low gravity estimates for apparently near main sequence objects is discussed and is related to the stellar rotational velocity. The atmospheric parameters have been used to estimate cluster distances (which are generally in good agreement with previous determinations) and these have been used to estimate stellar luminosities and evolutionary masses. The observed Hertzsprung-Russell diagrams are compared with theoretical predictions and some discrepancies including differences in the main sequence luminosities are discussed. Cluster ages have been deduced and evidence for non-coeval star formation is found for all three of the clusters. Projected rotational velocities for targets in the older clusters, NGC 3293 and NGC 4755, have been found to be systematically larger than those for the field, confirming recent results in other similar age clusters. The distribution of projected rotational velocities are consistent with a Gaussian distribution of intrinsic rotational velocities. For the relatively unevolved targets in the older clusters, NGC 3293 and NGC 4755, the peak of the velocity distribution would be 250 with a full-width-half-maximum of approximately 180 . For NGC 6611, the sample size is relatively small but implies a lower mean rotational velocity. This may be evidence for the spin-down effect due to angular momentum loss through stellar winds, although our results are consistent with those found for very young high mass stars. For all three clusters we deduce present day mass functions with -values in the range of -1.5 to -1.8, which are similar to other young stellar clusters in the Milky Way.
Key Words.:
stars: early-type – stars: fundamental parameters – stars: rotation – Hertzsprung-Russell (HR) and C-M diagrams – open clusters and associations: NGC 3293, NGC 4755 & NGC 66111 Introduction
As part of a European Southern Observatory Large Programme, we are using the Fibre Large Array Multi-Element Spectrograph (FLAMES) at the Very Large Telescope to survey the hot stellar populations in our Galaxy and in the Magellanic Clouds. We have observed in excess of 50 O-type stars and 500 B-type stars, in a total of seven clusters. These data have been supplemented with observations of our brighter targets using the Fibre-Fed Extended Range Optical Spectrograph (FEROS) at La Silla. Evans et al. (Eva05 (2005); hereafter Paper I) have given an overview of the scientific goals of the project, discussed the target selection and data reduction techniques, and presented some preliminary analysis for three Galactic clusters. The scientific aims of the survey as discussed in Paper I, included understanding how rotation and metallicity influence stellar evolution and stellar winds, calibration of the wind momentum-luminosity relationship and the nature of supernova progenitors. In the case of stellar evolution, theoretical studies (see, for example, Heger & Langer Heg00 (2000); Maeder & Meynet Mae00 (2000)) provide predictions of the surface enhancements expected for helium and nitrogen. Of particular relevance to our survey are the larger logarithmic enhancements predicted for lower metallicity regimes (Maeder & Meynet Mae01 (2001)). Although there are many previous detailed quantitative studies of O- and B-type stars (Crowther at al. Cro02 (2002, 2006); Bouret et al. Bou03 (2003); Hillier at al. Hil03 (2003); Evans et al. Eva04 (2004); Trundle et al. Tru04 (2004); Walborn et al. Wal04 (2004); Dufton et al. Duf05 (2005); Trundle & Lennon Tru05 (2005)), these have tended to concentrate on narrow lined (and hence possibly slowly rotating) stars, whilst the sample sizes have been relatively small. The current survey will sample both the main sequence and supergiant regimes and include rapidly rotating stars, thereby extending the scope of such studies.
In order to have a sample of stars in the Milky Way to compare with the FLAMES datasets for the SMC and LMC we have obtained spectra of likely cluster members in the three Galactic Clusters, NGC 3293, NGC 4755 and NGC 6611. These clusters were chosen so as to have a similar age range to their lower metallicity Magellanic Cloud counterparts. Although the Milky Way has an abundance gradient (see, for example, Afflerbach et al. Aff97 (1997), Rolleston et al. 2000, Gummersbach et al. 1998, Daflon & Cunha 2004) these clusters are relatively close to the solar position and appear to have a similar metallicity to that of the Sun from a preliminary model atmosphere analysis of selected narrow line targets (see Hunter et al. 2006 for details). Previous studies have discussed the HR-diagrams, star formation timescales, initial mass funtions and rotational velocity distributions in young Galactic clusters and have highlighted the value of spectroscopic analysis of cluster members rather than spectral type assignments from photometric colours (e.g. see Massey et al. 1995ApJ…454..151M (1995), Hillenbrand et al. Hil93 (1993)). Additionally there has been an revival of interest in the rotational velocity distribution of large samples of massive stars for comparison with the predictions of theoretical evolutionary models and also to probe initial conditions during star-formation. Strom et al. (Str05 (2005)) have measured projected rotational velocities for approximately 200 B-type stars in h& Per and suggest that differences between the mean values for the cluster and field stars are due to the star-formation process rather than being a consequence of angular momentum evolution as they have moved from the ZAMS. Huang & Gies (Hua05a (2005)) have presented rotational velocities of stars in nine Galactic open clusters with age ranges of approximately 6 to 73 Myr, and have provided an interpretation on the basis of evolutionary arguments. Additionally the extensive field star sample of Abt et al. (2002ApJ…573..359A (2002)) remains a benchmark study with which to compare cluster rotational velocities. All of these studies illustrate the importance of large stellar samples in order to ameliorate statistical significance problems arising from the random inclination angle of the rotational axes. The availability of the FLAMES spectrograph on an 8m telescope has allowed studies of large samples to be extended to the Magellanic Clouds. For example, Martayan et al. (2006A&A…445..931M (2006)) have studied the effects of metallicity on the rotational velocities of B-type and Be stars in the LMC and find that the LMC stars rotate faster than Be stars at solar metallicity.
In this paper we analyse the early type stars in the three Galactic clusters observed with the FLAMES spectrograph. Stellar atmospheric parameters are deduced using non-LTE model atmosphere calculations and rotational velocities are estimated by comparing observed and theoretical rotationally broadened spectra. The former are discussed with particular reference to the surface gravities found for near main sequence objects; evidence is presented that relates the lower gravity estimates to large stellar rotational velocities. Our projected rotational velocities are discussed both in the context of possible systematic differences between field and cluster populations and to infer the underlying rotational velocity distributions. The estimates of the atmospheric parameters are used to deduce cluster distances leading to estimates of stellar luminosities and evolutionary masses. The former are then used to generate Hertzsprung-Russell diagrams and the agreement with theoretical predictions is discussed, while present day mass functions are estimated from the latter.
2 Observational data
The observational data have been obtained during a European Southern Observatory (ESO) Large Programme to study early-type stars in our Galaxy and the Magellanic Clouds. For the former, targets were observed in three clusters – NGC 3293, NGC 4755 and NGC 6611 – with the Fibre Large Array Multi-Element Spectrograph (FLAMES, R 20 000, see Pasquini et al. Pas02 (2002)) on the Very Large Telescope (VLT). The targets were selected based on astrometry and photometry from the pre-FLAMES observations using the wide-field imager (WFI) on the 2.2-m Max Planck Gesellschaft (MPG)/ESO telescope, whilst the brightest stars were observed separately with the Fibre-Fed, Extended Range Optical Spectrograph (FEROS, R 48 000, see Kaufer et al. Kau99 (1999)) on the MPG. Further details of the target selection criteria and data acquisition are presented in Paper I. Using six standard high-resolution GIRAFFE settings, the FLAMES data cover a wavelength range of 3950-4755Å and 6380-6620Å with a typical signal-to-noise (S/N) ratio of 100, whilst the FEROS spectra range from 3600 to 9200 Å with a S/N ratio 100. Reductions were performed using both IRAF111IRAF is distributed by the National Optical Astronomy Observatories, which are operated by the Association of Universities for Research in Astronomy, Inc., under cooperative agreement with the National Science Foundation. software and the FLAMES pipeline (girBLDRS, Blecha et al. Ble03 (2003)), which showed excellent agreement. Details of the data reduction procedure, spectral classification and radial velocity measurements of the targets were presented in Paper I, which also contains the coordinates and cross-referencing for the designations of the targets. As an appendix we include the finding charts for all objects we observed in these clusters (available on-line only).
In this paper, we have only considered targets classified as earlier than B9. This cutoff was adopted as for later spectral types the neutral helium lines, which have been used as a temperature diagnostic were not normally visible. One exception is the target 4755-001 (note we have adopted the nomenclature used in Paper I), which despite a classification of B9 Ia had a measurable helium spectrum.
3 Method of analysis
In this section, we discuss the methods that were used to estimate the stellar atmospheric parameters, projected rotational velocities, masses and luminosities together with the cluster distances. We also discuss some problematic stars (Sect. 3.4) and also the criteria to identify cluster membership (Sect. 3.6).
3.1 Initial estimation of atmospheric parameters
The estimation of the stellar atmospheric parameters – effective temperature () and logarithmic surface gravity (log ) – requires an iterative process and we have adopted different approaches depending on the stellar effective temperature. For B2–B8 stars, which make up the majority of the sample, the strengths of the hydrogen and neutral helium lines were utilized, while the ionization balance of Si iii/iv was used for the earlier B spectral types. In the case of the O-type stars, the hydrogen and neutral and ionized helium line profiles provided diagnostics for the atmospheric parameters, together with those of the wind. The different methodologies are discussed below:
3.1.1 B2 – B8 stars: H & He lines
As the FLAMES dataset contains a relatively large number of mid and late B-type stars, we have utilized relatively simple methods to estimate their atmospheric parameters. The ratio of the strengths of the neutral helium and hydrogen lines is sensitive to effective temperature for spectral types later than B1, whilst the strength of the hydrogen lines can be used to estimate the surface gravity (see for example Dufton et al. Duf00 (1999)). For hydrogen, the equivalent widths of the H and H lines were measured with the continuum defined at 16Å from the line centre. For any given star these normally agreed to within 3% (which is consistent with our theoretical calculations) and hence their average was adopted. For helium, while a number of different features were available, the best observed line which was seen in effectively all our spectra was that at 4026Å. Moreover, this line has been found to yield reliable effective temperature estimates in a study of hot stars towards the Galactic centre by Dufton et al. (Duf00 (1999)). The equivalent widths (EWs) of this line were estimated with the continuum normally defined at 6Å from the line centre, although for some of the sharper and weaker He i lines a narrower range was adopted where this was believed to increase the reliability of the measurements.
| (a) | (b) |
|---|---|
 |
 |
Diagnostic plots (see Fig. 1) were deduced from synthetic spectra that had been calculated using the non-LTE model atmosphere codes tlusty/synspec (Hubeny Hub88 (1988); Hubeny & Lanz Hub95 (1995); Hubeny et al. Hub98 (1998); see also Ryans et al. Rya03 (2003)). A microturbulent velocity of 5 was adopted, consistent with most of our targets having spectral types that imply that they are on and/or near the main sequence (see, for example, Gies & Lambert Gie92 (1992)). However, as discussed by Dufton et al. (Duf00 (1999)), this choice is not crucial for these broad hydrogen and diffuse helium lines. Fig. 1 shows the variation of the relative strength of the neutral helium and hydrogen lines (EW(He/H)), and of the mean of the equivalent width of the hydrogen lines (EW(H)), for the range of effective temperatures that were available from our grid of model atmospheres. Note that all measurements of the theoretical equivalent widths have used the same continuum definitions as for the observations. For estimating the gravity, the hydrogen lines provide reliable diagnostics across the entire temperature range. By contrast the helium line diagnostic flattens out at temperatures 20 000 K, which sets the effective upper limit for which this method can be used.
For each star, estimates of the atmospheric parameters were obtained by an iterative procedure, using the diagnostic plots illustrated in Fig. 1. Firstly the observed value EW(He/H) was compared to theoretical predictions for a surface gravity of log = 4.0 dex (g in cm s-2) to give an initial estimate of the effective temperature (Fig. 1a). The observed value of log(EW(H)) was then compared with theoretical predictions to give an estimate of surface gravity (Fig. 1b). The above procedure was then repeated until convergence was found for both effective temperature and surface gravity.
| Spec. Type | Method | |
|---|---|---|
| B0.5 V | 27 000 K | Si iii/iv ionization balance (6611-012) |
| B1.0 V | 25 000 K | Si iii/iv ionization balance (3293-018; 4755-015; 6611-021 & -033) |
| B1.5 V | 22 500 K | Interpolation between B1 V and B2 V |
| B2.0 V | 20 000 K | Average of the effective temperature estimate for 11 stars based on their helium spectra |
| B1.0 III | 21 500 K | Si iii/iv ionization balance (3293-003, -007 & -010) |
| B1.5 III | 20 500 K | Interpolation between B1 III and B2 III |
| B2.0 III | 19 500 K | Average of the effective temperature estimate for 2 stars based on their helium spectra |
3.1.2 B0.5 – B1.5: Si ionization balance
The neutral helium spectrum is not a useful effective temperature diagnosis for stars earlier than approximately B2 ( 20 000 K, see Fig. 1) and hence for these objects, the silicon ionization balance was utilized instead. However, atmospheric parameters could not be estimated for stars with large rotational velocities where the silicon spectra was poorly observed. Therefore we only considered narrow-lined stars and adopted their temperature estimates as representative for other stars with the same spectral type.
By adopting an appropriate surface gravity (4.0 dex for dwarfs and 3.0 dex for giants) and a microturbulence (5 but see Sect. 3.4 for a discussion of the microturbulence of the supergiant targets) an initial effective temperature could be estimated using the relative strengths of the Si iii/iv lines and the tlusty (Hubeny Hub88 (1988); Hubeny & Lanz Hub95 (1995)) non-LTE model atmosphere grids discussed in Sect. 3.1.1 (see also Dufton et al. Duf05 (2005) for details on the calculation of the silicon spectrum). These temperature estimates were in turn used to estimate surface gravity by the comparison of observed and theoretical hydrogen Balmer line profiles. The new gravity estimate was then used as the starting point in the next iteration to estimate the effective temperature and the process was repeated until convergence was obtained.
Narrow-lined stars in the clusters were selected with spectral types between B0.5 and B1.5 for both dwarfs and giants. For B0.5 V, the target 6611-012 was analyzed, whilst for B1 V, four narrow-lined stars were available (3293-018, 4755-015, 6611-021 and 6611-033). For B1.5 V, the spectra of all three targets (4755-011, 4755-017 and 6611-032) only show Si iii lines and the effective temperature for this spectral type was adopted as the average of those of B1 and B2 type stars. For B1 III, the effective temperature estimates of three stars (3293-003, 3293-007 and 3293-010) were averaged. No narrow lined star was present in our sample with a spectral type B1.5 III. As in the case of dwarfs, for this spectral type, the effective temperature was taken to be the average of those for our B1 III and B2 III stars. In the case of the latter spectral type, the targets 3293-034 and 4755-003 were excluded from the estimation of mean effective temperature. This was because the former has a peculiar spectrum (see paper I), whilst the estimate for the latter (=24000 K) was beyond the high temperature limit for using the helium spectra as a reliable diagnostic.
These effective temperature estimates are summarized in Table 1 where they have been rounded to the nearest 500K. They were adopted for all other stars with the same spectral classification but with individual surface gravities being deduced from the hydrogen Balmer line profiles.
3.1.3 O and B0
The B0 and O-type stars have temperatures at the edge of, or outside, the range of our tlusty grid. In addition many of these objects show wind features in their optical spectra. For these reasons the hottest objects in our sample have been analyzed with the unified model atmosphere code fastwind as described in Puls et al. (Pul05 (2005)). In order to reduce convergence times, the theoretical calculations included only the H and He or the H, He and Si model atoms (depending on the strength of the Si lines in the spectra and their usefulness as a diagnostic). However in order to incorporate the line blanketing from important metals not included in the rate equations an approximate treatment was invoked (see Puls et al. for details and comparisons with a more detailed technique used by the model atmosphere code cmfgen). The analysis method described below follows closely the iterative processes outlined in Herrero, Puls & Najarro (Her02 (2002)) and references therein.
For the majority of the O-type stars the effective temperature was determined by profile fitting of the neutral and singly ionized helium spectra, with more emphasis given to the latter. For the cooler objects in this subset (i.e. O9 - B0), estimates were also obtained using the silicon ionization equilibrium (Si iii/iv), with good agreement being obtained between the two approaches. Profile fitting to the wings of the hydrogen lines was used to determine the surface gravity. Greater weight was given to the higher order Balmer lines where the wind has less influence on the core of the lines. The wind properties were described by the mass-loss rate, the -parameter and the terminal velocity, the latter was adopted from the spectral-type - terminal velocity scale introduced by Kudritzki & Puls (Kud00 (2000)). The -parameter was initially assumed to be 0.8 and iterated along with the mass-loss rate to obtain a good fit to the Hα profile.
 |
 |
 |
3.2 Projected rotational velocities
Stellar rotational velocities for the B-type stars were determined by comparing observed line profiles to theoretical counterparts that had been convolved with a rotational broadening function (see, for example, Gray Gra92 (1992)). Although the hydrogen lines are well observed throughout our sample, they are intrinsically broad, making it difficult to disentangle effects due to rotation from those due to the atmospheric parameters, whilst there are no metal lines that are usable across all the observed B spectral sub-types. The helium spectrum was a suitable compromise between being well observed whilst not being too intrinsically broad. In particular the He i 4026Å line was relatively strong and thus measurable in most of the program stars. Its theoretical line shape also appeared to be well calculated when its forbidden components were taken into account. In addition, the line having been already used for the temperature estimation provided an additional consistency in the analysis.
For each program star, a theoretical spectrum was selected at a matching, or the nearest, point in our grid of non-LTE model atmospheres to the estimated atmospheric parameters with a microturbulence of 5 again being adopted. To allow for any difference in line strength between the model and the observed spectra, the ratio of their equivalent widths (which was generally near to unity) was used to scale the model spectrum. We note that a broader continuum range of 10Å from the line centre was adopted than that used for the estimation of the atmospheric parameters. This was to ensure the inclusion of the wings of the profile which were important when estimating the rotational velocity. The scaled model spectrum was then convolved with various projected rotational velocity values, and the best fit to the observation, was obtained through a chi-square minimization test (see Fig. 2 for an example). This procedure is a simplified version of that used by Ryans et al. (Rya02 (2002)) to estimate the contribution of rotation and macroturbulence in the broadening of the spectra of early-type supergiants. Tests reported by Ryans et al. indicate that the scaling of the equivalent widths and the values adopted for the atmospheric parameters (including the microturbulence) are not likely to lead to significant errors for stars with significant rotational broadening. Fig. 3 shows examples of the optimal fits obtained when estimating the projected rotational velocity for two stars with relatively low and high projected rotational velocities, with all the estimates listed in Tables The VLT-FLAMES Survey of Massive Stars: Stellar parameters and rotational velocities in NGC 3293, NGC 4755 and NGC 6611 to The VLT-FLAMES Survey of Massive Stars: Stellar parameters and rotational velocities in NGC 3293, NGC 4755 and NGC 6611 having been rounded to the nearest 5 .
We note that the estimates for the very narrow-lined objects may be unreliable due to the intrinsic width of the He i diffuse lines. Hence for all stars where we deduced a sin of less than 50 , we have undertaken a re-analysis of the stellar spectra. In these cases the Si iii line at 4552Å in the hotter stars and the Mg ii line at 4481Å in the cooler objects were considered. A similar methodology as for the helium lines was adopted with the theoretical profiles again being taken from our non-LTE grid with a microturbulent velocity of 5 being adopted and the doublet splitting for the Mg ii line being explicitly included. In most cases the values obtained from the helium and metal lines were similar but in some cases they differed by up to 20 . For these narrow lined stars the values listed in Tables The VLT-FLAMES Survey of Massive Stars: Stellar parameters and rotational velocities in NGC 3293, NGC 4755 and NGC 6611 to The VLT-FLAMES Survey of Massive Stars: Stellar parameters and rotational velocities in NGC 3293, NGC 4755 and NGC 6611 are those estimated from the metal lines.
Instrumental broadening has not been included in our analysis and we have investigated how this might affect our estimates as follows. Representative theoretical profiles have been convoluted with either just a rotational broadening function or with a rotational broadening function and a Gaussian profiles to represent instrumental broadening (with a FWHM equivalent to the inverse of the spectral resolution). For the FLAMES data, the profiles only become significantly different for projected rotation velocities less than 20 , with a correspondingly smaller value for the higher resolution FEROS data. Such small estimates of the projected rotational velocity have only been found for two targets in our sample and we have not attempted to correct these two estimates as they will be subject to additional uncertainties due to the choice of the intrinsic profiles and in particular the adopted microturbulence.
For the O-type stars in NGC 6611, the projected rotational velocities were determined simultaneously with the atmospheric parameters (see Sect. 3.1.3) using a method similar to the B-type stars. For these stars the N iii lines at 4510-4518Å and the Mg ii at 4481Å line were considered.


3.3 Correction of Atmospheric Parameters
Fig. 4 shows the distribution of our initial estimates of the atmospheric parameters of stars observed in NGC 3293, deduced from the hydrogen and helium line strengths as discussed in Sec. 3.1.1. The distribution of surface gravities is surprising in that there appears to be a significant number of low gravity objects. Given the age of this cluster, it would be expected that main sequence stars would make up the most of the sample for this range of spectral types. In particular forty percent of the stars appear to have surface gravities less than 3.70 dex, which is closer to that expected for giants or supergiants than to main sequence stars. We suspect this may have arisen from the use of a restricted wavelength region when measuring the equivalent widths of the hydrogen and helium lines. Stellar rotation broadens line profiles, and when a line is normalized at a fixed continuum position, the measured EW could be different from its intrinsic value, with the discrepancy increasing with the projected rotational velocity. As we have compared such observational equivalent widths with values measured from theoretical spectra with no rotational broadening, the estimated atmospheric parameters might be incorrect.
To investigate this effect, we have constructed a grid of correction factors for different projected rotational velocities. Theoretical spectra have been convolved with rotational broadening functions and then the equivalent widths of hydrogen and helium lines were measured. These have been used to deduce atmospheric parameters from our calibration to estimate how much they deviate from the actual model parameters. This deviation is indicative of the effects of rotation on our adopted methodology, and has been used to correct our initial estimates of the atmospheric parameters. For example, Fig. 5 illustrates the corrections for a projected rotational velocity of sin = 300 – theoretical spectra taken from grid points are marked with a diamond () and after convolution, they imply the set of atmospheric parameters marked with a plus sign (+). The pairs of numbers next to the latter are the derived atmospheric parameters, with the amount of deviation presented in parenthesis. Correction factors were also calculated for projected rotational velocities from 0 to 360 , covering all the sin values of our program stars. The atmospheric parameters of the program stars were then corrected through a series of linear interpolations between the nearest grid points in , log and sin and these corrected values are summarized in Tables The VLT-FLAMES Survey of Massive Stars: Stellar parameters and rotational velocities in NGC 3293, NGC 4755 and NGC 6611 – The VLT-FLAMES Survey of Massive Stars: Stellar parameters and rotational velocities in NGC 3293, NGC 4755 and NGC 6611. Tests show that use of these corrected atmospheric parameters did not lead to any significant changes in the values previously deduced for the projected rotational velocities.
| 3293 | 4755 | 6611 | |
|---|---|---|---|
| Binaries | – | 24 | 7, 13, 14, 30, 68 |
| Emission | 11 | 14, 18 | 10, 22, 28 |
| Others | 72, 121 |
3.4 Comments on individual stars
Some stars have been excluded from the analysis as the measurements of their hydrogen and helium equivalent widths were either not possible or unreliable. They largely fall into three categories, viz. targets later than B8, binaries or stars with very strong emission feature in their Balmer line profiles and are summarized in Table 2. This leaves 92 out of 126 stars observed in NGC 3293, with the numbers for the other clusters being 87/108 (NGC 4755) and 44/85 (NGC 6611). Some comments on individual stars are given below:
3293-001, -002 and 4755-004: the effective temperature of these supergiants were estimated utilizing the silicon ionization balance. Their microturbulence has been determined to be 20, 14 and 15 km-1, respectively, by minimizing the slope in the abundance estimates from the Si iii lines versus their equivalent widths.
3293-027, -029 and -032: the spectral types of these stars remain uncertain due to their very broad line profiles, and they were classified as B0.5-1.5 in Paper I. We assume that they are B1.0 and adopt a ‘calibrated’ effective temperature of 23 000 K (Table 1).
3293-034: The helium spectrum implies that this B2 IIIh star has an effective temperature of 26 000 K, much higher than the limit of validity for this method and incompatible with its spectral type. We suspect that these inconsistencies arise from its spectral peculiarities.
6611-010 & -022 These Be stars have no useful effective temperature indicators, making it difficult to estimate their atmospheric parameters. Theoretical profiles were fitted to H line to produces loci of possible atmospheric parameters. For representative parameter pairs, sin values were estimated and their average is presented in Table The VLT-FLAMES Survey of Massive Stars: Stellar parameters and rotational velocities in NGC 3293, NGC 4755 and NGC 6611
3.5 Stellar masses and luminosities
In order to determine stellar luminosities, it is important that we have reliable cluster distances. Several studies have estimated these distances and some of the more recent are summarized in Table 3. We have chosen to list results from wide-field CCD and spectroscopic surveys, which supersede the older photoelectric methods based on less reliable samples.
We have also independently determined a distance to each cluster from a spectroscopic parallax method, applied to the main-sequence targets in our clusters. Firstly intrinsic colours ()o were calculated using standard Johnson filter curves and flux calibrated tlusty spectra for a range of effective temperatures and two gravities. As can be seen from Table 5 there are relatively small differences between the values for and 4.0 dex . Hence we adopted the former for all stars with dex, and the latter for the higher gravity objects. A standard Galactic reddening law of Av = 3.1 () was adopted for NGC 3293 and NGC 4755 as this has been found previously to be a suitable value (Baume et al Bau03 (2003)). However there is evidence that the reddening towards NGC 6611 is anomalous and a value of = 3.75 () has been found to best match the optical and infra-red magnitudes of the cluster members when combined with the colour excesses from stars with known spectral types (Hillenbrand Hil93 (1993)).
| Cluster | Method | Distance | Age |
| kpc | Myr | ||
| NGC 3293 | |||
| Freyhammer et al. (Fre05 (2005)) | Eclipsing Binary | 2.80.3 | 10-13 |
| Baume et al. (Bau03 (2003)) | MS fitting | 2.80.3 | 6.5-10 |
| Shobbrook (Sho83 (1983)) | sequence fitting | 2.50.1 | - |
| This paper (33 stars) | Spectroscopic parallax | 2.90.1 | 10-20 |
| Mean of all results | 2.8 | 10 | |
| Mean and SD of | 0.800.29 | ||
| NGC 4755 | |||
| Sanner et al. (San01 (1995)) | MS fitting | 2.10.2 | 8-12 |
| Balona & Koen (Bal94b (1994)) | MS fitting | 2.00.2 | - |
| Sagar & Cannon (Sag95 (1995)) | MS fitting | 2.10.2 | 10 |
| This paper (39 stars) | Spectroscopic parallax | 2.30.1 | 10-15 |
| Mean of all results | 2.10.2 | 10 | |
| Mean and SD of | 1.150.15 | ||
| NGC 6611 | |||
| Hillenbrand et al. (Hil93 (1993)) | Spectroscopic parallax | 2.00.2 | 1-3 |
| Belikov et al. (Bel99 (1999)) | MS fitting | 2.10.2 | - |
| This paper (24 stars) | Spectroscopic parallax | 1.80.1 | 2-4 |
| Mean of all results | 2.00.2 | 2 | |
| Mean and SD of | 2.810.88 |
From the non-rotating evolutionary tracks of Schaller et al. (Sch92 (1992)) and Meynet et al. (Mey94 (1994)) we have inferred surface gravities and then by interpolating in the log - plane, estimated stellar luminosities. These have been combined with bolometric corrections and the ) values to determine spectroscopic distances for each target. For 4.45, the bolometric corrections of Vacca et al. (Vac96 (2004)) were used, while for lower effective temperatures, those of Balona (Bal94a (1994)) were adopted. As discussed above, the determination of the surface gravity in our fastest rotating targets is subject to some uncertainty. Hence we restricted our sample of stars to those, having . Effectively we are estimating cluster distances by applying a hybrid spectroscopic and evolutionary parallax method for stars which we are confident are lying close to the main-sequence and have well determined surface gravities. The distance estimates are listed in Table 3, and are in good agreement with those found previously from other methods. We have adopted a mean value of these estimates for use in this paper.
Using these distances, we have re-determined the luminosity of each star from their -band magnitude, a bolometric correction (as discussed above) and their value. This allowed stars to be placed on a HR-diagram, and by interpolation between the Geneva evolutionary tracks led to estimates of their evolutionary masses, which are summarized in Tables The VLT-FLAMES Survey of Massive Stars: Stellar parameters and rotational velocities in NGC 3293, NGC 4755 and NGC 6611–The VLT-FLAMES Survey of Massive Stars: Stellar parameters and rotational velocities in NGC 3293, NGC 4755 and NGC 6611.
3.6 Cluster membership
In order to investigate whether an individual star is a cluster member we have used two criteria. One is radial velocity (listed in Tables The VLT-FLAMES Survey of Massive Stars: Stellar parameters and rotational velocities in NGC 3293, NGC 4755 and NGC 6611–The VLT-FLAMES Survey of Massive Stars: Stellar parameters and rotational velocities in NGC 3293, NGC 4755 and NGC 6611 and taken directly from Paper I) and the other is distance from the cluster centre. In Table 4, we summarize the mean radial velocity of the clusters (again as reported in Paper I), together with the adopted cluster centres and radii (NGC 3293: Baume et al. Bau03 (2003); NGC 4755: Lynga Lyn87 (1987); NGC 6611: Belikov et al. Bel99 (1999)). The use of radial velocities alone is not a reliable way to determine cluster membership as stars with discrepant (but apparently non-variable) radial velocities could be binaries with periods significantly longer than our sampling frequency (which for NGC 3293 and NGC 4755 is less than one night). Hence we have only identified a star as a non-member if its radial velocity is more than 2 away from that of the mean value and its distance from the adopted cluster centre (designated in Tables The VLT-FLAMES Survey of Massive Stars: Stellar parameters and rotational velocities in NGC 3293, NGC 4755 and NGC 6611–The VLT-FLAMES Survey of Massive Stars: Stellar parameters and rotational velocities in NGC 3293, NGC 4755 and NGC 6611) is more than twice the cluster radius. Such objects have been identified by a and we note that they are only a small fraction of our total sample. In turn this may imply that our rejection criteria may not be sufficiently stringent but we have found that changing our criteria (e.g. to radial distances of less than one cluster radius) had little effect on our sample.
| Cluster | vr | Centre | Radius | |
|---|---|---|---|---|
| RA | Dec | |||
| NGC 3293 | -125 | 4.1′ | ||
| NGC 4755 | -205 | 5.0′ | ||
| NGC 6611 | +108 | 4.8′ | ||
4 Discussion
4.1 Atmospheric parameters
We have used a variety of methods based on non-LTE model atmosphere techniques to constrain the stellar atmospheric parameters. As discussed in Sect. 3.1.3, the use of different effective temperature criteria for the O and B0-type stars led to excellent agreement. Additionally previous analyzes of the spectra of B-type supergiants using the tlusty grid adopted here (Dufton et al. Duf05 (2005)) and the code fastwind (Trundle et al. Tru05 (2005)) have also yielded encouraging agreement. Hence we believe that in general our estimates of effective temperature should have an accuracy of typically 5% and should be generally more reliable than those based on the calibrations of broad band colours. Exceptions may occur for the small number of stars that are peculiar (see Sect. 3.4) or where we have adopted effective temperatures based on spectral types.
| log | log | |||||
|---|---|---|---|---|---|---|
| 13500 | -0.102 | -0.402 | -0.119 | -0.478 | ||
| 15000 | -0.125 | -0.500 | -0.140 | -0.571 | ||
| 18000 | -0.161 | -0.649 | -0.174 | -0.724 | ||
| 20000 | -0.181 | -0.732 | -0.188 | -0.813 | ||
| 23000 | -0.203 | -0.840 | -0.198 | -0.917 | ||
| 25000 | -0.212 | -0.899 | -0.209 | -0.958 | ||
| 27500 | -0.228 | -0.947 | -0.209 | -0.989 | ||
| 30000 | -0.244 | -0.984 | ||||
| 35000 | -0.258 | -1.035 | ||||
For our gravity estimates, the situation was complicated by the corrections required for targets with large projected rotational velocities (see Sect. 3.3). Whilst the corrections for the effective temperature estimate are relative small (typically less than 1 000 K), those for the surface gravity can be significant (see Fig. 5). To investigate the reliability of these corrections we have considered how the gravity estimates vary with rotational broadening. Our procedure has been to divide our targets into two bins — those that appear to be near to the main sequence (log g 3.9 dex) and those that may have evolved. For the latter, we have excluded five supergiants (classified as Ia or Ib in Paper I), as these targets are clearly evolved. Additionally we have excluded the O-type stars for NGC 6611 as these were analyzed separately from the B-type stellar sample and employed detailed fitting of the hydrogen line profiles. In Table 6, we summarize the mean and standard deviations for the projected rotational velocities of our two samples for each individual cluster and for all our targets.
| Cluster | High gravity | n | Low gravity | n |
|---|---|---|---|---|
| NGC 3293 | 47 | 41 | ||
| NGC 4755 | 47 | 38 | ||
| NGC 6611 | 22 | 6 | ||
| All targets | 116 | 85 |
For all three clusters (although the sample sizes for NGC 6611 are small), there is a systematic trend in the sense that the low gravity objects have the higher mean projected rotational velocity and this is confirmed when all the targets are considered. This result appears anomalous as if the lower gravity targets had evolved from the main sequence, their rotational velocities might have been expected to decrease due both to the increase in their moment of inertia and to the loss of angular momentum from mass loss. Rather this trend may arise from the estimation of surface gravities for rapidly rotating stars and we have identified two possible causes. Firstly, the correction procedure for the atmospheric parameters discussed in Sect. 3.3 may not have been successful. To test this hypothesis, we have used the atmospheric parameters and projected rotational velocities given in Tables The VLT-FLAMES Survey of Massive Stars: Stellar parameters and rotational velocities in NGC 3293, NGC 4755 and NGC 6611–The VLT-FLAMES Survey of Massive Stars: Stellar parameters and rotational velocities in NGC 3293, NGC 4755 and NGC 6611 to generate theoretical hydrogen line profiles. In effectively all cases these were in good agreement with our observed line profiles and hence we believe that our correction procedure is not the main cause of this discrepancy.
A second explanation is that for stars with large rotational velocities, the effective surface gravity will vary over the stellar surface due to the centrifugal force increasing as one moves from the pole to the equator. To a first order of approximation, our methodology will measure the mean effective surface gravity, which will be smaller than that of an analagous slowly rotating object. Hence the anti-correlation between projected rotational velocity and estimated surface gravity could be a manifestation of such an effect. For example, Howarth & Smith (How02 (2001)) found a variation of 0.4 dex between the effective surface gravity at the pole and the equator for three rapidly rotating O9-O9.5 type stars.
To test this hypothesis we have computed models and synthetic spectra for a star with an B spectral type (corresponding to =20000; log =4.0 at the stellar poles) using the methodology discussed by Townsend (Tow97 (1997)) which includes the effects of rotation on the pole to equator temperature structure and on the stellar radius. The synthetic input spectra were based on LTE atmospheres, calculated with ATLAS9 (Kurucz Kur05 (2005)) and LTE line formation, which should be adequate for assessing the effects of stellar rotation. Further details can be found in Kaufer et al. (Kau06 (2006)).
For models with different rotational velocities, we have measured the equivalent widths of the features used to estimate atmospheric parameters such as the He i line at 4026Å and the hydrogen Balmer lines. The results are difficult to interpret but the effects of rotation on these spectral features appear negligible for equatorial rotational velocities less than 250 . For faster rotators, the equivalent width of the He i remains effectively unchanged but the strength of the hydrogen lines decreases. However the changes are relatively small with those for the H equivalent width being approximately 10-15% for equatorial rotational velocities upto 400 , which corresponds to 80% of the critical equatorial velocity. In turn this would lead to a change in the estimated surface gravity of 0.2 to 0.3 dex.
In Sect. 4.5, we estimate the mean equatorial rotational velocity for the cluster NGC 3293 and NGC 4755 as approximately 225-250 . Assuming a Gaussian distribution of velocities, the width would be approximately 110 . Hence the number of targets with equatorial velocities greater than 250 would be 40-50%, whilst those with a rotational velocity of 400 or more would be of the order of 5-10%. From the above, although high rotational velocities may contribute to the spread of gravity estimates found in our two older clusters, it is unclear whether it can fully explain these variations.
In summary, we believe that our effective temperature estimates are secure and find no evidence that our methodology has introduced systematic errors in our gravity determinations. Rather the significant number of relatively low gravity B-type objects may reflect in part a decrease in the effective surface gravity due to centrifugal acceleration.
4.2 Hertzsprung-Russell diagrams


For all three cluster, we have used the luminosities and effective temperatures listed in Tables The VLT-FLAMES Survey of Massive Stars: Stellar parameters and rotational velocities in NGC 3293, NGC 4755 and NGC 6611–The VLT-FLAMES Survey of Massive Stars: Stellar parameters and rotational velocities in NGC 3293, NGC 4755 and NGC 6611 to construct Hertzsprung-Russell (HR) diagrams and these are presented in Fig. 6. We have used different symbols to distinguish between those targets with estimated logarithmic surface gravities less than and greater than 3.9 dex. These are effectively the same as the samples discussed in Sect. 4.1 but with the supergiants now being included in the former. Also shown are the evolutionary tracks and isochrones of Schaller et al. (Sch92 (1992)) and Meynet et al. (Mey94 (1994)), taken from the database of the Geneve group (see http://obswww.unige.ch/mowlavi/evol/stev_database.html; also available from the Centre de Donn es Astronomiques de Strasbourg, http://cdsweb.u-strasbg.fr/CDS.html) for a metallicity, Z = 0.02.
In general there is a good qualitative agreement between the observed and theoretical HR diagrams although the observed main sequences appear to be systematically more luminous than predicted. For the late-B type stars, where the choice of isochrone is not important, this discrepancy would appear to be approximately, log , for the older clusters. The discrepancy may be larger for NGC 6611 but in this case the sample size is relatively small. This systematic difference in luminosity would correspond to an error in our adopted distances of approximately 60%, which although possible is significantly larger than the range of values summarized in Table 3. Slesnick et al. (Sle02 (1992)) have undertaken an extensive photometric and spectroscopic study of the double cluster h and Persei, which is similar in age to those of NGC 3293 and NGC 4755. Inspection of the HR diagrams (see their Fig. 6 and 7) imply good agreement between the observed late-B type stars and the theoretical predictions of Schaller et al. (Sch92 (1992)). However, recently, Strom et al (Str05 (2005)) have undertaken a study of projected stellar rotational velocities in h and Persei and used the results of Slesnick et al. For this smaller sample, there is again evidence of a discrepancy (see Fig. 1 of Strom et al.) similar to that found here for the later B-type spectral types.
 |
|
 |
|
 |
In our HR diagrams, we have distinguished between apparently low and high gravity objects as discussed above. For our two older cluster, the effects of stars evolving from the main sequence can be seen for our early-B type objects. However for the later B-spectral types, there is no clear segregation of the targets as would be expected if the lower gravity objects had evolved from the main sequence. We have further investigated this by refining the analysis discussed in Sect. 4.1 to only consider targets with effective temperatures less than 20 000 K, where evolutionary effects should be negligible. For all our targets, the mean projected rotational velocities are 17872 and 21792for the high and low gravity stars respectively. The former is similar to that listed in Table 6 for the corresponding sample, whilst the latter is larger due to the exclusion of hotter evolved objects. The position of the cool lower gravity objects in the HR diagrams and their high mean rotational velocities both support the hypothesis that our gravity estimates are reliable (in the sense that they are measuring the mean surface gravity) and that their range may reflect the different contributions of the centrifugal acceleration. An important consequence of this is that the lower effective gravity has led to many of these objects being classified as giants (see Tables The VLT-FLAMES Survey of Massive Stars: Stellar parameters and rotational velocities in NGC 3293, NGC 4755 and NGC 6611–The VLT-FLAMES Survey of Massive Stars: Stellar parameters and rotational velocities in NGC 3293, NGC 4755 and NGC 6611) and hence calibrations based on spectral type of, for example, the luminosity would led to systematic errors.
From the HR diagrams it was also possible to estimate cluster ages (assuming coeval star formation). For all three clusters the fitting of the isochrones was problematic as discussed below.
NGC 6611: As discussed above, the observed main sequence (which for this young cluster is still discernible at B0 spectral type) appears systematically brighter than predicted. There is evidence that the extinction towards this cluster is anomalous (see, for example, Chini & Wargau, Chi90 (1990) and references therein) and indeed we adopted a different value for the ratio of the total extinction to the reddening, R (see Sect. 3.5) than for the other clusters. Hence some of the discrepancy may arise from uncertainties in the interstellar extinction. We note that the HR diagram of Hillenbrand et al. (Hil93 (1993); Fig. 8) implies a similar discrepancy. These authors also considered isochrones for pre-main sequence evolutionary tracks but for our targets with effective temperature greater than 20 000 K the timescales for reaching the main sequence would appear too small to explain this discrepancy – for example 300 000 years at an effective temperature of 20 000K. However Hillenbrand et al. also found evidence that some intermediate mass stars (3-8 solar masses) could be as young as 250 000 years. If such ages were also present amongst the more massive stars, this would help explain the enhanced luminosity of our objects. We find a best fit isochrone for this cluster of approximately 2 an , with some evidence for age spread of 1 Myr, consistent with the results of Hillenbrand et al.
NGC 3293 and NGC 4755: Given the similarity in their HR diagrams, these clusters are best considered together. As discussed above, their observed main sequences (for effective temperatures of less than 20 000 K) appear to be more luminous than predicted by evolutionary models. In these cases, this would not appear to be due to anomalous extinction. Also, given the larger cluster ages, it would appear unlikely that we are observing stars evolving to the main sequence, although Sagar & Cannon (Sag95 (1995)) identified lower mass pre-main sequence objects with ages between 3-10 million years in NGC 4755. Inspection of their Fig. 7 implies that Sagar & Cannon also found the B-type main sequence to be overluminous compared with the isochrones of Maeder & Maynet (Mae91 (1991)). By contrast, Fig. 7 of Baume et al. (Bau03 (2003)) implies good agreement between the observed HR diagram of NGC 3293 and the theoretical models of Girardi et al. (Gir00 (2000)). However this comparison is complicated by Baume et al. extending the envelope of the predicted B-type main sequence upwards by 0.75 magnitudes corresponding to binary systems with two similar stars. Additionally the published isochrones of Girardi et al. have a minimum age larger than those quoted by Baume et al., who presumably had access to additional unpublished information further complicating any comparisons. A binary population could also help explain our discrepancy but given our use of high dispersion spectroscopy to estimate effective temperatures (compared with Baume et al. who used (B-V)0), we would expect any such contamination to be small. From the position of the main sequence turnoff, both clusters appear to have ages between 10 and 20 million years. The theoretical isochrones fit the giant population reasonably well in NGC 4755 but in NGC 3293, there are a group of stars with an implied evolutionary age greater than 20 million years. Additionally both clusters contain supergiants (the highest luminosity stars in Fig. 6), which if they have evolved as single stars appear to have evolutionary lifetimes of less than 10 million years. Indeed the lower age estimate obtained by Baume et al. may be at least partly influenced by these targets.
In summary, for all three clusters, the agreement between the observed HR diagrams and the theoretical predictions is rather disappointing. This is particularly the case as our effective temperature estimates should be more reliable than other studies that have used photometric colours. Indeed for all three clusters it would appear that there is either non-coeval star formation or the evolution of individual targets is being influenced by other factors. The former is a plausible explanation for NGC 6611 given its youth and the detection by Hillenbrand et al. (1993) of very young pre-main sequence intermediate mass objects. Although the bulk of the star formation for NGC 3293 and NGC 4755 is consistent with ages of 15 Myrs, the most massive stars in the cluters have smaller evolutionary ages of approximately 5 Myrs. This would imply a very extended period of star formation and hence these discrepancies may be due, at least in part, to other factors such as binarity.
 |
|
 |
|
 |

4.3 Initial Mass Functions
The atmospheric parameters and masses determined in the previous sections allow the mass functions of the three clusters to be re-evaluated with the most extensive data and information to date. As discussed in Paper I, we are not spectroscopically “complete” in any of the clusters, in the sense that we were not able to place fibres on all stars within a given colour-magnitude range. However in the case of NGC 3293 and NGC 4755 the reddening towards the cluster appears fairly homogeneous and hence we can estimate the effective temperatures and luminosities from the stellar photometry. In the case of NGC 6611, which shows a scattered colour-magnitude diagram, such a procedure would not be reliable and we have chosen to increment the Hillenbrand et al. (Hil93 (1993)) study with our additional spectroscopy in order to improve the statistical significance of the results.
4.3.1 NGC 3293
We have selected all the stars from the colour magnitude diagram (see Paper I, Fig. 3) for which we do not have spectroscopic data and which were in the range and (where is the intrinsic colour estimated using the data in Table 3). Effective temperatures were estimated by fitting a cubic to the results in Table LABEL:tlusty_ubv (assuming that ). We then calculated bolmetric luminosities and masses using the method employed in Section 3.5. Thirty six stars were selected, all with masses in the range 3-10M⊙. There is also one confirmed red supergiant cluster member of NGC 3293 which must be included. Feast (Fea58 (1958)) gives an M0 Iab classification with and using the bolometric corrections of Elias et al. (1985ApJS…57…91E (1985)), we have estimated a mass from the Geneva evolutionary tracks of 15M⊙.
To determine the IMF, we follow the method of Hillenbrand et al. (Hil93 (1993)) and Massey et al. (1995ApJ…454..151M (1995)), so that our results can be directly compared to those studies. Stars were divided into mass bins, whose size was chosen to give comparable numbers of objects as far as possible. The number of stars in each bin was normalised to unit logarithmic mass interval and to unit area (kpc2) and the Scalo (1986FCPh…11….1S (1986)) notation was adopted. The area sampled was taken from the cluster radius (we used twice the quoted radius, to be consistent with the membership criteria applied above).
In Fig. 7 we plot the present day mass function (PDMF), which given the relatively small age of NGC 3293 and the fact that the majority of stars are on the main-sequence, is effectively the IMF. A linear least squares fit was performed, with each point being weighted by , where is the number of points in the bin. We find a slope of over the range 2.8-40M⊙. Baume et al. (Bau03 (2003)) estimate for the mass range 1.4-45M⊙, but find a steeper slope of for the higher mass stars in the range 8-45M⊙. Our results imply that this steeper value for the high mass objects extends down to 3M⊙ and are consistent with the range of IMFs found by Massey et al. (1995ApJ…454..151M (1995)) for young clusters in the Northern Milky Way.
4.3.2 NGC 4755
The PDMF for NGC 4755, and hence by implication the IMF, was estimated in a similar way as that for NGC 3293 . We used the same magnitude and colour criteria ( and ) and identified 51 stars, with masses in the range 2-4M⊙. Again there is one red supergiant that is a cluster member, with an M2Ib spectral type (Feast Fea63 (1963)), for which we have estimated a mass of 15M⊙. In Fig. 7, we plot the IMF for NGC 4755 and estimate a slope of , which again is consistent with the range reported in Massey et al. (1995ApJ…454..151M (1995)) and similar to that for NGC 3293.
4.3.3 NGC 6611
For NGC 6611, because of the highly variable reddening across the field, it was not possible to use a similar method to that for NGC 3293 and NGC 4755. From Hillenbrand et al. (Hil93 (1993)), we can identify 22 stars with spectral types earlier than B3, which are likely cluster members but for which we do not have spectroscopy. All but one of these are classified as B0.5V-B3V and we have adopted effective temperature estimates based on the data in Table 1. The other target is BD4912, which was classified as B2.5I, and for this we have adopted (Crowther et al. Cro05 (2006)). Masses were then calculated following the same procedure as discussed in Section 3.5.
We have also estimated effective temperatures, luminosities and masses for likely cluster members in the Hillenbrand et al. sample without spectral types by calculating , and using the relation of Massey et al. (Mas89 (1989)). None of these targets had masses above 7M⊙ and hence it is reasonable to assume that the combination of our spectroscopy and that of Hillenbrand et al. is virtually complete above 7M⊙. In Fig. 7 we plot the IMF for NGC 6611 and determine a slope of , which is slightly steeper than the value of of Hillenbrand et al., but is consistent with a Salpeter type value and again similar to our other clusters and those in the Massey et al. (1995ApJ…454..151M (1995)) survey.
4.4 Projected Rotational Velocities
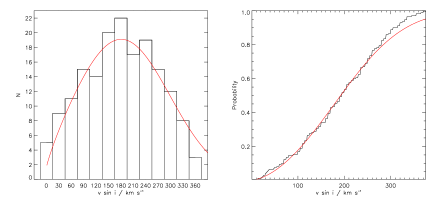
In Figure 8, the distribution of projected rotational velocities are plotted as histograms for all three clusters. Given the similarity in their ages and HR diagrams, it is not surprising that the distributions for NGC 3293 and NGC 4755 appear similar. There appears to be an excess of stars in NGC 4755 with projected rotational velocities between 100-150 but assuming Poisson statistics, this is not statistically significant and indeed the mean values for the two clusters are almost identical (NGC 3293: 188 ; NGC 4755: 185 ). We have calculated cumulative probability functions (CPFs) for our combined samples in NGC 3293 and NGC 4755 in order to compare our results with the study of Strom et al. (Str05 (2005)) for the double cluster, h and Persei, which appears to have a similar age (of approximately 13 million years for their nuclear regions - Slesnick et al., Sle02 (1992)). We follow the methodology of Strom et al. by dividing our sample into three groups (see Fig. 1 of Strom et al.), viz. (1) relatively unevolved stars with an effective temperature, 17000; (2) stars with 17000 21000; (3) stars that have evolved significantly from the main sequence, 21000 K. In Fig. 9, we plot the CPFs for all our targets and for each group, together with the CPFs for stars in h and Persei and Strom et al’s sample of field stars. Strom et al. make two major conclusions about their CPFs. The first is that the clusters stars on the whole tend to rotate faster than the field stars counterparts. Secondly they find that by dividing their sample into these different mass bins they can see a trend in which the lower mass stars (M⊙) have values clearly higher than the field stars but that the higher mass stars (M⊙) show a very similar distribution to their field star counterparts.
Inspection of Fig. 9 shows that the projected rotational velocities are systematically higher in the NGC 3293 and NGC 4755 clusters than in the field populations. This difference has also been found previously in other studies (see, for example, Bernacca & Perinotto Ber74 (1974); Wolff et al. Wof82 (1982); Keller Kel04 (2004)) and has been interpreted in several ways including differences in the ages of the field and cluster targets. However our results are significantly different to the detailed work by Strom et al. Their CPFs for the h and Persei double cluster and the field show a clear differentiation for group (1) targets, decreasing for groups (2) and (3). Strom et al. discussed this behaviour at length and postulated that it reflected the star formation environment rather than evolutionary effects during the stellar lifetimes. Their conclusion that evolutionary effects were unlikely was based on the fact that the mean of the high mass stars (group 3) was nearly a factor of two higher than that for the lowest mass objects (group 1). Meynet & Maeder (2000A&A…361..101M (2000)) and Heger & Langer (2000) calculations of the rotational velocity evolution of M⊙ stars on the main-sequence suggests a decrease in velocity of between % within yrs. Hence Strom et al. speculated that the differences reflected the effects of higher accretion rates that may be characteristic of star formation in these dense clusters. In particular they suggested that enhanced aggregation will have three effects, viz. (1) higher initial rotation speeds, (2) higher initial radii along the stellar birth line (when deuterium shell burning commences), resulting in greater spin up as the star evolves to the main sequence and (3) that the higher initial birthline radii are especially pronounced for mid- to late-B-type stars. This latter leads naturally to the larger differences with respect to field stars observed for their group (1) objects in h and Persei.
In our combined sample for NGC 3293 and NGC 4755, the rotational velocity distribution of our group (1) objects is essentially the same as that found by Strom et al. However our group (2) and (3) objects show similar enhanced projected rotational velocities and in particular do not tend towards those of the field stars. Hence contrary to the results for h and Persei, any effect would appear to be operating throughout our stellar sample. Huang & Gies (Hua05a (2005)) have surveyed 496 OB stars in clusters within the approximate age range Myrs, and also find fewer slower rotators in the cluster stars than in the field. They also present some evidence for the higher mass stars (late-O to early-B) spinning slower than the lower mass late B-types, and suggest that this can be explained by the spin-down of massive stars through angular momentum loss via stellar winds e.g. as modelled by Meynet & Maeder (2000A&A…361..101M (2000)) and Heger & Langer (Heg00 (2000)).
One possible explanation for the different projected rotational velocity distributions for groups (2) and (3) in our combined NGC 3293 and NGC 4755 sample and that of Strom et al. (Str05 (2005)) for h and Persei is that the clusters have different ages. Hence we have used the data presented by Strom et al. to construct an HR diagram similar to those shown in Fig. 6. Our procedure was to use their absolute visual magnitudes and the bolometric corrections of Balona (Bal94a (1994)) to deduce stellar luminosities and the HR diagram for h and Persei is shown in Fig. 10, together with isochrones again taken from the Geneve database.

The observational HR diagram for h and Persei is qualitatively similar to those for NGC 3293 and NGC 4755. However for the former the agreement between observed and theoretical main sequences is better for the later B-type stars. As for our clusters, the evolved star populations in h and Persei imply a range of ages with an estimate of approximately 15 million years being reasonable, consistent with the age of 12.81.0 million years deduced by Slesnick et al. (Sle02 (1992)) from photometry and moderate resolution spectroscopy. These estimates are similar to our adopted ages for NGC 3293 and NGC 4755. Strom et al. postulate that their projected rotational velocity distributions were present when the stars were formed. Hence given that the ages of NGC 3293 and NGC 4755 are comparable with that of the h and Persei sample, the differences in projected rotational velocity distributions cannot be explained by variations in the stellar ages of the samples.
The mean of the sin estimates for all the observed stars in our younger cluster NGC 6611 is 144 , which is lower than that for NGC 3293 and NGC 4755. In NGC 6611 there are measurements of 25 stars with masses less than 15M⊙ and 13 stars with masses between 15-60M⊙, with mean values of 192 and 116respectively. That for the lower mass group is in good agreement with those for both NGC 3293 and NGC 4755, where we should be sampling the same stellar mass range albeit at a different age. For the massive stars, evolutionary models (Meynet & Maeder 2000A&A…361..101M (2000); Heger & Langer Heg00 (2000)) predict that initial rotational velocities of 300are reduced to between 60-200during the main-sequence phase due to angular momentum loss via their winds, with the most massive luminous objects showing the most pronounced effect. The fact that we find a lower mean value of for the more massive stars supports the existence of this effect.
We can test this hypothesis in a simple and illustrative way. For the 13 stars in the 15-60M⊙ range we assume that they had an initial rotational velocity of 250(see Sect. 4.5) and estimate the rotational velocity for each star after 2 Myrs (being our estimated age for NGC 6611) using the mass dependent evolution of surface equatorial velocities predicted by Meynet & Maeder (2000A&A…361..101M (2000)) and Heger & Langer (2000). This gives a mean equatorial velocity of 166 , and hence a mean sin value of 125 (assuming that the spin axes are randomly distributed). This is similar to the observed mean sin of 116, which suggests that an initial typical equatorial velocity of about 250and spin down according to the evolutionary models is consistent with that observed. We caution that this is an illustrative and simple comparison as it assumes a single value for the initial velocity and ignores any macroturbulent broadening in the atmospheres of the luminous objects.
The mean sin of the stars with masses less than 15M⊙in each of the three clusters is consistently around 190, which would suggest a mean equatorial velocity of 240(also see Section 4.5). The initial velocity of these objects is then likely to be in the range 250-300, depending on the evolution of the rotational velocity over the course of 2-15Myrs. At present this is uncertain for models less than 12M⊙, as there are no detailed published models for the evolution of the rotational velocity. For the 12-15M⊙ models, the rotational velocity does decrease during the first 1-2 Myrs but then remains effectively constant for the remainder of the main sequence lifetime. Hence it may be reasonable to compare the lower mass NGC 6611 targets with those in NGC 3293 and NGC 4755.
Recently Wolff et al. (Wol06 (2006)) have investigated the projected rotational velocities in a sample of very young stars with masses ranging from 0.2 to 50 M⊙. Their principal aim was to investigate the formation mechanism for high mass stars and in particular if it differed from that for lower mass stars. For the full range of spectral types they found that the ratio of the projected rotational velocity to the equatorial breakup velocity showed no significant variations. Assuming a random orientation of rotational axes, this led to a median value for the ratio of the rotational velocity to the equatorial breakup velocity, R, of 0.14, with values for B-type stars (M⊙) of 0.13 and for O-type stars (M⊙) of 0.20.
A similar analysis can be undertaken for our samples with the small age and presence of O-type stars making that for NGC 6611 the most appropriate. We have again assumed a random orientation of rotational axes and restricting our sample to stars that appear to be main sequence with log and obtain a ratio, R, of 0.22 for 27 targets. For our 7 O-type stars, the ratio is 0.16, whilst for the 20 B-type stars the ratio is 0.28. Hence our ratio for O-type stars is in good agreement with that of Wolff et al. but our B-type value is higher although given our relatively small sample size this may not be significant. For our combined B-type sample for older clusters NGC 3293 and NGC 4755, we obtain a far higher median estimate of 0.61 for 83 targets. The reason for this higher ratio is unclear, as our targets would not be expected to have evolved to higher rotational velocities during the clusters’ lifetimes. However it is consistent with the different mean velocities found for the three clusters and discussed above.
In summary for our older clusters, we confirm that the cluster stars show higher projected rotational velocities than their field star counterparts. However we do not reproduce the results of Strom et al. for h and Persei who found that the higher mass stars tend to rotate significantly more slowly than the lower mass objects. If their explanation of enhanced accretion causes the different behaviour between the cluster and field samples, then at least for NGC 3293 and NGC 4755 this mechanism is present for all B-type objects. The mean equatorial velocity of the most massive stars (15-60M⊙) in NGC 6611 is significantly less than the lower mass stars in this cluster and those in NGC 4755 and NGC 3293. This could be due to the more massive stars losing significant angular momentum through stellar winds during the first 2 Myrs of their lifetime but is also consistent with the rotational velocities found by Wolff et al. (Wol06 (2006)) for very young O-type stars.
4.5 The intrinsic rotational velocity distribution
The sample of stars for which we have reliable sin values is large enough that we may be able to model the intrinsic rotational velocity distribution by assuming that the inclination angle is randomly distributed in space. Following the formulation of Chandrasekhar & Münch (1950ApJ…111..142C (1950)), which is also discussed in Brown & Verschueren (1997A&A…319..811B (1997)), we employ the integral equation which relates the distribution, , of equatorial velocities, , for a sample of stars to the corresponding distribution of projected rotational velocities .
| (1) |
There are two distributions for which this equation can be integrated analytically. The first is a -function and the other is a uniform distribution in which all values of occur with equal probability upto a maximum velocity, . These analytic solutions are given in Chandrasekhar & Münch (1950ApJ…111..142C (1950)). We have also considered as an illustrative example a Gaussian function for and integrated the equation numerically in incremental steps of . Mokiem et al. (Mok06 (2006)) have discussed the distribution of rotational velocities for a sample of O-type stars in the SMC obtained during our FLAMES survey. They show that different choices for the distribution of rotational velocities, , can lead to similar distributions for the projected rotational velocities, (see Fig. 10 of their paper). Hence we stress that our adoption of a Gaussian distribution should only be considered illustrative and does not rule out the possibility that the actual distribution may be different.
In order to increase the statistical significance of the model fitting we have combined the projected rotational velocity distributions for the samples in NGC 4755 and NGC 3293. These two clusters are very similar in age, mass function, metallicity and total mass as discussed above. Hence we should have a sample of stars born in similar conditions and of a comparable age. This leads to a combined sample of 178 stars and the histogram of observed along with the corresponding CPFs can be compared with our different predictions for the projected rotational velocity distribution. We can confidently rule out the two analytical solutions of the -function, or the continuous distribution as they provide clearly inconsistent fits with the observed histogram and CPF as illustrated in Fig. 11. In Fig. 12, we show the predictions for an intrinsic rotational velocity distribution, , which is a Gaussian function with a peak of 225 and a half width, , of 110 (corresponding to a full-width-half-maximum, FWHM, of approximately 180 ). This is the best fit obtainable using a Gaussian profile, both from a subjective comparison and a test for a grid of possible solutions. A poorer subjective fit (with significantly higher ) is found when the peak of the Gaussian profile is changed by 25or the width, , by 20. As noted in Section 4.2, there are 7 stars which have evolutionary masses of between 7-40M⊙, and which have evolved significantly from the main-sequence. When these are removed from the sample, we get a slightly higher value of 250for the peak of the distribution and a similar width. Hence we believe that this is a reasonable solution for the rotational velocity distribution of stars in the range 3-15M⊙ at an age of approximately 15 Myrs in these two clusters. However with our methodology we cannot rule other distributions of a similar nature. For example Mokiem et al. (2006) show that a Gaussian function would give a similar model distribution as a rectangular function of similar width and that a very large number of observed stars would be required to definitively distinguish between the two input distributions. Although we cannot distinguish between such model distributions, or indeed other distributions of similar form, we can conclude that the underlying distribution must be a broad function with a centre and width similar to our best fit Gaussian. Additionally we were not able to exclude possible binaries from this sample. For example Brown & Verschueren (1997A&A…319..811B (1997)) and Huang & Gies (Hua05a (2005)) found that early-type stars with radial velocity variations on the whole rotated more slowly than the likely single star sample. Our observational time sampling is not extensive enough to determine likely binary fractions, although we should be able to identify binaries in our LMC and SMC clusters (Evans et al. 2006).
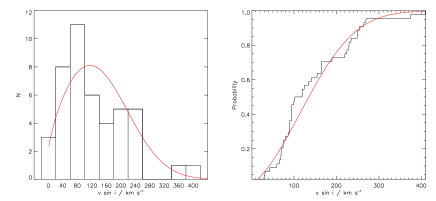
In Fig. 12 a similar analysis is shown for NGC 6611. Only forty four stars were included, which reduces the significance of the fit considerably. A model with a peak of 175and =100(FWHM 165 ) appears to be the best fit for a Gaussian distribution of rotational velocities. The mean rotational velocity is somewhat lower than that for the combined data for the older clusters, and we note that previous studies on the rotational velocities of O-type stars in the Galaxy (Howarth et al. 1997MNRAS.284..265H (1997), Penny 1996ApJ…463..737P (1996)) have indicated that rotational velocity distributions are peaked around 100. Indeed an analogous Gaussian fit to the unevolved sample of Penny (1996) gives a peak of 155and =100. Hence there is a suggestion that the more massive stars (15-60M⊙) in the Galaxy have typically smaller rotational velocity distributions than their lower mass counterparts (3-15M⊙). As discussed in Section 4.4 using a simple illustrative example, this can qualitatively be explained by the models of massive rotating stars losing significant angular momentum through strong stellar winds (Meynet & Maeder 2003A&A…404..975M (2003), Heger & Langer Heg00 (2000)).
 |
|
 |
 |
|
 |
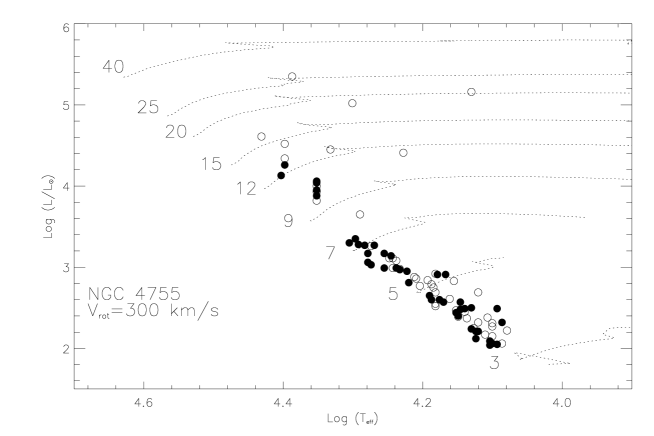
4.6 Comparison with stellar evolutionary models including rotation
The rotational velocity distributions found in the previous section suggest that we should compare our observational HR diagrams to stellar evolutionary calculations which include rotation. In Fig.13 we reproduce Fig 6, but with evolutionary tracks taken from Meynet & Maeder (2003A&A…404..975M (2003)) which have an initial rotational velocity on the ZAMS of 300(we are grateful to Georges Meynet for providing the lower mass tracks 3-7M⊙; these are unpublished at present and are computed without core overshooting). Meynet & Maeder point out that these models would correspond to average equatorial rotational velocities of between 180 and 240during the main sequence phase, which is well matched to our preferred solutions for the intrinsic rotational velocity distributions. For the higher mass stars we have truncated the tracks before they move bluewards towards the WR phase in order to aid clarity in the figures. The position of the ZAMS in NGC 3293 and NGC 4755 was significantly below the stellar positions for the non-rotating models as discussed in Section 4.2. The rotating models do provide somewhat better agreement, as the ZAMS moves towards lower effective temperature. The width of the main-sequence phase also increases for a rotating star which may help to explain the scattering of points above the ZAMS. However one would still expect the ZAMS to fit through the middle of the observed distribution rather than the lower envelope as observed and the cause of this is still unclear. If we were to use the rotating models to estimate the mass of the stars, we would obtain different values to those for the non-rotating models, but not in any simple scalable fashion. However the differences are at most 10%, and are not likely to influence the PDMF determinations.


5 Conclusions
We have analysed high resolution spectroscopy of targets in three Galactic clusters to estimate atmospheric parameters and projected rotational velocities. These have been used to derive stellar luminosities and evolutionary masses. Our principle conclusions are as follows:
-
1.
Atmospheric parameters have been deduced from non-LTE model atmosphere calculations and should be more reliable than those inferred from photometry or spectral types. Hence the observed HR-diagrams should be most the reliable yet determined for these clusters.
-
2.
A significant number of relatively cool low gravity objects have been identified and are found on average to have large projected rotational velocity. The low gravities may then reflect at least in part the significant centrifugal accelerations experienced by these stars.
-
3.
Observed Hertzsprung-Russell diagrams have been compared with theoretical predictions for both non-rotating and rotating models. The observed main sequence luminosities are in general larger than predicted. For NGC 6611, this may reflect non co-eval star formation. Other possible explanation include stellar rotation and the presence of a significant number of binary systems.
-
4.
Cluster ages have been deduced and some evidence for non-coeval star formation is considered especially for the young cluster NGC 6611. Indeed for none of the clusters does a single isochrone provide a good fit to the observed HR-diagram.
-
5.
Projected rotational velocities for targets in the older clusters, NGC 3293 and NGC 4755, have been found to be systematically larger than those for the field, confirming the conclusion of Strom et al. (Str05 (2005)) for h and Persei. Contrary to the finding of Strom et al., this phenomenon appears to be present at all the B-type spectral types present in our sample.
-
6.
The distribution of projected rotational velocities are consistent with a Gaussian distribution of current rotational velocities. For the relatively unevolved targets in the older clusters, NGC 3293 and NGC 4755, the peak of the velocity distribution would be 250with a full-width-half-maximum of approximately 180 . For NGC 6611, the corresponding values are 175and 165 .
-
7.
We find that the mean projected rotational velocity of stars which have strong winds (15-60M⊙) is lower than that of the lower mass stars. This is consistent with predictions of the rotating models which show the spin-down effect due angular momentum loss through stellar winds.
-
8.
For all three clusters we deduce present day mass functions with -values in the range -1.5 to -1.8.
Acknowledgements.
We thank the referee, Steven Strom, for his valuable and constructive comments on an earlier version of this paper. We are grateful the staff at both Paranal and La Silla for their invaluable assistance with the observational programme. We also thank Jonanthan Smoker and Roheid Mokiem for discussions on rotational velocities and Georges Meynet for access to some of the low mass rotating models in advance of publication. CJE and JKL acknowledge financial support from the UK Particle Physics and Astronomy Research Council (PPARC) under grants PPA/G/S/2001/00131 and PPA/G/O/2001/00473 and IH acknowledges financial support from the Northern Ireland Department of Education and Learning. AH, CAT and DJL thank the Spanish Ministerio de Educación y Ciencia for support under project PNAYA 2004-08271-C02-01. SJS acknowledges support from the ESF in the form of a EURYI award. This paper is based in part on observations made with the Isaac Newton and William Herschel telescopes, operated on the island of La Palma by the Isaac Newton Group in the Spanish Observatorio del Roque de los Muchachos of the Instituto de Astrofísica de Canarias.References
- (1) Abt, H. A., Levato, H., & Grosso, M. 2002, ApJ, 573, 359
- (2) Afflerbach, A., Churchwell, E., & Werner, M.W. 1997, ApJ, 478, 190
- (3) Balona, L.A. 1994, MNRAS, 268, 119
- (4) Balona, L.A., & Koen, C., 1994, MNRAS, 267, 1071
- (5) Baume G., Vasquez R.A., G. Carraro, & A. Feinstein, 2003, A&A, 402, 549
- (6) Belikov, A. N., Kharchenko, N. V., Piskunov, A. E., & Schilbach, E. 1999, A&AS, 134, 525
- (7) Bernacca, P.L., & Perinotto, M. 1974, A&A, 33, 443
- (8) Blecha, A., North, P., Royer, F., & Simond, G. 2003, BLDR Software - Reference Manual, 1st. edition
- (9) Brown, A. G. A., & Verschueren, W. 1997, A&A, 319, 811
- (10) Bouret, J.-C., Lanz, T., Hillier, D.J., et al. 2003, ApJ, 595, 1182
- (11) Chandrasekhar, S., Münch, G. 1950, ApJ, 111, 142
- (12) Chini, R., & Wargau, W.F. 1990, A&A, 227, 213
- (13) Crowther, P.A., Hillier, D.J., Evans, C.J., et al. 2003, ApJ, 579, 774
- (14) Crowther, P.A., Lennon, D.J., & Walborn, N.R. 2006, A&A, 446, 279
- Daflon & Cunha (2004) Daflon, S., & Cunha, K. 2004, ApJ, 617, 1115
- (16) Dufton, P.L., Smartt, S.J., & Hambly, N.C. 1999, A&AS, 139, 231
- (17) Elias, J. H., Frogel, J. A., & Humphreys, R. M. 1985, ApJS, 57, 91
- (18) Evans, C.J., Crowther P.A., Fullerton A. W., Hillier D. J., 2004, ApJ, 610, 1021
- (19) Evans, C.J., Smartt, S.J., Lee, J.K. & et al. 2005, A&A, 437, 467
- (20) Evans, C.J., et al. 2006, A&A, submitted
- (21) Dufton, P.L., Ryans, R.S.I., Trundle, C., Lennon, D.J., Hubeny, I., Lanz, T. & Allende Prieto, C. 2005, A&A,
- (22) Feast, M. W. 1958, MNRAS, 118, 618
- (23) Feast, M. W. 1963, MNRAS, 126, 111
- (24) Freyhammer, L.M., Hensberge, H., Sterken, C., et al. 2005, A&A, 429, 631
- (25) Gies, D.R., & lambert, D.L. 1992, ApJ, 387, 673
- (26) Girardi, L., Bressan, A., Bertelli, G., & Chiosi, C. 2000, A&AS, 141, 371
- (27) Gray D.F., 1992, The observation and analysis of stellar photospheres. Cambridge Univ. Press, 2nd ed., Cambridge.
- Gummersbach et al. (1998) Gummersbach, C. A., Kaufer, A., Schaefer, D. R., Szeifert, T., & Wolf, B. 1998, A&A, 338, 881
- (29) Heger, A., & Langer, N. 2000, ApJ, 544, 1016
- (30) Herrero, A., Puls, J., Najarro, F. 2002, A&A, 396, 949
- (31) Hillenbrand, L.A., Massey, P., Strom, S.E., & Merrill, K.M. 1993, AJ 106, 1906
- (32) Hillier, D.J.,Lanz, T., & Heap, S.R., et al. 2003, ApJ, 588, 1039
- (33) Hjorth, J., Sollerman, J., Moller, P., et al. Nature, 423, 847
- (34) Huang, W. Gies, D.R, 2005, 2005, ApJ, submitted, astro-ph/0510450
- (35) Howarth, I. D., Siebert, K. W., Hussain, G. A. J., & Prinja, R. K. 1997, MNRAS, 284, 265
- (36) Howarth, I.D., & Smith, K.C., 2001, MNRAS, 327, 353
- (37) Hubeny, I., 1988, Computer Physics Comm., 52, 103
- (38) Hubeny, I., & Lanz, T. 1995, ApJ, 439, 875
- (39) Hubeny, I., Heap, S.R., & Lanz, T., 1998, in ASP Conf. Series - Boulder-Munich: Properties of Hot, Luminous Stars, ed. I.D. Howarth, 131, 108
- (40) Hunter, I., Dufton, P.L., Smartt, S.J. et al, 2006, A&A, in preparation
- (41) Kaufer, A., Stahl, O., Tubbesing, S., & et al. 1999, The Messanger, 95, 8
- (42) Kaufer, A., Stahl, O., Prinja, R. K., & Witherick, D. 2006, A&A, 447, 325
- (43) Keller, S.C. 2004, Publ. Astron. Soc. Australia, 21, 310
- (44) Kudritzki, R.-P., & Puls, J. 2000, ARA&A, 38, 613
- (45) Kurucz, R. L. 2005, Memorie della Societa Astronomica Italiana Supplement, 8, 14
- (46) Lynga, G. 1987, 10 European Regional Astronomy Meeting of the IAU, Prague, Czechoslovakia, Proceedings. Volume 4 (A89-32590 13-90). Ondrejov, Czechoslovakia, Czechoslovak Academy of Sciences 121
- (47) Maeder A., & Meynet G., 1991, A&AS, 89, 451
- (48) Maeder A., & Meynet G., 2000, A&A, 361, 159
- (49) Maeder A., & Meynet G., 2001, A&A, 373, 555
- (50) Martayan C., Frémat, Y, Hubert, A. M., Floquet, M., Floquet M., Zorec, J., Neiner, C., 2006, A&A, astro-ph/0601240
- (51) Massey, P., Johnson, K. E., & De gioia-Eastwood, K. 1995, ApJ, 454, 151
- (52) McErlean, N. D., Lennon, D. J., & Dufton, P. L. 1999, A&A, 349, 553
- (53) Massey, P., Parker, J. W., & Garmany, C. D. 1989, AJ, 98, 1305
- (54) Meynet, G., Maeder A., Schaller, G., Schaerer, D., & Charbonnel, G. 1994, A&AS, 103, 97
- (55) Meynet, G., & Maeder, A. 2000, A&A, 361, 101
- (56) Meynet, G., & Maeder, A. 2003, A&A, 404, 975
- (57) Mokiem, M.R., de Koter, A., Evans, C.J., & et al. 2006, A&A submitted
- (58) Penny, L. R. 1996, ApJ, 463, 737
- (59) Pasquini, L., Avila, G., Blecha, A., & et al. 2002, The Messenger, 110, 1
- (60) Puls, J., Urbaneja, M.A., Venero, R., & et al. 2005, A&A, accepted
- (61) Rix, S., Pettini, M., Leitherer, C., et al. 2004, ApJ, 615, 98
- (62) Rolleston, W. R. J., Smartt, S. J., Dufton, P. L., & Ryans, R. S. I. 2000, A&A, 363, 537
- (63) Ryans, R.S.I., Dufton, P.L., Rolleston, W.J.R., Lennon, D.J., Keenan, F.P., et al. 2002, MNRAS, 336, 577
- (64) Ryans, R.S.I., Dufton, P.L., Mooney, C.J., Rolleston, W.J.R., Keenan, F.P., et al. 2003, A&A, 401, 1119
- (65) Sagar, R., & Cannon, R.D. 1995, A&AS, 111, 75
- (66) Sanner, J., Bruzendorf, J., Will, J.-M., & Geffert, M. 2001, A&A, 369, 511
- (67) Scalo, J. M. 1986, Fundamentals of Cosmic Physics, 11, 1
- (68) Schaller G., Schaerer D., Meynet G., & Maeder A. 1992, A&AS 96, 269
- (69) Shobbrook, R.R. 1983, MNRAS, 205, 1215
- (70) Slesnick, C.L., Hillenbrand, L.A., & Massey, P. 2002, ApJ, 576, 880
- (71) Smartt, S.J., Maund, J.R., Hendry, M.A., et al. 2004, Science, 303, 499
- (72) Strom, S.E., Wolff, S.C., & Dror, D.H.A., 2005, ApJ, 129, 809
- (73) Townsend, R. H. D. 1997, MNRAS, 284, 839
- (74) Trundle, C., Lennon, D.J., Puls, J., & Dufton, P.L. 2004, A&A, 417, 217
- (75) Trundle, C., & Lennon, D.J. 2005, A&A, in press
- (76) Vacca, W.D., Garmany, C.D., & Shull, M.J. 1996, ApJ, 460, 914
- (77) Válquez, G.A., Leitherer, C., Heckmann, T.M., et al., 2004, ApJ, 600, 162
- (78) Vink, J.S., de Koter. A., Lamers, H.J.G.L.M. 2001, A&A, 269,574
- (79) Walborn, N.R., Morrell, N.I., Howarth, I.D., et al., 2004, ApJ, 608, 1028
- (80) Wolff, S.C., Edwards, S., & Preston, G.W. 1982, ApJ, 252, 322
- (81) Wolff, S.C., Strom, S.E., Drod, D., Lanz, L, & Venn, K., 2006, ApJ in press
[x]lccccccccccrrr Physical parameters for NGC 3293: , and spectral types are from Paper I; Atmopheric parameters (, log ) and projected rotational velocities ( sin ) were estimated using the methodologies discussed in Sect. 3. The specific method used to detemine the atmospheric parameters are designated as follows — He: from neutral helium and hydrogen equivalent widths; He+: from ionized helium, Si iii/Si iv ionization equilibrium and hydrogen line profiles; A: adopted; I: interpolated. The radial velocities () are taken from Paper I, whilst the distances from the cluster centre, , are in arcminutes.
ID Sp. Type log Method sin log Mass
mag. K cm s-2
\endheadcontinued on next page
\endfoot\endlastfoot3293-001 6.52 0.00 B0 Iab 27500 3.10 Si 80 0.22 5.55 40 0 0.00
3293-002 6.73 0.07 B0.7 Ib 23000 2.80 Si 100 0.27 5.35 29 7 2.11
3293-003 7.61 0.11 B1 III 21100 2.90 Si 80 0.30 4.95 18 16 0.82
3293-004 8.03 0.02 B1 III 21500 3.00 A 105 0.21 4.69 14 21 1.11
3293-005 8.12 0.08 B1 III 21500 3.05 A 195 0.27 4.73 15 8 1.47
3293-006 8.21 0.07 B1 III 21500 3.15 A 200 0.26 4.68 14 10 1.59
3293-007 8.25 0.18 B1 III 22800 3.10 Si 65 0.38 4.87 17 16 4.74
3293-008 8.59 0.05 B1 III 21500 3.25 A 140 0.24 4.50 13 57 2.09
3293-010 8.77 0.00 B1 III 21000 3.15 Si 70 0.18 4.34 11 16 1.35
3293-012 8.95 0.06 B1 III 21500 3.30 A 100 0.25 4.37 12 28 2.34
3293-013 9.030.04 B1 III 21500 3.40 A 105 0.15 4.22 11 60 2.53
3293-014 9.09 0.19 B0.5 IIIn 23500 3.60 : em 290: 0.40 4.59 14.8 50 1.53
3293-015 9.110.01 B1 V 25000 3.80 A 260 0.21 4.40 13.5 16 0.88
3293-016 9.21 0.03 B2.5 V 19200 4.00 He 110 0.20 4.09 9.5 14 0.79
3293-017 9.22 0.04 B1 V 25000 3.90 A 145 0.26 4.42 13.7 4 1.45
3293-018 9.260.04 B1 V 22500 3.70 Si 26 0.16 4.18 11.1 7 1.57
3293-019 9.270.04 B1 V 25000 3.85 A 120 0.18 4.30 12.7 17 0.92
3293-020 9.55 0.03 B1.5 III 20500 3.15 I 60 0.21 4.04 9 16 2.86
3293-021 9.85 0.03 B1.5 III 20500 3.15 I 230 0.21 3.92 9 8 0.80
3293-022 9.97 0.12 Be (B0.5-1.5n) 23500 4.25 A 280 0.33 4.15 11.2 20 2.94
3293-023 10.010.05 B1.5 III 20500 3.40 I 160 0.13 3.76 8 10 1.38
3293-024 10.010.01 B1.5 III 20500 3.50 I 135 0.17 3.81 8 14 3.42
3293-025 10.01 0.00 B2 III 21100 3.70 He 215 0.19 3.85 8.9 18: 1.20
3293-026 10.160.02 B2 III 19900 3.65 He 30 0.15 3.70 7.9 21 2.16
3293-027 10.22 0.07 Be (B0.5-1.5n) 23500 3.75 A 315 0.27 3.98 10 13 1.33
3293-028 10.26 0.01 B2 V 19400 3.65 He 215 0.18 3.66 7.7 10 1.24
3293-029 10.320.01 B0.5-B1.5 Vn 25000 4.20 A 370 0.21 3.92 10.5 8 2.40
3293-030 10.510.04 B2 V 19800 3.70 He 205 0.13 3.52 7.3 7 1.28
3293-031 10.66 0.05 B2 V 17400 3.45 He 230 0.21 3.42 7 7 2.22
3293-032 10.69 0.01 B0.5-B1.5 Vn 25000 4.30 A 365 0.23 3.80 10.0 0 0.79
3293-033
10.72 0.66 B8 III 12300 3.30 He 120 0.78 3.75 … 8 9.99
3293-034 10.74 0.11 B2 IIIh 26100 4.25 He 120 0.34 3.95 11.1 16 1.44
3293-035 10.81 0.09 B2 V 20600 3.80 He 250 0.27 3.61 7.8 9 10.11
3293-037 10.94 0.04 B2 V 20800 3.95 He 70 0.22 3.51 7.5 12: 3.05
3293-038 11.000.04 B2.5 V 20600 3.95 He 235 0.14 3.38 7.1 13: 6.32
3293-040 11.21 0.05 Be (B3n) 18100 3.65 He 335 0.21 3.24 6.1 12 0.76
3293-041 11.22 0.04 B2.5 V 20600 4.00 He 205 0.22 3.39 7.1 12 1.21
3293-043 11.32 0.07 B3 V 17900 4.05 He 14 0.22 3.21 5.9 0 2.81
3293-045 11.42 0.32 Be (B1-2n) 21600 3.70 He 375 0.51 3.71 8.5 18 5.19
3293-047 11.55 0.13 B2.5 V 19700 4.15 He 170 0.30 3.31 6.7 16 3.10
3293-048 11.56 0.16 B2.5 V 20500 4.05 He 180 0.34 3.40 7.1 12 3.18
3293-049 11.64 0.07 B2.5 V 18200 4.05 He 125 0.23 3.10 5.8 18 11.66
3293-050 11.69 0.05 B3 Vn 17200 3.75 He 355 0.20 2.99 5.3 12 1.80
3293-053 11.83 0.03 B3 V 16300 4.00 He 255 0.17 2.84 4.8 15 1.78
3293-056 11.91 0.00 B3 V 15100 3.45 He 240 0.14 2.69 4.5 2 5.23
3293-057 11.92 0.21 B3 V 16200 3.95 He 250 0.35 3.02 5.1 11 2.08
3293-059 12.00 0.29 B5 III-Vn 16500 3.90 He 355 0.43 3.11 5.4 0 4.98
3293-061 12.03 0.05 B5 V 15700 4.00 He 230 0.18 2.73 4.6 14 1.10
3293-062 12.03 0.15 B3 V 17900 4.20 He 24 0.30 3.02 5.6 62 3.91
3293-063 12.05 0.09 B5 V 16000 4.05 He 150 0.22 2.80 4.7 10 10.49
3293-065 12.06 0.14 B5 III-V 15100 3.70 He 150 0.26 2.79 4.5 18 9.13
3293-066 12.07 0.16 B5 V 14300 3.90 He 110 0.28 2.74 4.3 49: 2.16
3293-067 12.11 0.32 B3 V 16300 4.00 He 185 0.46 3.08 5.3 18: 3.82
3293-069 12.22 0.07 B5 V 15300 4.00 He 205 0.20 2.65 4.3 16 3.32
3293-070
12.22 0.14 B5 III-V 14300 3.70 He 265 0.26 2.65 4.1 12 9.42
3293-073 12.25 0.11 B6-7 V 13700 3.90 He 160 0.22 2.55 3.9 16 1.47
3293-074 12.28 0.09 B8 III 11700 3.60 He 70 0.17 2.33 3.3 16: 3.65
3293-075 12.29 0.12 B5 IIIn 15600 3.85 He 335 0.25 2.71 4.5 11 5.07
3293-077 12.32 0.20 B6-7 V 13800 3.95 He 36 0.31 2.65 4.0 1 7.06
3293-080 12.36 0.14 B5 V 15300 4.05 He 255 0.27 2.68 4.4 20 6.93
3293-082 12.40 0.21 B5 III 16500 4.00 He 300 0.35 2.85 4.9 8: 8.24
3293-084 12.48 0.11 B5 V 14400 3.95 He 295 0.23 2.52 4.0 17 1.78
3293-085 12.49 0.13 B5 V 14500 3.75 He 320 0.25 2.55 4.1 10 7.26
3293-086 12.52 0.16 B5 V 14700 4.10 He 130 0.28 2.59 4.1 13: 6.68
3293-087 12.60 0.04 B5 V 14200 3.75 He 120 0.15 2.37 3.8 14 5.92
3293-089 12.64 0.15 B8 III 12800 4.00 He 70 0.25 2.37 3.5 13 11.75
3293-090 12.67 0.31 B6-7 V 13800 4.35 He 170 0.42 2.64 4.0 11 2.58
3293-093 12.71 0.14 B6-7 V 14400 4.55 He 110 0.26 2.47 3.9 12 1.86
3293-094 12.71 0.20 B5 V 14800 4.15 He 30 0.32 2.58 4.1 34: 3.90
3293-095 12.72 0.13 B6-7 V 14100 4.20 He 305 0.24 2.42 3.8 18 3.10
3293-096 12.74 0.23 B6-7 III 13600 3.75 He 285 0.34 2.50 3.8 12: 6.14
3293-097 12.75 0.13 B6-7 III 13900 3.80 He 275 0.24 2.40 3.8 10 3.94
3293-098 12.75 0.14 B8 III-V 13300 4.20 He 32 0.24 2.35 3.6 13 0.53
3293-099 12.78 0.18 B5 Vn 13800 3.70 He 260 0.29 2.44 3.8 14 8.51
3293-100 12.81 0.14 B6-7 III-Vn 13800 3.90 He 335 0.25 2.38 3.7 15: 2.85
3293-104 12.88 0.11 B6-7 V 13800 4.10 He 250 0.22 2.31 3.7 8: 1.27
3293-105 12.89 0.19 B8 III-V 12400 4.00 He 80 0.28 2.28 3.4 11 1.94
3293-106 12.90 0.08 B6-7 V 13100 3.75 He 235 0.18 2.20 3.4 22 1.26
3293-107 12.91 0.22 B8 III-V 12900 4.05 He 60 0.32 2.35 3.5 11 3.68
3293-108 12.92 0.13 B6-7 V 12900 3.80 He 200 0.23 2.24 3.4 6 8.18
3293-109 12.92 0.15 B5 V 13900 3.80 He 150 0.26 2.35 3.7 11 3.86
3293-111 12.96 0.16 B6-7 III-V 13100 3.85 He 255 0.26 2.28 3.5 13 2.30
3293-113 13.04 0.14 B6-7 V 13000 3.95 He 280 0.24 2.21 3.4 16 1.71
3293-114 13.07 0.25 B6-7 III-V 13800 3.90 He 260 0.36 2.41 3.7 15 6.53
3293-115 13.11 0.14 B8 III-V 12700 4.10 He 170 0.24 2.16 3.3 13 1.73
3293-116 13.12 0.11 B6-7 V 13000 3.90 He 260 0.21 2.14 3.4 14 1.81
3293-117 13.15 0.14 B8 III-V 13200 3.95 He 34 0.24 2.19 3.4 8 3.67
3293-118 13.17 0.06 B8 III-V 12100 3.95 He 205 0.15 1.98 3.1 10 10.06
3293-120 13.20 0.33 B5 V 14600 4.10 He 245 0.45 2.52 4.0 12: 10.11
3293-123 13.26 0.20 B8 III 12400 3.85 He 275 0.29 2.14 3.2 27 1.09
3293-124 13.28 0.21 B8 III 13200 3.95 He 235 0.31 2.22 3.5 9 8.29
3293-125 13.29 0.10 B8 III-V 12300 3.95 He 210 0.19 2.00 3.1 14: 0.72
[x]lccccccccccrrr Physical parameters for NGC 4755. The columns and sources of information are as for Table The VLT-FLAMES Survey of Massive Stars: Stellar parameters and rotational velocities in NGC 3293, NGC 4755 and NGC 6611.
ID Sp. Type log Method sin log Mass
mag. K cm s-2
\endheadcontinued on next page
\endfoot\endlastfoot4755-001 5.77 0.32 B9 Ia 13500 2.00 He 38 0.44 5.04 20 16 2.85
4755-002 5.98 0.22 B3 Ia 16300 2.25 Si 70 0.37 5.18 23 10 1.53
4755-003 6.80 0.24 B2 III 24400 3.40 He 38 0.45 5.35 30 21 3.01
4755-004 6.92 0.20 B1.5 Ib 20000 2.75 Si 75 0.38 5.02 20 19 0.32
4755-005 7.96 0.20 B2 III 16900 2.80 He 110 0.36 4.41 12 53 2.05
4755-006 8.37 0.14 B1 III 21500 3.15 A 100 0.33 4.45 13 20 2.68
4755-007 8.58 0.11 B1 V 25000 3.70 A 170 0.33 4.52 14.5 12 1.88
4755-008 8.6l 0.14 B0.5 V 27000 3.65 A 170 0.37 4.61 16.1 2 0.48
4755-009 9.01 0.11 B1 V 25000 3.90 A 115 0.33 4.34 13.0 15 4.00
4755-010 9.38 0.16 B1 V 25000 4.10 A 180 0.38 4.26 12.4 0 1.71
4755-011 9.58 0.17 B1.5 V 22500 4.10 I 22 0.37 4.06 10.4 24 1.12
4755-012 9.60 0.16 B1.5 V 22500 4.00 I 140 0.36 4.04 10.3 55 1.81
4755-013 9.68 0.15 B1.5 V 22500 3.90 I 190 0.35 4.00 10.0 3 2.13
4755-015 9.74 0.16 B1 V 25300 4.00 Si 48 0.38 4.13 11.6 18 2.76
4755-016 9.76 0.12 B1.5 V 22500 3.80 I 195 0.32 3.93 9.7 8 1.00
4755-017 9.90 0.18 B1.5 V 22500 4.10 I 75 0.38 3.95 9.8 15 2.94
4755-019 10.04 0.17 B1.5 V 22500 4.10 I 80 0.37 3.88 9.4 20 5.57
4755-020 10.05 0.13 B2 V 19500 3.80 He 38 0.30 3.65 7.7 27 6.68
4755-021 10.29 0.20 B1.5 Vn 22500 3.80 I 300 0.40 3.82 9.2 11 3.26
4755-022 10.89 0.12 B2.5 Vn 18800 3.70 He 300 0.28 3.26 6.3 18 1.83
4755-023 10.99 0.18 B2 V 19800 3.95 He 120 0.35 3.35 6.8 26 1.85
4755-025 11.02 0.14 B2.5 V 19600 3.95 He 235 0.31 3.28 6.6 20 4.75
4755-026 11.19 0.24 B2.5 V 18600 3.95 He 205 0.40 3.27 6.3 15 0.97
4755-027 11.21 0.17 B2.5 Vn 17700 3.80 He 210 0.32 3.11 5.7 18 1.05
4755-029 11.23 0.19 B2 V 20200 4.00 He 190 0.37 3.30 6.8 19 3.02
4755-030 11.31 0.21 B2.5 Vn 17500 3.70 He 330 0.36 3.11 5.6 35 3.66
4755-031 11.34 0.24 B2.5 V 18000 3.95 He 150 0.40 3.17 5.9 20 7.13
4755-032 11.35 0.19 B2.5 V 19000 4.00 He 195 0.36 3.17 6.1 13 3.68
4755-033 11.35 0.24 B3 V 17600 4.00 He 75 0.39 3.14 5.7 19 1.76
4755-034 11.39 0.23 B3 V 15200 3.85 He 265 0.36 2.92 4.8 19 2.91
4755-035 11.41 0.23 B5 V 15100 3.95 He 190 0.35 2.91 4.7 31 0.11
4755-036 11.45 0.16 B3 Vn 17500 3.75 He 330 0.31 2.99 5.4 29 2.40
4755-037 11.48 0.13 B2.5 V 18800 4.05 He 195 0.29 3.03 5.8 19 3.74
4755-038 11.54 0.16 B3 Ve 15400 3.60 He 115 0.29 2.79 4.6 19 2.72
4755-039 11.54 0.16 B2.5 V 18000 4.00 He 235 0.32 2.99 5.5 23 1.24
4755-040 11.54 0.32 B2.5 V 19200 4.10 He 65 0.49 3.27 6.4 20 10.04
4755-041 11.58 0.21 B3 V 17100 4.00 He 165 0.36 2.97 5.3 16 0.96
4755-042 11.58 0.29 B3 Vn 17300 3.80 He 345 0.44 3.08 5.5 14 3.11
4755-043 11.59 0.22 B3 V 16700 4.10 He 125 0.36 2.95 5.1 29 1.48
4755-044 11.59 0.28 B5 V 14300 3.60 He 265 0.40 2.83 4.4 12 8.80
4755-045 11.61 0.22 B3 V 17300 3.95 He 245 0.37 2.99 5.3 17 1.25
4755-046 11.62 0.20 B3 Vn 16300 3.65 He 325 0.34 2.88 4.9 29: 3.80
4755-047 11.62 0.23 B3 V 17100 3.90 He 280 0.38 2.98 5.3 20 1.97
4755-048 11.63 0.19 B3 V 19000 4.15 He 55 0.36 3.06 5.9 20 4.42
4755-049 11.65 0.34 B5 V 14700 4.00 He 140 0.46 2.91 4.7 36: 8.46
4755-051 11.75 0.23 B3 Vn 16200 3.75 He 320 0.37 2.86 4.9 28 2.25
4755-052 11.77 0.17 B3 V 16600 4.00 He 165 0.31 2.81 4.9 20 4.71
4755-053 11.78 0.18 B3 Vn 16000 3.80 He 305 0.31 2.77 4.7 22 2.96
4755-054 11.78 0.19 B3 V 15300 3.45 He 110 0.33 2.75 4.7 20 3.98
4755-056 11.86 0.29 B3 Vn 15600 3.75 He 300 0.42 2.84 4.7 22 1.25
4755-057 11.94 0.36 B6-7 III-Ve 13200 3.65 He 235 0.46 2.69 4.0 44: 8.45
4755-058 12.07 0.26 B3 Vn 15200 3.75 He 320 0.39 2.69 4.4 28 0.98
4755-060 12.12 0.19 B5 V 15400 4.05 He 145 0.32 2.60 4.3 19 3.77
4755-061 12.15 0.25 B5 V 14500 3.30 He 6 0.39 2.61 4.3 20 3.73
4755-062 12.18 0.28 B6-7 III-V 14000 4.00 He 200 0.39 2.57 4.0 14 3.13
4755-063 12.18 0.33 B8 V 12400 4.20 He 235 0.42 2.49 3.6 32 5.72
4755-064 12.22 0.27 B6-7 V 13500 4.30 He 160 0.38 2.50 3.8 23 1.05
4755-065 12.25 0.18 B3 V 15200 3.70 He 105 0.31 2.52 4.2 22 5.82
4755-066 12.25 0.27 B3 V 15500 4.10 He 165 0.40 2.65 4.4 24 11.21
4755-067 12.28 0.24 B5 V 14000 4.05 He 290 0.35 2.48 3.9 23 2.73
4755-068 12.31 0.27 B3 Vn 14800 3.95 He 270 0.39 2.57 4.1 20 0.22
4755-069 12.31 0.28 B5 V 15000 4.10 He 185 0.40 2.60 4.2 17 2.16
4755-070 12.32 0.23 B3 V 15200 3.60 He 175 0.36 2.55 4.2 24 3.75
4755-072 12.43 0.24 B5 V 14200 4.10 He 100 0.35 2.44 3.9 19 1.59
4755-074 12.47 0.29 B5 III-V 13800 3.50 He 120 0.40 2.45 3.8 36: 2.58
4755-075 12.52 0.24 B5 III-V 14100 3.55 He 115 0.35 2.39 3.8 22 1.71
4755-076 12.58 0.36 B5 V 13800 3.95 He 190 0.47 2.49 3.8 18 0.43
4755-077 12.59 0.32 B6-7 III 12800 3.25 He 170 0.44 2.38 3.8 27 2.26
4755-078 12.60 0.32 B5 Vn 14200 3.90 He 315 0.43 2.47 3.9 23 9.62
4755-079 12.62 0.28 B5 V 13700 3.85 He 250 0.39 2.37 3.7 20 2.41
4755-080 12.62 0.35 B8 III-V 12200 3.95 He 220 0.44 2.32 3.4 19 3.86
4755-081 12.63 0.28 B6-7 IIIn 13200 3.65 He 285 0.38 2.32 3.5 18 1.67
4755-082 12.65 0.30 B8 III-V 12000 3.80 He 245 0.39 2.22 3.2 25 2.93
4755-087 12.81 0.25 B8 III 13500 4.10 He 280 0.36 2.24 3.5 19 1.18
4755-088 12.83 0.25 B8 IIIn 12900 3.80 He 260 0.35 2.17 3.4 24 6.34
4755-089 12.84 0.36 B8 III 12600 3.35 He 160 0.48 2.31 3.6 19 6.94
4755-090 12.88 0.27 B8 IIIn 12600 3.65 He 290 0.36 2.15 3.3 16 2.39
4755-091 12.90 0.37 B8 III 14100 4.40 He 50 0.48 2.40 3.8 20 4.11
4755-093 12.91 0.28 B8 III-V 13200 4.35 He 190 0.38 2.21 3.4 29 1.09
4755-094 12.93 0.31 B8 III 13400 3.80 He 90 0.41 2.25 3.5 30 4.52
4755-095 12.96 0.20 B8 III 12700 4.00 He 225 0.30 2.04 3.2 22 5.51
4755-096 12.96 0.29 B8 III 13300 4.25 He 180 0.39 2.21 3.5 13 1.48
4755-098 13.00 0.25 B8 IIIn 12700 3.95 He 280 0.35 2.09 3.3 20 3.93
4755-099 13.01 0.41 B8 III 12600 3.75 He 250 0.50 2.27 3.4 20 9.25
4755-100 13.09 0.26 B8 III 13300 4.40 He 220 0.36 2.12 3.4 15 1.09
4755-106 13.16 0.32 B8 III 12200 3.80 He 290 0.41 2.06 3.1 18 9.89
4755-107 13.18 0.29 B8 III-V 12600 4.10 He 165 0.38 2.06 3.2 20 2.43
4755-108 13.22 0.31 B8 III-V 12400 4.05 He 165 0.40 2.05 3.2 22 3.70
[x]lccccccccccrrr Physical parameters for NGC 6611. The columns and sources of information are as for Table The VLT-FLAMES Survey of Massive Stars: Stellar parameters and rotational velocities in NGC 3293, NGC 4755 and NGC 6611.
ID Sp. Type log Method sin log Mass
mag. K cm s-2
\endheadcontinued on next page
\endfoot\endlastfoot6611-001 8.18 0.34 B0 III 32000 3.60 He+ 142 0.60 5.39 40 86 13.17
6611-002 8.18 0.43 O4 III((f+)) 41500 3.90 He+ 102 0.71 5.86 63 14 1.29
6611-003 8.73 0.45 O6-7 V((f)) 40000 3.90 He+ 87 0.73 5.63 50 17 1.08
6611-004 8.90 0.04 O8.5 V 37000 4.00 He+ 76 0.32 4.85 24.0 23 4.18
6611-005 9.13 0.44 O8 III 36000 3.80 He+ 90 0.71 5.32 25 5 29.49
6611-006 9.39 0.24 O9.7 IIIp 34000 4.10 He+ 43 0.51 4.84 21.9 1 4.04
6611-008 9.46 0.82 O7 II(f) 36000 3.50 He+ 100 1.09 5.75 60 15 1.79
6611-010 9.75 0.49 B1: e – – He 225 4 12.22
6611-011 9.85 0.58 O9 V 36000 4.20 He+ 66 0.85 5.24 29.5 17 1.54
6611-012 9.85 0.48 B0.5 V 27000 4.00 Si 75 0.71 4.70 17.0 14 3.75
6611-015 10.12 0.43 O9.5 Vn 32500 3.90 He+ 410 0.69 4.77 20.3 23: 0.72
6611-017 10.37 0.57 O9 V 36000 3.95 He+ 95 0.84 5.02 25.6 19 2.54
6611-018 10.56 0.35 B8 III 12900 3.90 He 90 0.45 3.28 … 16 9.34
6611-019
10.68 0.36 B1.5 V 22500 3.85 I 235 0.56 3.96 9.8 47 12.12
6611-020 10.69 0.40 B0.5 Vn 27000 4.10 A 220 0.63 4.24 13.0 20 6.17
6611-021 10.80 0.47 B1 V 26300 4.25 Si 32 0.70 4.27 12.9 18 0.30
6611-022 10.98 0.82 Herbig Be – – He 375 0.46
6611-023 10.99 0.41 B3 V 14600 3.35 He 165 0.55 3.38 … 19: 7.37
6611-025 11.20 0.59 B1 V 25000 4.10 A 95 0.81 4.23 12.2 8 0.73
6611-027 11.26 0.45 B1 V 25000 4.10 A 255 0.67 4.00 10.9 0 2.85
6611-029 11.29 1.05 O8.5 V 36000 3.85 He+ 135 1.32 5.37 35 6 4.53
6611-032 11.48 0.36 B1.5 V 22500 4.15 I 70 0.56 3.64 8.5 4 7.46
6611-033 11.47 0.56 B1 V 25600 4.00 Si 30 0.78 4.11 11.7 8 1.07
6611-034 11.47 0.55 B8 III 13600 4.05 He 60 0.66 3.28 … 18 7.76
6611-035 11.51 0.75 B0.5 V 27000 4.10 A 120 0.98 4.44 14.5 16 1.62
6611-038 11.63 0.47 B5 IIIn 13600 3.30 He 250 0.60 3.13 … 15 9.78
6611-040 11.73 0.38 B5 V 15800 4.20 He 250 0.51 3.11 5.3 30 4.89
6611-041 11.72 0.45 B5 V 14100 3.75 He 90 0.56 3.08 4.9 6 10.64
6611-042 11.78 0.50 B1.5 V 22500 3.90 I 155 0.70 3.73 8.8 14 1.41
6611-045 12.02 1.05 O9 V 35000 4.00 He+ 25 1.32 5.04 25.4 6 11.35
6611-048 12.09 0.48 B2.5 V 17900 4.00 He 230 0.63 3.28 6.1 8 9.34
6611-052 12.16 0.60 B2 V 19200 3.85 He 120 0.77 3.53 7.1 7 1.39
6611-056 12.36 0.52 B8 III 13500 4.35 He 70 0.63 2.87 4.4 21 6.84
6611-062 12.57 0.54 B3 V 18400 4.05 He 165 0.70 3.22 6.1 8 2.09
6611-063 12.59 0.95 B1.5 V 22500 4.00 I 95 1.15 4.08 10.5 7 6.65
6611-064 12.74 0.56 B3 V 15900 4.00 He 165 0.69 2.99 5.0 14 1.57
6611-066 12.79 0.64 B2 V 20800 4.20 He 80 0.82 3.44 7.3 50: 0.39
6611-069 12.86 0.42 B2.5 V 17800 4.15 He 190 0.57 2.88 5.3 17 6.62
6611-071 12.85 0.70 B2 Vn 20700 3.95 He 270 0.88 3.50 7.5 1 1.70
6611-072 12.90 0.51 B5 III 13700 3.60 He 230 0.62 2.66 4.0 23 2.73
6611-078 13.07 0.54 B3 V 18600 4.10 He 125 0.70 3.03 5.8 5 0.56
6611-080 13.00 1.39 O7 V((f)) 40000 4.00 He+ 95 1.67 5.33 38 16 3.50
6611-082 13.17 0.66 B1-3 V 20900 4.90 He 70 0.84 3.32 7.1 2 10.04
6611-085 13.30 0.50 B5 III 13100 3.05 He 265 0.62 2.46 3.9 5 2.43
Appendix A Finding charts for Galactic clusters
With the benefit of hindsight on the part of the authors, we now also include finding charts for the targets in the three Galactic clusters reported in Paper I. The NGC 6611 field is shown in Figure 14. The cores of NGC 3293 and NGC 4755 are fairly dense, so we show the central 7′ of each cluster in Figures 15 and 17, with the full fields shown in Figures 16 and 18.