Panchromatic Properties of 99,000 Galaxies
Detected by
SDSS, and (some by) ROSAT, GALEX, 2MASS, IRAS,
GB6, FIRST, NVSS and WENSS Surveys
Abstract
We discuss the panchromatic properties of 99,088 galaxies selected from the Sloan Digital Sky Survey Data Release 1 “main” spectroscopic sample (a flux-limited sample for 1360 deg2). These galaxies are positionally matched to sources detected by ROSAT, GALEX, 2MASS, IRAS, GB6, FIRST, NVSS and WENSS. The matching fraction varies from % for ROSAT and GB6 to 40% for GALEX and 2MASS. In addition to its size, the advantages of this sample are well controlled selection effects, faint flux limits and the wealth of measured parameters, including accurate X-ray to radio photometry, angular sizes, and optical spectra. We find strong correlations between the detection fraction at other wavelengths and optical properties such as flux, colors, and emission-line strengths. For example, 2/3 of SDSS “main” galaxies classified as AGN using emission-line strengths are detected by 2MASS, while the corresponding fraction for star-forming galaxies is only 1/10. Similarly, over 90% of galaxies detected by IRAS display strong emission lines in their optical spectra, compared to 50% for the whole SDSS sample. Using GALEX, SDSS, and 2MASS data, we construct the UV-IR broad-band spectral energy distributions for various types of galaxies, and find that they form a nearly one-parameter family. For example, the SDSS - and - band data, supplemented with redshift, can be used to “predict” -band magnitudes measured by 2MASS with an rms scatter of only 0.2 mag. When a dust content estimate determined from SDSS spectra with the aid of models is also utilized, this scatter decreases to 0.1 mag and can be fully accounted for by measurement uncertainties. We demonstrate that this interstellar dust content, inferred from optical SDSS spectra by Kauffmann et al. (2003a), is indeed higher for galaxies detected by IRAS and that it can be used to “predict” measured IRAS 60 m flux density within a factor of two using only SDSS data. We also show that the position of a galaxy in the emission-line-based Baldwin-Phillips-Terlevich diagram is correlated with the optical light concentration index and color determined from the SDSS broad-band imaging data, and discuss changes in the morphology of this diagram induced by requiring detections at other wavelengths. Notably, we find that SDSS “main” galaxies detected by GALEX include a non-negligible fraction (10-30%) of AGNs, and hence do not represent a clean sample of starburst galaxies. We study the IR-radio correlation and find evidence that its slope may be different for AGN and star-forming galaxies and related to the line strength ratio.
keywords:
surveys – galaxies: fundamental parameters – galaxies: active – galaxies: starburst – infrared: galaxies – radio continuum: galaxies – ultraviolet: galaxies – X-rays: galaxies.1 Introduction
The study of global galaxy properties has been recently invigorated by modern sensitive large-area surveys across a wide wavelength range. The Sloan Digital Sky Survey (SDSS, York et al. 2000, for more details see Appendix A1) stands out because it has already provided near-UV to near-IR five-color imaging data and high-quality spectra (R1800) for over 500,000 galaxies. The “main” spectroscopic galaxy sample is defined by a simple r-band flux limit (Strauss et al. 2002), and will include close to 1,000,000 galaxies.
A number of detailed galaxy studies based on SDSS data have already been published. Strateva et al. (2001) and Shimasaku et al. (2001) demonstrated a tight correlation between the color, concentration of the galaxy’s light profile, and morphology. Blanton et al. (2003) presented the SDSS galaxy luminosity function, and Kauffmann et al. (2003ab) determined and analyzed stellar masses and star-formation histories for 100,000 SDSS galaxies.
In addition to “stand-alone” studies based on only SDSS data, SDSS can be used as a cornerstone for panchromatic studies of galaxies aided by recent surveys at wavelengths outside the optical range (0.3-1 ). The special role of SDSS in such studies is due to its rich optical information, in particular high-quality spectra and photometry. Nevertheless, galaxies emit a substantial fraction of their bolometric flux outside the wavelength range accessible to SDSS. For example, in starburst and Seyfert 2 galaxies the mid/far-IR wavelength range is the most important contributor to the bolometric flux, e.g. Schmitt et al. (1997). Information obtained by other surveys offers important observational constraints for models of galaxy formation and evolution.
Numerous studies that utilize SDSS and surveys at other wavelengths have already been published. For example, Finlator et al. (2000) analyzed the properties of point sources detected by SDSS and Two Micron All Sky Survey (2MASS), and Ivezić et al. (2001a) discussed the colors and counts of SDSS sources detected by SDSS, 2MASS, and FIRST surveys. Ivezić et al. (2002) cross-correlated SDSS and the survey Faint Images of the Radio Sky at Twenty Centimeters (FIRST), and analyzed the optical and radio properties of quasars and galaxies. Bell et al. (2003) used SDSS and 2MASS data to estimate the baryonic mass functions of galaxies, and Anderson et al. (2003) studied the properties of AGN galaxies detected by SDSS and ROSAT. Best et al. (2005ab) studied radio galaxies, Chang et al. (2005) analyzed the SDSS-2MASS colors of elliptical galaxies, and Goto (2005) and Pasquali, Kauffmann & Heckman (2005) studied the optical properties of SDSS galaxies detected by IRAS. A detailed analysis of rest-frame colors in the Strömgren system synthesized from SDSS spectra was presented by Smolčić et al. (2006). They found that the galaxy distribution in the resulting color-color diagrams forms a very narrow locus with a width of only 0.03 mag. This finding agrees well with the conclusion by Yip et al. (2004), based on a principal component analysis of SDSS spectra, that galaxy spectra can be described by a small number of eigenspectra.
Here we cross-correlate the catalog of galaxies from SDSS Data Release 1 (Abazajian et al. 2003) with catalogs of sources detected by ROSAT (X ray), GALEX (UV), 2MASS (near-IR), IRAS (mid/far-IR), GB6 (6 cm), FIRST (20 cm), NVSS (20 cm), and WENSS (92 cm). References and a description of each survey are listed in Appendix A. The panchromatic galaxy samples discussed here are 10-100 times larger than those used in older pre-SDSS studies. In addition, they are selected by simple flux limits, and benefit from a wealth of accurately measured parameters including X-ray to radio photometry, angular sizes, and optical spectra. The main aim of this paper is to quantify the fraction and basic properties of SDSS “main” galaxies detected by other surveys using a uniform approach for all analyzed surveys. However, due to the size and quality of the resulting samples, even a simple, preliminary analysis presented here is sufficient to yield a wealth of additional results.
We describe our matching and analysis methods in Section 2. In Section 3 we discuss the detection fraction of SDSS galaxies by other surveys, and in Section 4 we present a preliminary analysis of some panchromatic properties of galaxies in our sample. We discuss and summarize our results in Section 5.
2 Matching and Analysis Methods
| Catalog | Wavelength | Matching distance [”] | All [absolute #] | False match probability [%] | False associations [%] | |
| SDSS | NUV-NIR | - | 99088 | - | - | |
| ROSAT RASS | X-ray | 30 | 267 | 0.056 | 8.9 | |
| GALEX | UV | 6 | 866 | 0.796 | 1.9 | |
| 2MASS XSC | near-IR | 1.5 | 19184 | 0.002 | ||
| IRAS FSC | far-IR | 30 | 1736 | 0.013 | ||
| GB6 | 6 cm | 20 | 132 | 0.003 | 14 | |
| FIRST | 20 cm | 3 | 3402 | 0.037 | 1.0 | |
| NVSS | 20 cm | 15 | 3478 | 0.291 | 8.3 | |
| WENSS | 92 cm | 20 | 363 | 0.227 | 9.1 | |
| Catalog | All [%] | No emission [%] | Emission [%] | AGN [%] | SF [%] | Unknown [%] |
| ROSAT RASS | 0.63 | 0.63 | 0.46 | 0.87 | 0.24 | 0.23 |
| GALEX | 42.0 | 24.1 | 67.7 | 27.9 | 82.1 | 93.3 |
| 2MASS XSC | 38.1 | 35.7 | 39.6 | 63.8 | 10.7 | 34.0 |
| IRAS FSC | 1.77 | 0.14 | 2.95 | 3.01 | 1.73 | 3.54 |
| GB6 | 0.22 | 0.15 | 0.09 | 0.21 | 0.02 | 0.02 |
| FIRST | 3.86 | 2.76 | 4.68 | 8.06 | 0.98 | 3.40 |
| NVSS | 3.51 | 2.85 | 3.52 | 5.02 | 1.66 | 3.25 |
| WENSS | 2.50 | 3.23 | 1.40 | 2.46 | 0.49 | 1.01 |
| SDSS [#/deg2] | 72.86 | 39.38 | 33.48 | 11.81 | 7.54 | 13.44 |
There are 99,825 unique galaxies in the Sloan Digital Sky Survey Data Release 1 “main” spectroscopic sample111The recent SDSS Data Release 4 contains spectra for 565,715 galaxies, see www.sdss.org, a sample limited by Petrosian magnitude, and covering 1360 deg2 (for more detailed description see Stoughton et al. 2002 and Strauss et al. 2002). We further restrict the sample by requiring the redshifts to lie in the range and obtain the sample of 99,088 galaxies analyzed here. For each galaxy, SDSS provides numerous properties measured from 5-color imaging data, such as astrometry, photometry, and morphological information, as well as high-quality spectra. In addition to standard spectroscopic parameters automatically measured by the spectroscopic pipeline, we also utilize emission line measurements described by Kauffmann et al. (2003a). We emphasize that the SDSS astrometry is very accurate (0.1 arcsec, Pier et al. 2002), which significantly simplifies the matching algorithm.
For each SDSS galaxy, we search for the two nearest neighbors in each of the eight catalogs. We accept the nearest neighbor as a true association if its distance is smaller than the catalog-dependent matching radius listed in Table 1. The matching radius for each catalog was determined by analyzing the distribution of distances between the quoted position in the catalog and the SDSS position, and corresponds to a cutoff222The distance distribution for the SDSS-NVSS sample is better fit by a sum of two Gaussians. However, this behavior has no significant consequence for the matching completeness and contamination.. Due to either high astrometric accuracy of other catalogs (e.g., 2MASS), or their low source surface density (e.g., IRAS), the matching contamination rate (fraction of false associations) is typically very low () at non-radio wavelengths and for the four radio surveys, as implied by both the source density in the matched catalogs, and the matching rate when SDSS positions are offset by 1 deg in declination. The fraction of cases where two sources in other catalogs are found within the matching radius is typically small (); in these cases we simply take the nearest neighbor to represent the true association. This fraction is sufficiently low that none of the conclusions presented in this paper change when both neighbors are excluded.
Before we proceed with the discussion of matching rate for each catalog, we describe our analysis methods in the next two sections.
2.1 The global optical properties of galaxies in the SDSS DR1 main spectroscopic sample
The first step in analyzing galaxies detected at other wavelengths is to compare their distribution in the optical parameter space to that for the whole SDSS sample. The parameters measured by by the SDSS photometric pipeline photo (Lupton et al. 2002) are numerous (100), and we limit our preliminary analysis to the distribution of galaxies in optical color-magnitude-redshift space.
2.1.1 Color-magnitude-redshift distributions
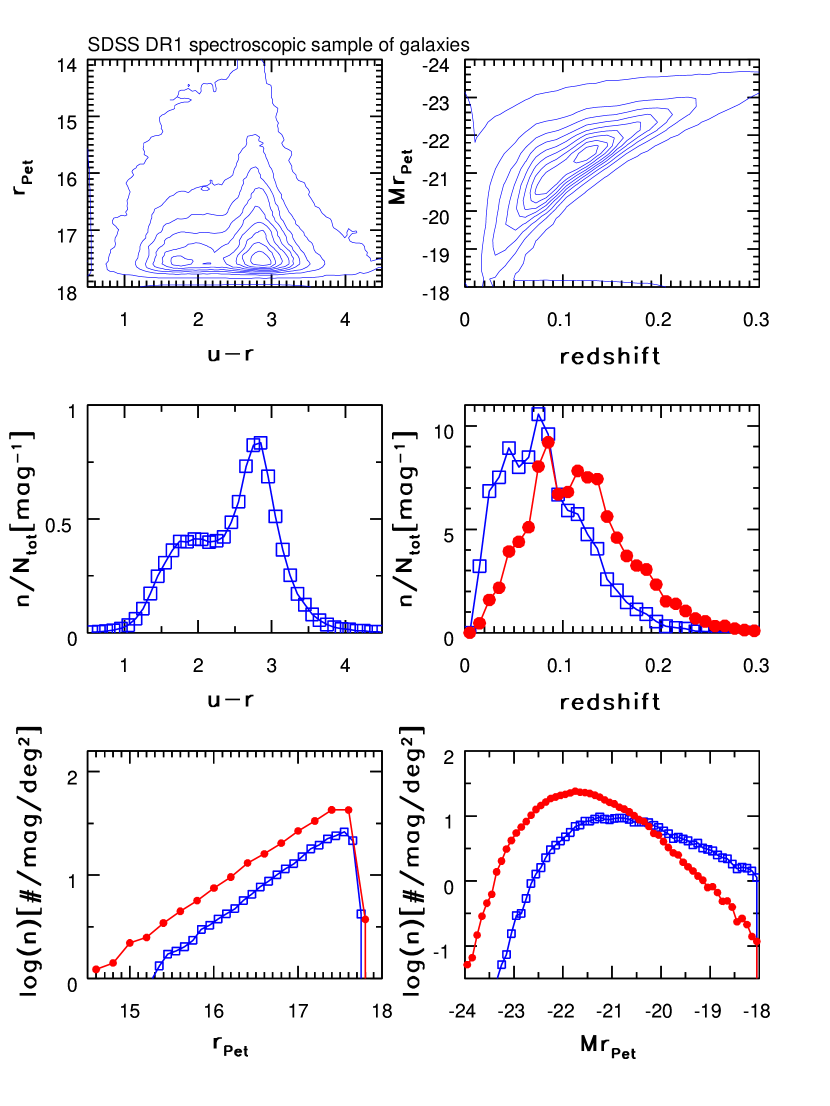
SDSS galaxies are not randomly distributed in the space spanned by apparent (or absolute) magnitude, color, and redshift. As shown by Strateva et al. (2001), and discernible in Fig. 1, galaxies show a bimodal color distribution (hereafter, optical SDSS colors are constructed using so-called “model” magnitudes; for details see Stoughton et al. 2002). Galaxies with tend to be spiral galaxies, and those with elliptical galaxies (see also Shimasaku et al. 2001 and Baldry et al. 2003). Because the spiral/blue galaxies tend to have lower luminosities than elliptical/red galaxies (bottom right panel), the former are typically found at lower redshifts in the flux-limited SDSS sample than are the latter. Blanton et al. (2003) give a detailed analysis of the dependence of luminosity function on galaxy type. Note that the “features” in the middle right panel of Figure 1 are due to the large scale structure of galaxies. The differential number counts of both color types are well described by (see also Yasuda et al. 2001). We will use diagrams such as that shown in Fig. 1 to compare the distributions of galaxies detected at other wavelengths to the distribution of all SDSS galaxies.
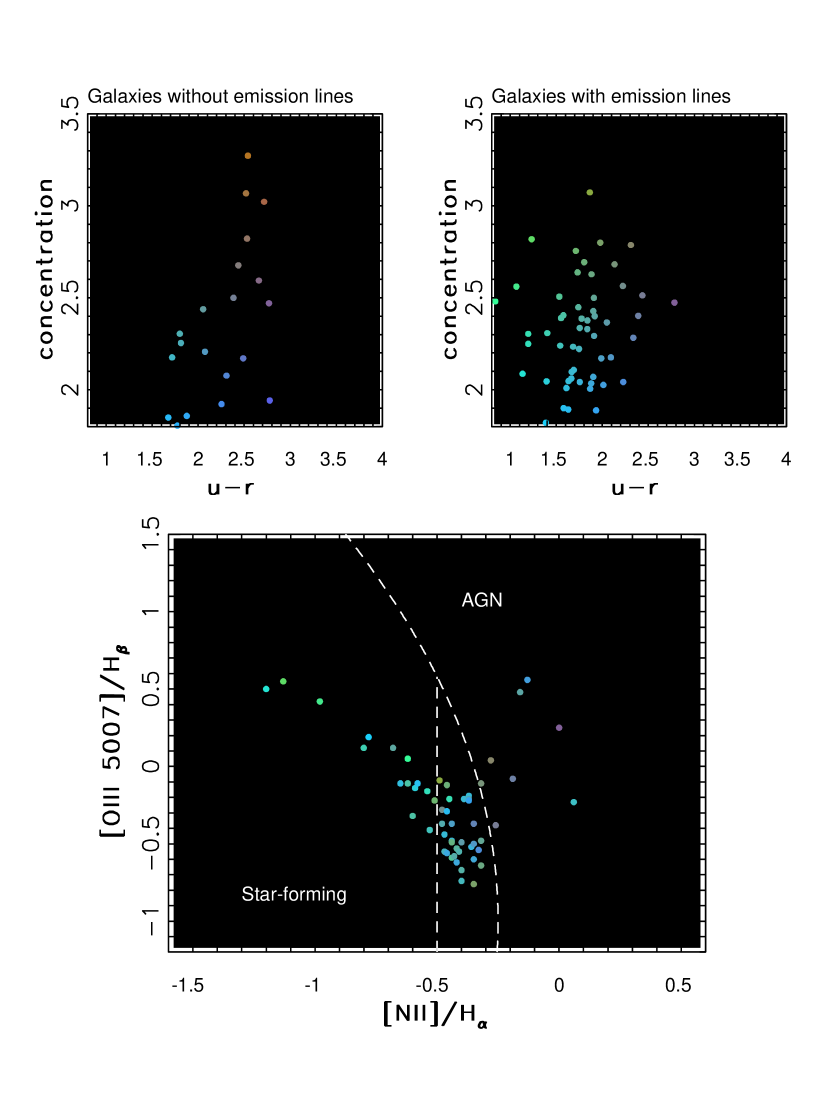
2.1.2 The distribution of emission-line galaxies in the Baldwin-Phillips-Terlevich diagram
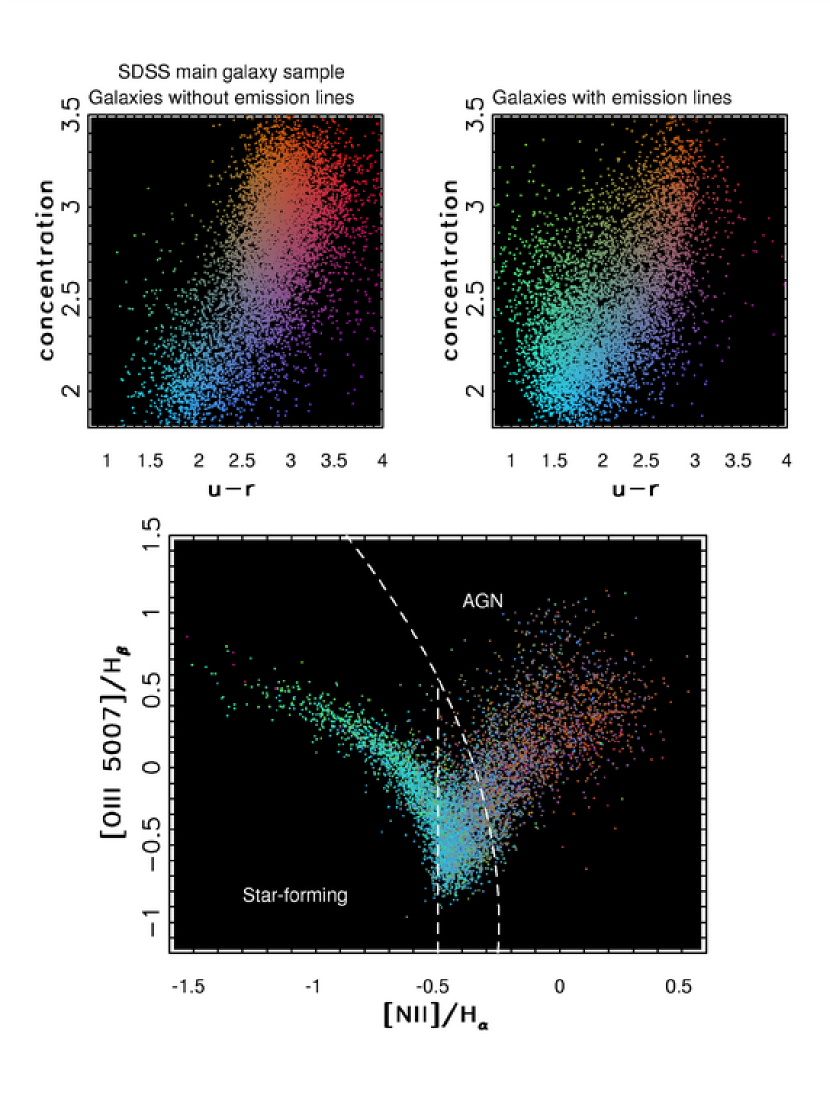
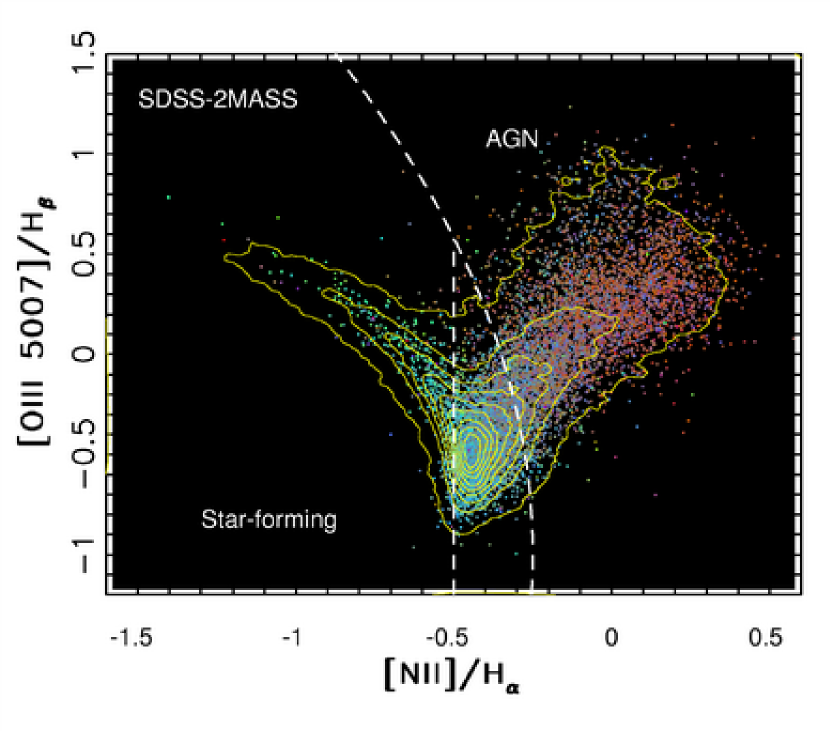
In addition to the overall comparison of galaxy distributions in diagrams shown in Fig. 1, we analyze the behavior of three subsamples defined by their emission line properties: galaxies without emission lines, and emission-line galaxies separated into star-forming and AGNs. To classify a galaxy as an emission-line galaxy, we follow Kauffmann et al. (2003a) and require a significant detection of the , , and lines. To classify emission-line galaxies as star-forming or AGN, we use the standard BPT diagram (Baldwin, Phillips & Terlevich, 1981).
The top two panels in Fig. 2 compare the distribution of galaxies without and with emission lines in the concentration index vs. diagram. Galaxies without emission lines tend to have larger concentration index and redder than galaxies with emission lines. The dots in these two panels are two-dimensionally color coded according to their concentration index and color. The same color-coding scheme is used in the bottom panel, which shows the BPT diagram for emission-line galaxies. There is a strong correspondence between the position of a galaxy in the BPT diagram and its position in the concentration index vs. diagram. Galaxies in the “star-forming branch” with small ratio, for a given ratio, have predominantly blue colors and small concentration index, while AGNs have redder colors and large concentration index. Furthermore, the distribution of emission-line galaxies in the BPT diagram is also correlated with and concentration index.
In the subsequent analysis, we separate emission-line galaxies into three groups according to their position in the BPT diagram: AGNs, star-forming, and “unknown”. The adopted separation boundaries are shown by the dashed lines, and are designed to produce robust clean samples of AGN and star-forming galaxies (for alternative approaches see Hao et al. 2005, and references therein; for the aperture effects due to 3 arcsec fiber diameter see, e.g., Kauffmann et al. 2003a and Kewley et al. 2005). The “unknown” category is found at the join of the two branches, and it is not obvious from the displayed data to which class these galaxies belong. While their concentration index and color indicate that they may be star-forming galaxies, their IR colors and redshift distribution (see Section 4) suggest that they are more similar to AGN galaxies. Of course, it is possible that these objects are star-forming galaxies that host an AGN.
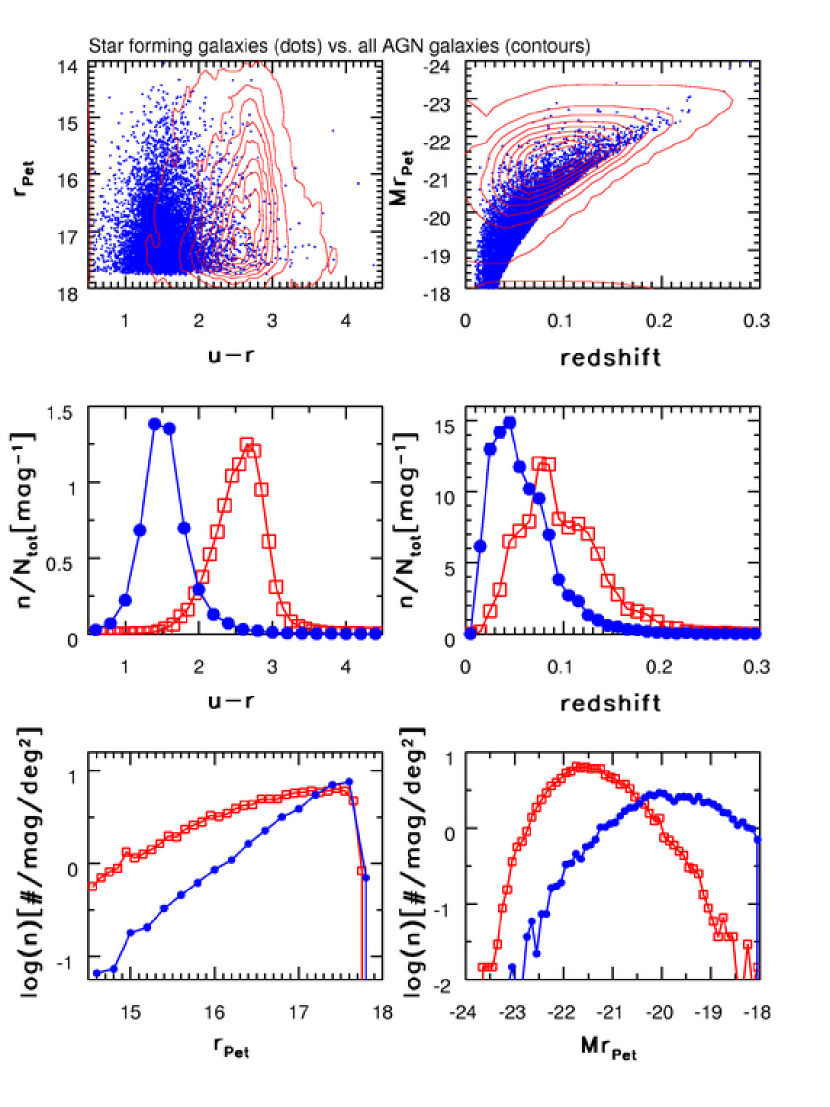
The comparison of the distributions of AGN and star-forming galaxies in magnitude-color-redshift space is shown in Fig. 3. As discussed above, the two types of galaxies, classified using emission lines, have remarkably different distributions (see middle left panel). Furthermore, star-forming galaxies tend to have smaller luminosities than AGNs, and hence are observed at lower redshifts in the flux-limited SDSS sample. They also have very different differential number counts - the counts of AGN galaxies are flatter (d(logN)/dr 0.3) than those of star-forming galaxies (and those of the whole SDSS sample). For detailed studies of the optical properties of star-forming and AGN galaxies, see e.g. Brinchmann et al. (2004), Tremonti et al. (2004), Heckman et al. (2004), and references therein.
3 What types of SDSS galaxies are detected at other wavelengths?
The detection fraction of SDSS galaxies at other wavelengths is a strong function of optical properties such as flux, , and emission-line strengths. In this analysis, we have taken into account the most important selection effects, namely: observational biases caused by varying survey depths, astrophysical effects such as intrinsically different color distributions for different galaxy types, and K correction (Gunn & Oke 1975) coupled with bias in redshift. The size and quality of our sample, in addition to its well controlled selection criteria, allow us to separate observational and astrophysical effects, and to study intrinsic correlations amongst numerous measured galaxy properties.
The matching fraction varies from % for ROSAT and GB6 to 40% for GALEX and 2MASS (Table 1). We start the discussion with the 2MASS, continue toward longer wavelengths, and then proceed from optical toward shorter wavelengths.
3.1 2MASS survey
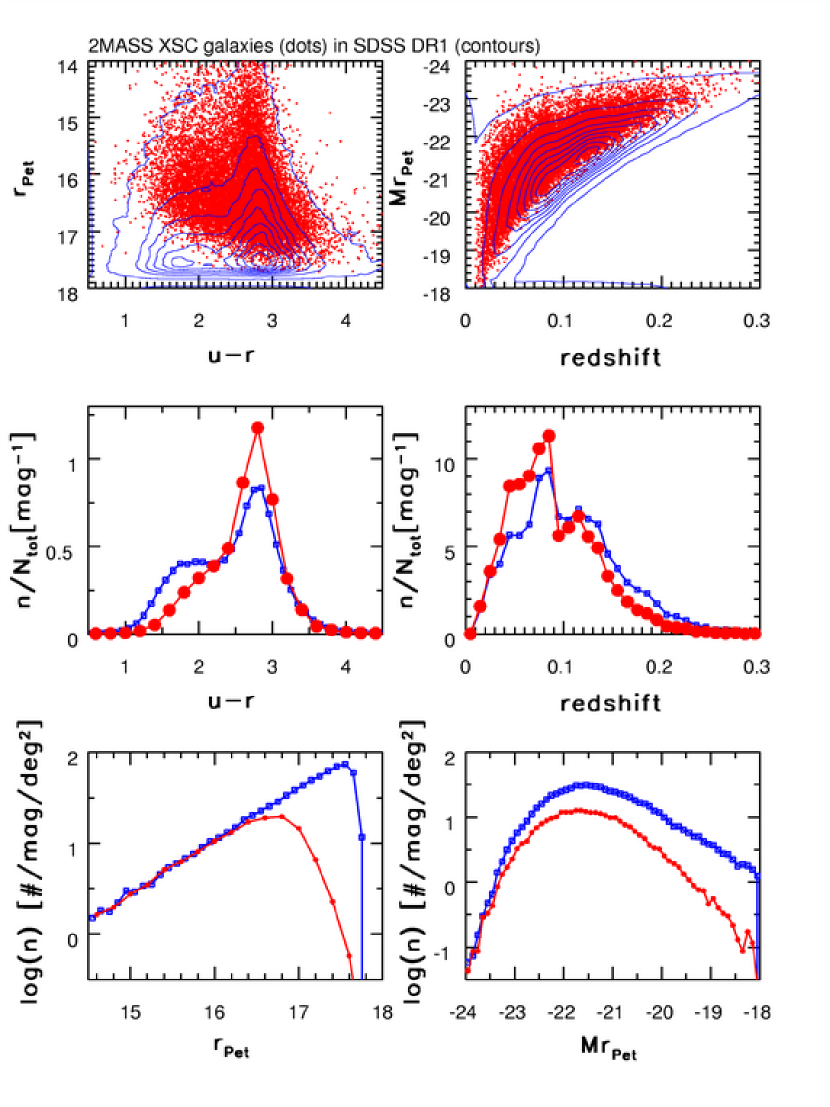
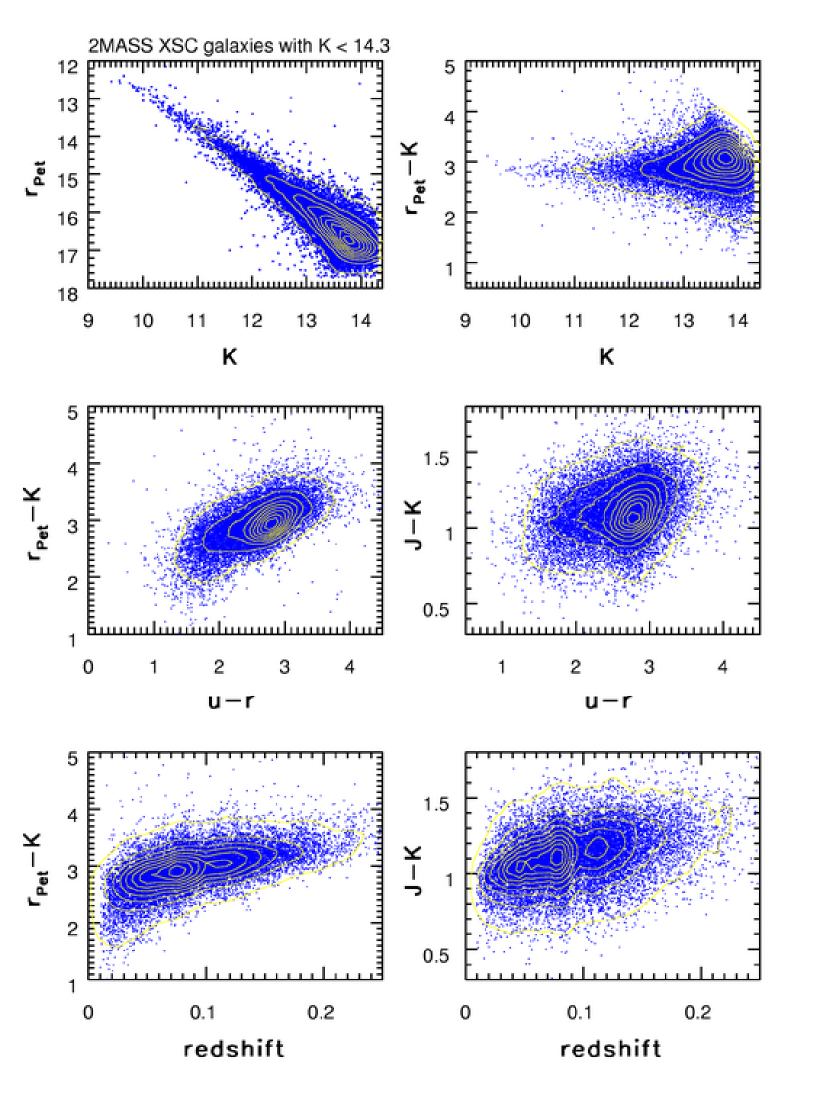
The distribution of SDSS galaxies detected by 2MASS333We analyze only resolved 2MASS sources listed in the 2MASS XSC catalog; see Appendix A4 for more details. in the color-magnitude-redshift space is compared to the distribution of all SDSS galaxies in Fig. 4. The requirement that a galaxy is detected and resolved by 2MASS (i.e., the XSC sample, see Appendix A4) introduces a bias towards red galaxies and lower redshift as shown in the middle two panels. The SDSS-2MASS XSC catalog is essentially complete444Here “essentially complete” implies a completeness of , as demonstrated by the direct comparison of the full SDSS and 2MASS overlap (see Finlator et al. 2000 and Ivezić et al. 2001b). for galaxies brighter than (bottom left panel, see also McIntosh et al. 2005).
The color-dependent incompleteness of the 2MASS XSC catalog for galaxies with is due to the 2MASS faint limit, coupled with the optical/IR color distribution of galaxies. We adopted , which corresponds to a detection; the -band differential counts of 2MASS XSC galaxies indicate that the catalog is complete to about K=13.5. Fig. 5 shows the optical/IR magnitude and color distributions of SDSS-2MASS galaxies. We use 2MASS “default” magnitudes (see Jarret et al. 2000) and do not correct for the differences between AB (SDSS) and Vega (2MASS) magnitudes555For completeness, the AB-to-Vega offsets for SDSS bands are , , , , and (see http://www.sdss.org/ for details on the transformations). These differences are , where , , and (see Finlator et al. 2000). Most galaxies have in the range 2–3.5. Thus, the bluest galaxies are brighter than the 2MASS faint limit only if they have . For only galaxies with redder than are sufficiently bright in the -band, and at practically no galaxies are listed in 2MASS XSC. This bias explains why the fraction of red galaxies in SDSS-2MASS sample is higher than among all SDSS galaxies (80% vs. 66%, with the blue/red separation defined by =2.22). Since red galaxies tend to be more luminous than blue galaxies (e.g., Blanton et al. 2003), this color bias also explains why 2MASS-SDSS galaxies are biased towards larger luminosities.
As the bottom two panels in Fig. 5 demonstrate and depend on redshift. This correlation (K correction), coupled to the color effects discussed above, introduces a dependence of the detection fraction on redshift. It is also an important effect to consider when comparing the colors of various subsamples that may have different redshift distributions, as we further discuss in Section 4.2.
3.1.1 Predicting 2MASS K-band flux from UV/optical SDSS fluxes
The optical-IR color, , is correlated with the UV-optical color, as shown in the middle left panel in Fig. 5. This correlation indicates that it is possible to estimate the -band flux using only SDSS data, and is consistent with the fact that galaxies form a nearly one-dimensional sequence in various optical color-color diagrams constructed with SDSS data. The correlation among colors is especially tight for optical rest-frame colors, with a scatter of only 0.03 mag perpendicular to the locus (Smolčić et al. 2006). The vs. correlation demonstrates that this one-dimensionality of broad-band galaxy spectral energy distributions (SEDs) extends to near-IR wavelengths.
In order to quantitatively assess to what extent near-IR flux is correlated with optical fluxes, we determine the -band flux from , where is the SDSS -band Petrosian magnitude and is a best fit to the observed colors for SDSS/2MASS galaxies sampled from SDSS. We use UV/visual fluxes (- and -bands) to fit the color because this is the “hardest” wavelength combination with most astrophysical implications. According to “common wisdom”, such a relationship should not be very accurate due to the effects of starbursts and dust extinction. Predicting, for example, 2MASS -band flux from SDSS -band flux is trivial because these two bands are adjacent in wavelength space. We also take into account the K correction (see the bottom left panel in Fig. 5), and fit the following functional form
| (1) |
where is redshift.
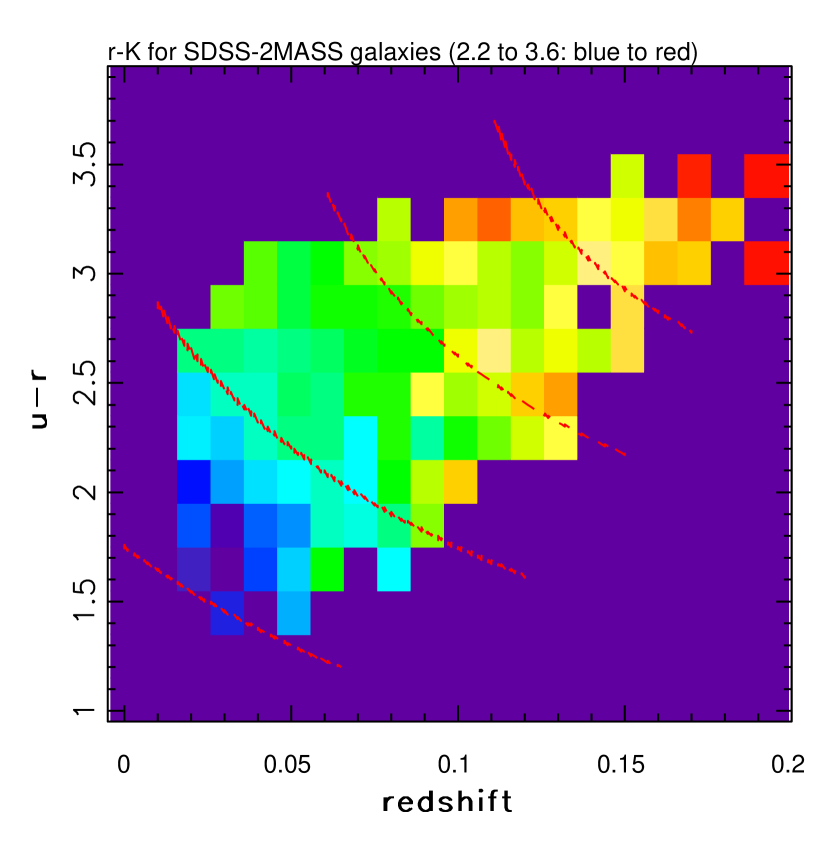
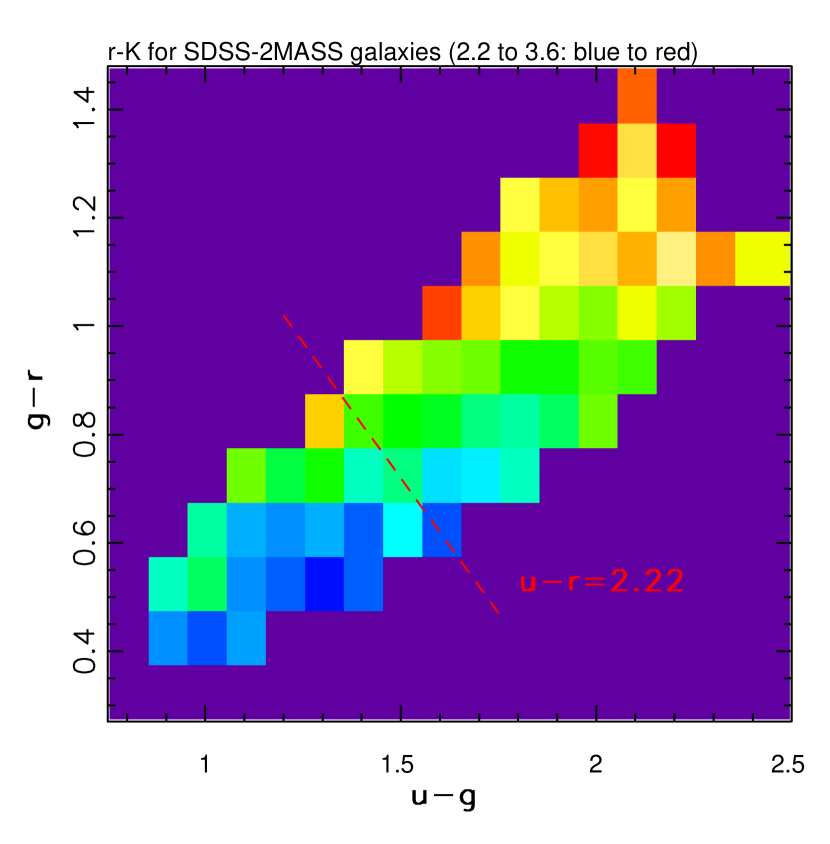
The motivation for this functional form is the behavior of the color shown in the top panel in Fig. 6. The color also seems to be a well-defined function of the position in the vs. color-color diagram, shown in the bottom panel in Fig. 6, but the scatter around the median values in each bin is larger than for the vs. redshift diagram (this is essentially due to larger uncertainty of photometric redshifts that are implied by the position of a galaxy in the vs. diagram, in comparison to spectroscopic redshifts).
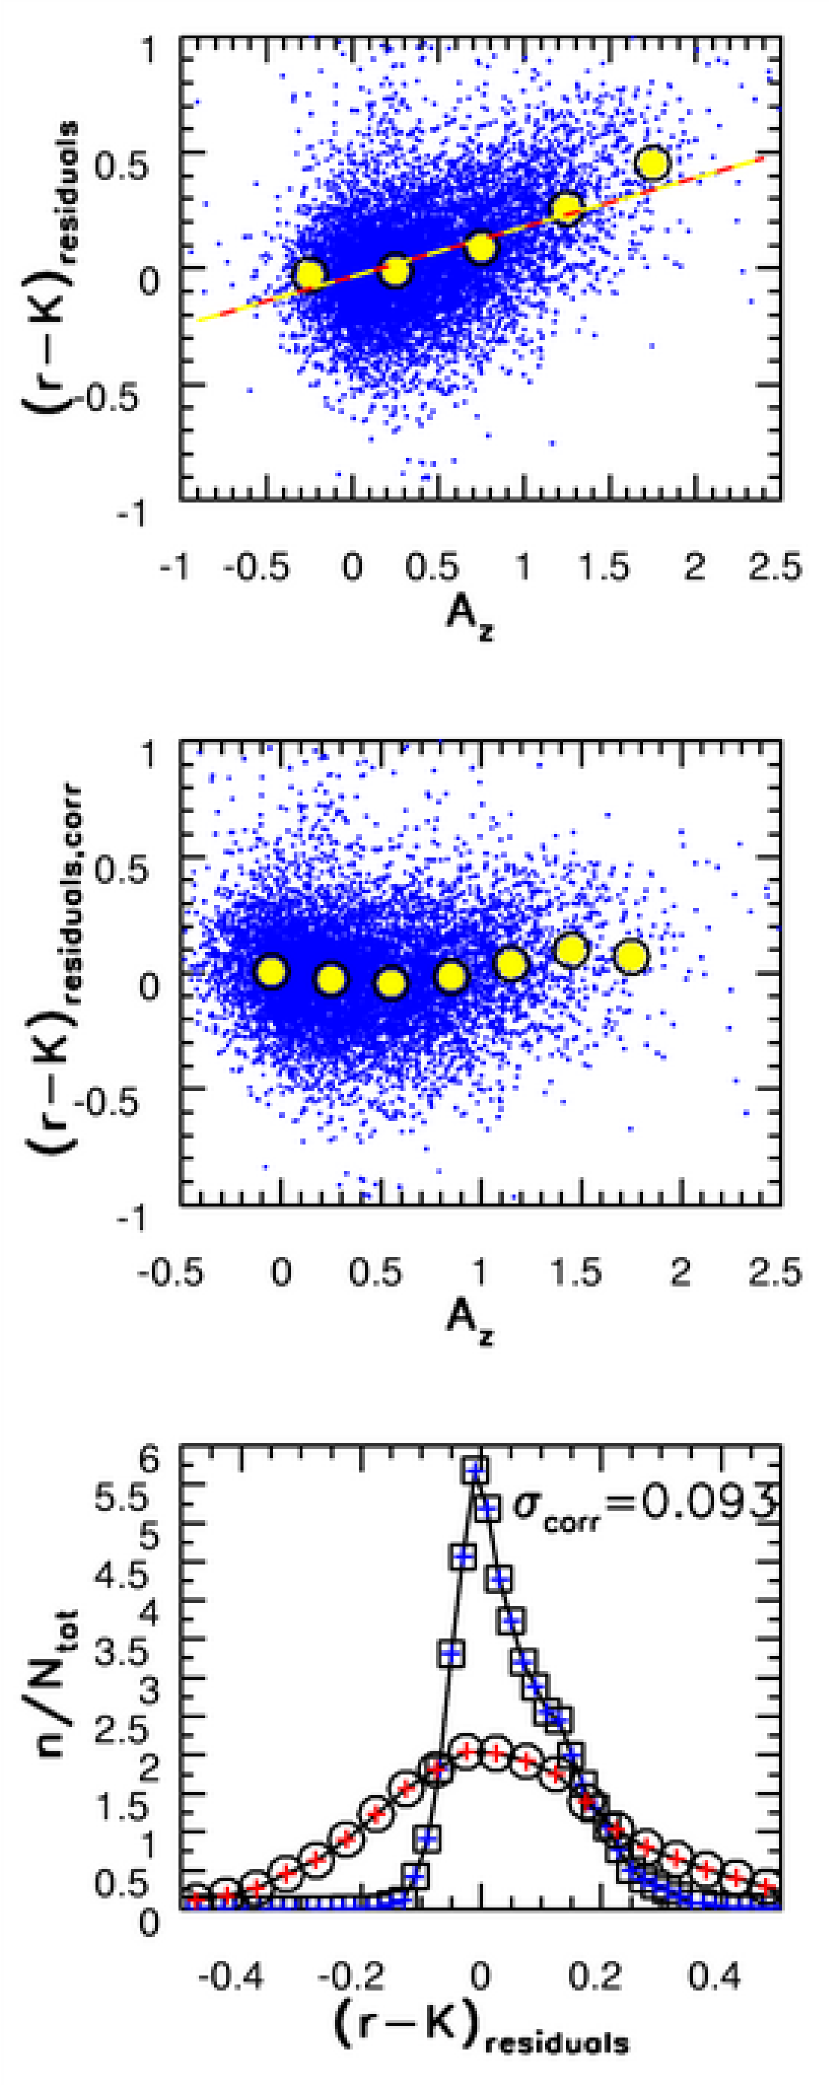
With the best-fit values (A, B, C, D, E, F)= (1.115, 0.940, -0.165, 0.00851, 4.92, -9.10), this relation predicts 2MASS -band magnitudes with an rms scatter of only 0.20 mag. The residuals between the fitted and measured values depend on neither color nor redshift, and are nearly Gaussian (see the two middle panels in Fig. 7). However, there is a correlation between the residuals and the optical galaxy size, parametrized by , the radius enclosing 50% of the Petrosian flux in the -band (for details see Stoughton et al. 2002, and Strauss et al. 2002). To correct for these aperture and resolution effects, which presumably depend on galaxy profile666This assumption was recently verified by Chang et al. (2005)., or nearly equivalently on galaxy color (Strateva et al. 2001), we add to the right hand side of the eq. 1 for galaxies with and for redder galaxies. This correction has a negligible effect on the rms scatter in the predicted K magnitude, and only removes a correlation of residuals with galaxy size (see the two bottom panels in Fig. 7).
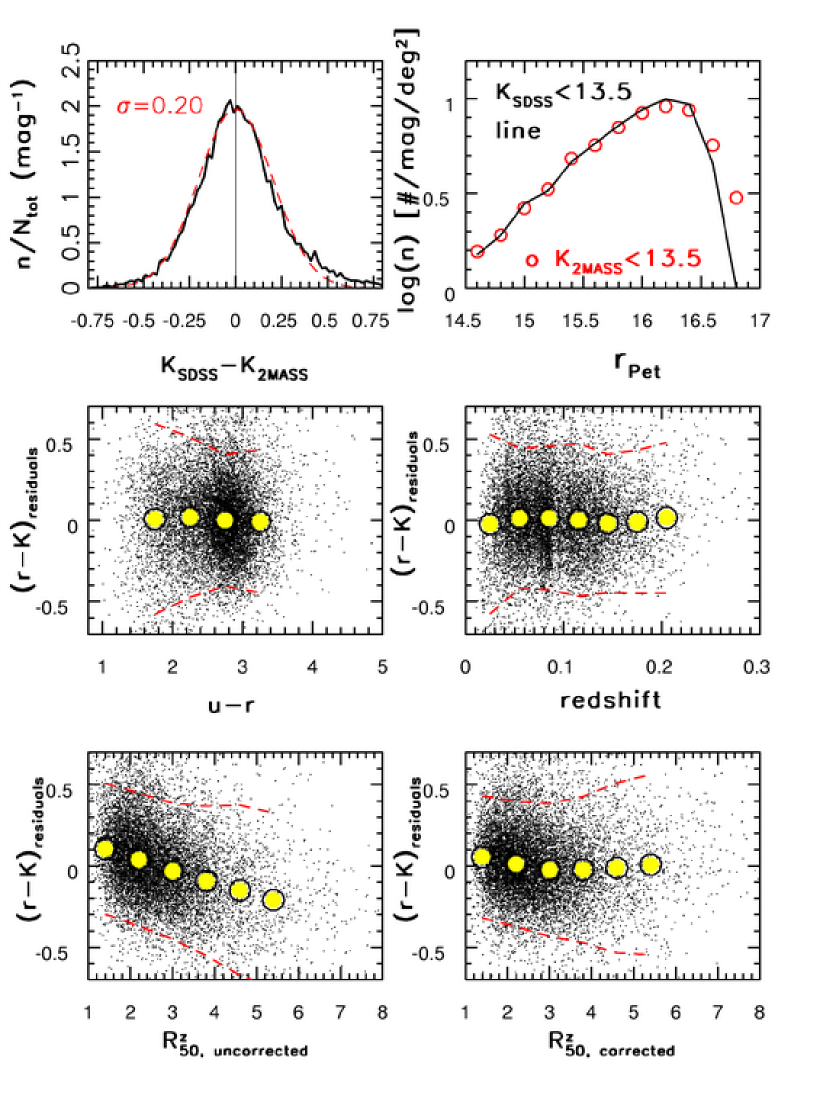
The distribution of differences between the predicted and measured -band magnitudes is shown in Fig. 7 (top left panel). The median residuals, as a function of and , do not exceed 0.03 mag, and the rms scatter decreases to 0.15 mag at the bright end (). The top right panel in Fig. 7 compares the differential number counts as a function of for galaxies with , where the latter condition is imposed using measured and predicted values. The good agreement shows that predicted -band flux is not overestimated for galaxies that are not in 2MASS XSC, and indicates that the proposed relations may be applicable for galaxies fainter than the 2MASS faint cutoff.
Given typical measurement errors in , , and , we conservatively conclude that the true astrophysical scatter of -band magnitudes predicted from the blue part of the SED is not larger than 0.1 mag. Similarly, the relation , where is redshift (see the bottom right panel in Fig. 5), predicts the measured by 2MASS with an rms scatter of 0.11 mag (0.07 mag at the bright end), and no significant residuals with respect to , , and redshift; that is, the rest-frame color distribution of all low-redshift galaxies is very narrow: 0.1 mag. These tight correlations demonstrate the remarkable one-dimensionality of galaxy spectral energy distributions from UV to IR wavelengths. We further discuss the spectral energy distribution of galaxies in Section 4.1, and an improvement to the K band flux prediction given by the eq. 1 in Section 4.4.
3.2 IRAS FSC
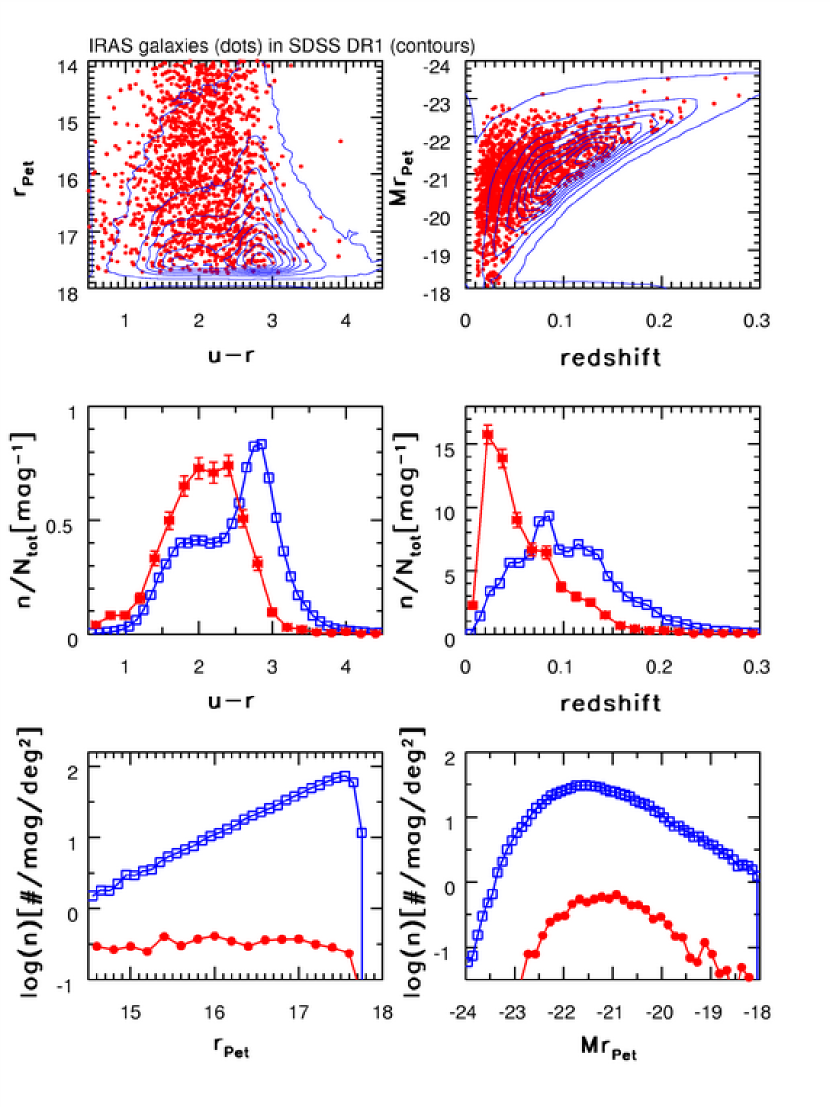
The distribution of SDSS galaxies detected by IRAS777We analyze the sources listed in the IRAS FSC catalog; see Appendix A5 for more details. in color-magnitude-redshift space is compared to the distribution of all SDSS galaxies in Fig. 8. The requirement that a galaxy is detected by IRAS introduces a strong bias towards optically blue galaxies and lower redshift (the middle two panels). The majority of these galaxies have emission lines and include both star-forming and AGN galaxies, as we discuss in more detail in Section 4.2. The completeness of the IRAS FSC catalog depends strongly on , and varies from 22% for to 1% for .
3.2.1 The correlation between and galaxy dust content
Interstellar dust absorbs UV and optical radiation and re-emits it at mid- and far-IR wavelengths. Hence, some degree of correlation is expected between the far-IR-optical/UV colors and the amount of dust in a galaxy.
Kauffmann et al. (2003a) used the distribution of galaxies in the plane spanned by the strength of the line and the 4000 Å break () to obtain model-dependent estimates of stellar masses and dust content for SDSS galaxies. Given the position of a galaxy in the – plane, the most probable mass-to-light ratio is drawn from a model library. With the measured luminosity, this ratio then yields stellar mass. The observed luminosity is corrected for the dust extinction determined by comparing observed imaging and colors to model-predicted colors (the latter do not include the effects of dust reddening). The reddening correction needed to make models agree with data is interpreted as an effective optical depth in the SDSS -band, , due to a galaxy’s interstellar dust. Here we find, using the measured properties of galaxies detected by IRAS, independent support for the notion that these model-dependent estimates of are indeed related to the galaxy dust content.
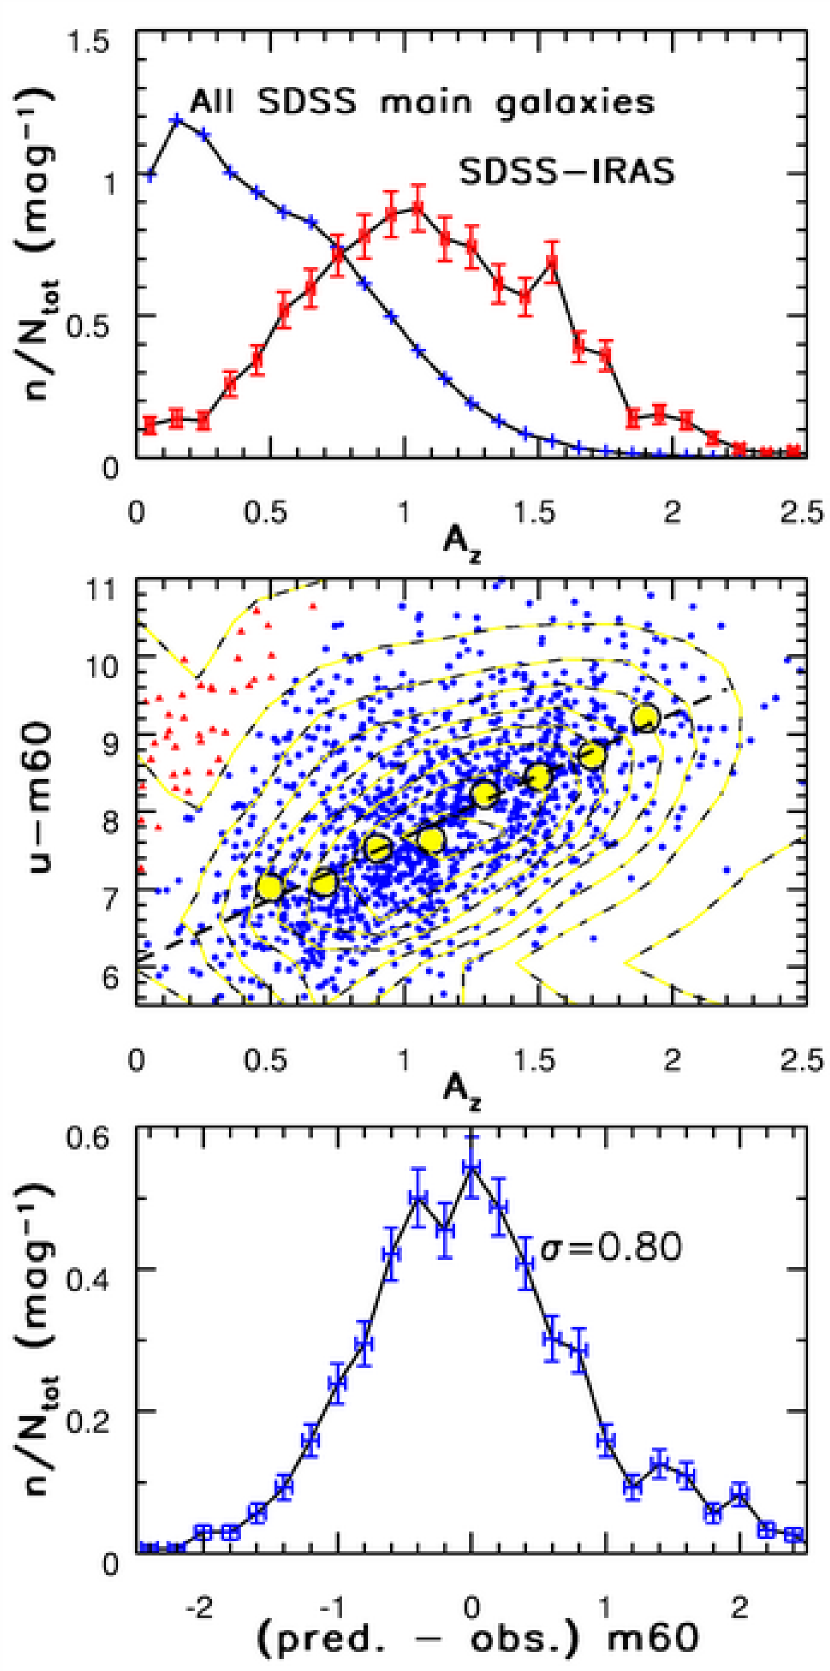
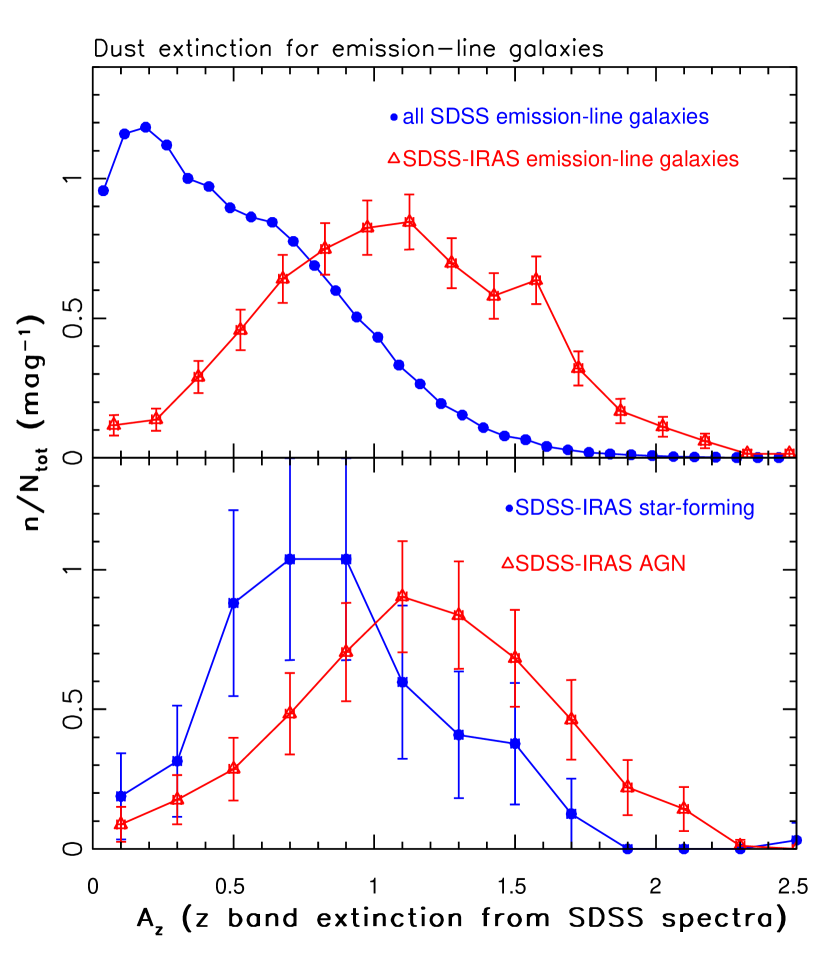
The top panel in Fig. 9 compares the distributions of , determined by Kauffmann et al. (2003a), for all SDSS galaxies (pluses) and for the subset detected by IRAS (squares with error bars). Galaxies detected by IRAS have systematically higher values of than the full SDSS “main” galaxy sample. If values of , determined using only SDSS data, were not related to the dust content, there would be no systematic difference induced by requiring a detection by the fully independent IRAS survey.
Furthermore, we find a correlation between color ( are IRAS measurements expressed as AB magnitudes, with =12, 25, 60, and 100 m) and . The small symbols in the middle panel in Fig. 9 show color as a function of for 1200 highly probable SDSS-IRAS identifications, selected from the full SDSS-IRAS sample by limiting the maximum SDSS-IRAS distance to 20 arcsec. We first determine median values of in bins of range 0.4–2.0, and then fit a linear relation to obtain
| (2) |
We do not find significant differences in the best-fit relations fitted separately to AGN and star-forming subsamples (classified using emission-line strengths). The adopted range excludes 3% of the sample that has very small and about 2.5 mag redder than predicted by the above relation (triangles in the upper left corner in the middle panel in Fig. 8). It is not clear whether this 60m excess is physical, or due to random matches. In any case, the fraction of the excluded sources is sufficiently small to have no effect on the overall correlation.
Using this relation and the measured SDSS -band fluxes, we estimate the 60 m flux, and compare it to the measured values in the bottom panel in Fig. 9. The IRAS 60 m flux can be predicted within a factor of 2 (rms, or 0.8 mag) using only SDSS data. If, instead, the estimates are ignored, and the 60 m flux is estimated by assuming = 7.6 (the median value) for all galaxies, the rms scatter between the predicted and measured values becomes 1.41 mag. Hence, the estimates do contain information about the dust content.
We have also attempted to use the line strength ratio as a proxy for effective dust extinction (e.g., see Moustakas, Kennicutt & Tremonti 2005, and references therein). The values of and determined by Kauffmann et al. (2003a) are well correlated. We find that for emission-line galaxies can be determined from with an rms scatter of 0.07 using the relationship
| (3) |
This relationship maintains its accuracy when only radio-selected, IR-selected, and subsamples separated into AGN and star-forming galaxies are considered. Thus, the vs. and vs. correlations imply the existence of a vs. correlation.
As expected, we find an overall correlation between and ratio for SDSS-IRAS galaxies. However, it is not as strong as the vs. relation discussed above. In terms of the rms scatter between predicted and measured 60 m flux, it predicts 60 m magnitude within 1.2 mag, that is, not as well as when using . This implies that values determined using SDSS spectra and sophisticated stellar population models may be a better estimator of effective dust content than the straightforward application of the line-strength ratio.
Although it is hard to estimate the errors in IRAS flux measurements without an independent data set, the radio-IR correlation discussed in § 4.2.3 suggests that they are not larger than 0.4 mag, and therefore smaller than the rms scatter of 0.82 mag between predicted and measured 60 m fluxes (the quoted formal IRAS FSC photometric errors are 0.2 mag). Thus, it may be possible to further improve the prediction for far-IR flux by using additional SDSS measurements such as sizes and UV/optical colors. For example, the differences between predicted and measured 60 m fluxes are somewhat correlated with color: the median value is mag for galaxies with 2.22 and 0.2 mag for redder galaxies. A similar effect is seen when the sample is separated into AGN and star-forming galaxies. We postpone such an analysis until the larger samples needed for robust quantitative multi-dimensional analysis are constructed.
3.3 Radio surveys (GB6, FIRST, NVSS, WENSS)
The advent of modern sensitive large-area radio surveys (see Appendix A6 for brief descriptions and references), combined with an optical survey such as SDSS, offers significantly larger, more diverse, and accurate samples of radio sources with optical identifications than available until recently. Detailed studies of SDSS sources detected by the FIRST and NVSS 20 cm surveys was presented by Ivezić et al. (2002) and Best et al. (2005ab). Here we extend their analysis to multiwavelength radio observations by including data from the GB6 (6 cm) and WENSS (92 cm).
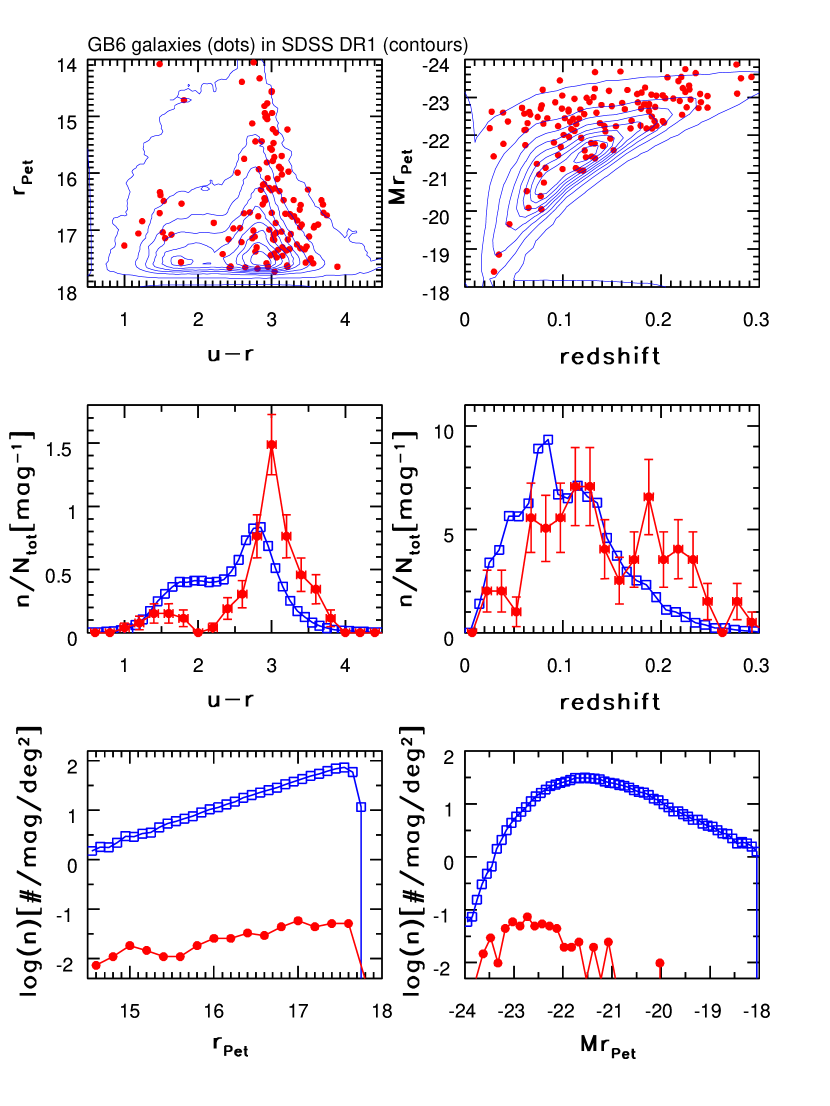
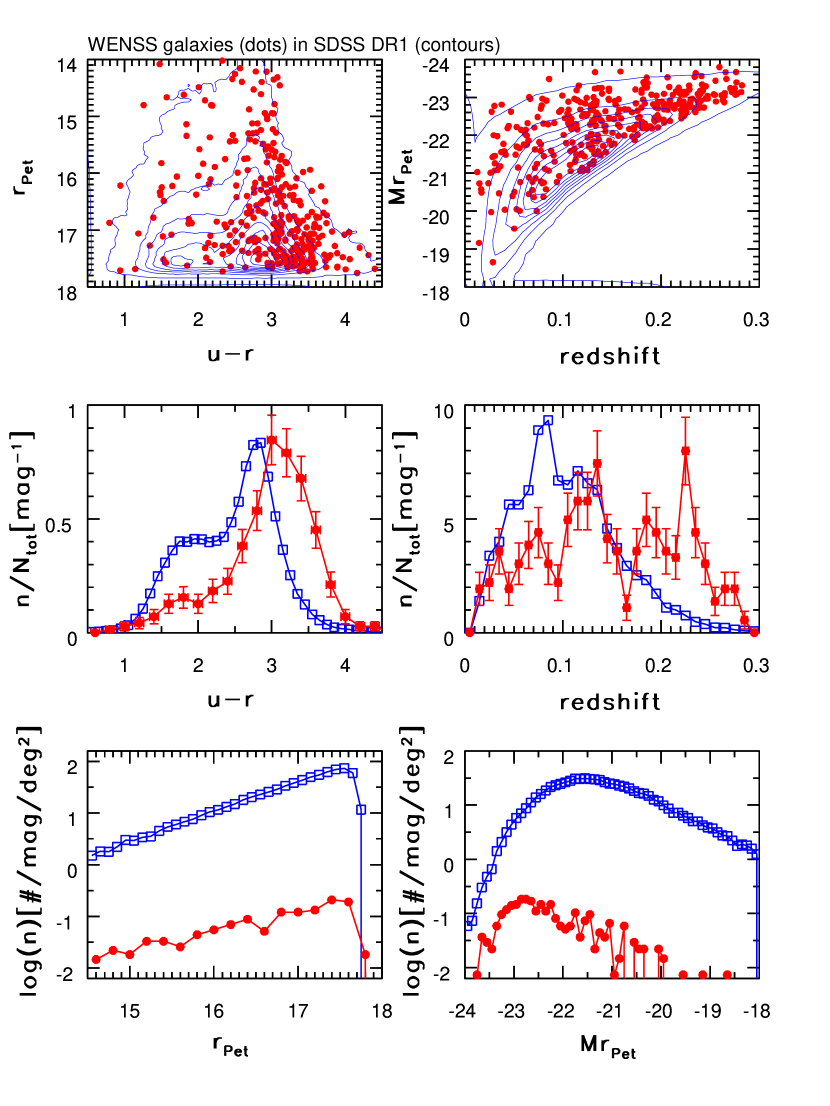
A summary of optical properties of SDSS galaxies detected by GB6 and WENSS is shown in Figs. 10 and 11. Analogous diagrams for galaxies detected by FIRST and NVSS can be found in Ivezić et al. (2002). The matching rate is the smallest for the GB6 catalog (0.22%, see Table 1), and the highest for FIRST (3.86%). The difference in matching fractions for the two 20 cm surveys (FIRST and NVSS) is due to their different faint flux limits and angular resolution. All four radio catalogs show similar distributions in color-magnitude-redshift space, despite the relatively large wavelength coverage and varying angular resolution. Radio galaxies are biased towards red, luminous galaxies and higher redshifts. Even when red galaxies () are considered separately, their median color is redder by about 0.3 mag for the radio-detected subsample than for the whole red sample. However, this is simply a consequence of a bias in redshift induced by requiring radio-detection coupled with the K correction, as discussed by Ivezić et al. (2002). When compared in a small redshift range, the radio-detected red galaxies have the same color distribution as red galaxies without radio detections.
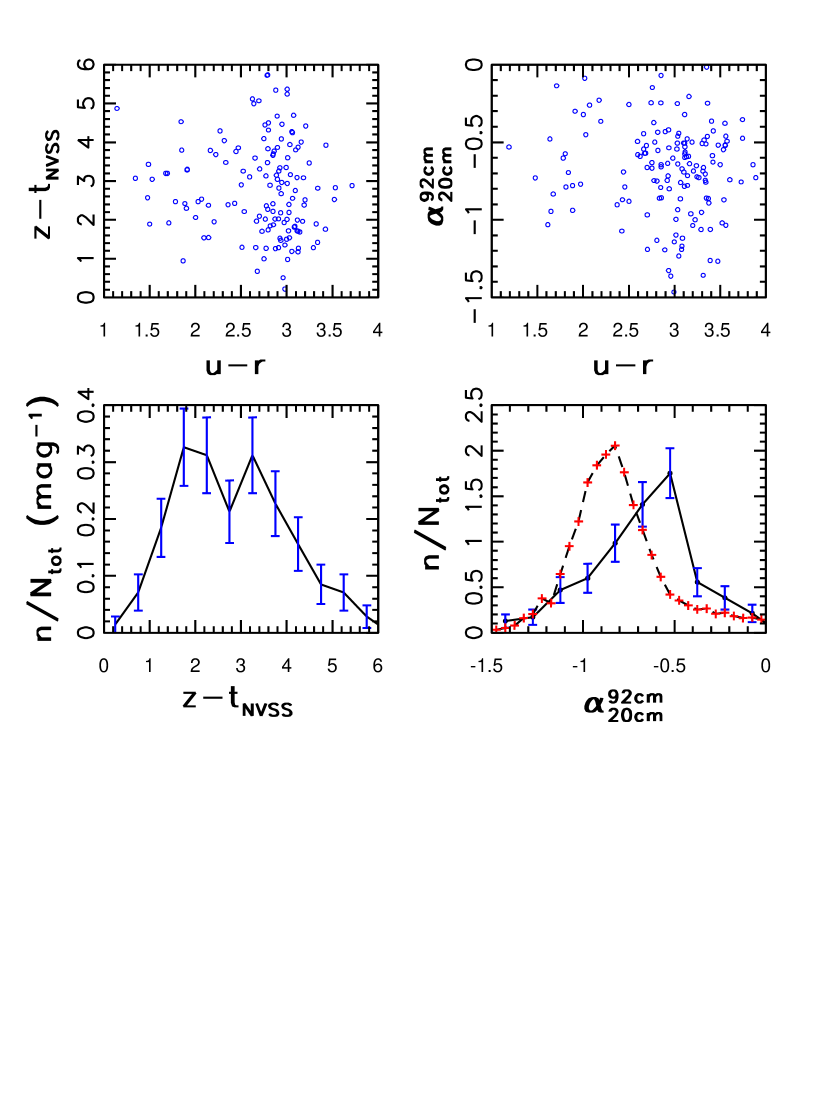
This sample is sufficiently large to test whether the radio spectral slope is correlated with optical properties, such as . Using NVSS and WENSS measurements, we compute the radio spectral slope between 20 cm and 92 cm, and find no correlation with the color (see the top right panel in Fig. 12). We find that the distribution of this spectral slope for “main” SDSS galaxies is different from the distribution for the full multiwavelength radio sample (bottom right panel in Fig. 12); the latter have a larger fraction of sources with “steep” spectra (). This difference is probably caused by distant radio-galaxies that are not present in the “main” SDSS sample, and by quasars. For further discussion of the distribution of galaxies and quasars in radio “color-color” diagrams, we refer the reader to Ivezić et al. (2004a).
We also analyzed the radio-to-optical flux ratio as a function of . The top left panel in Fig. 12 shows the radio-optical color888Following Ivezić et al. 2002, we express all radio fluxes on AB magnitude scale. We would like to apologize to radio astronomers, as this seemed less of a problem than expressing SDSS and the UV-to-IR measurements in Janskys. as a function of color for a subsample of SDSS-NVSS-WENSS galaxies with redshift in the range . We use the -band because the dependence of the bolometric correction for galaxies on color is the smallest in this band (see Section 4.1), and restrict the redshift range to minimize the effects of K correction. There is no discernible correlation between the radio-optical and color. However, the measured distribution of the radio-optical color, shown in the bottom left panel, is subject to numerous selection effects (such as multiple faint flux limits), and it is hard to uncover the intrinsic distribution without detailed simulations, which will be attempted elsewhere.
3.4 GALEX
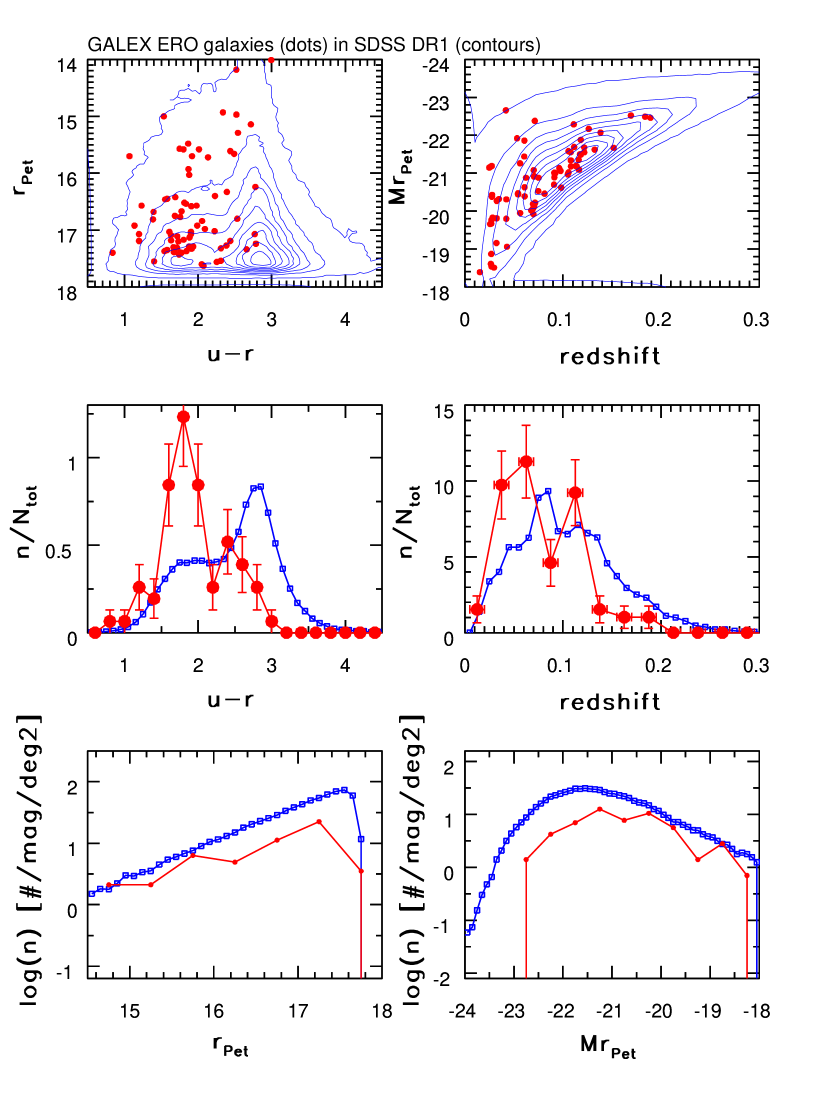
The distribution of SDSS galaxies detected by GALEX999We analyze sources listed in the GALEX Early Release Observations; see Appendix A3 for more details. in color-magnitude-redshift space is compared to the distribution of all SDSS galaxies in Fig. 13. The requirement that a galaxy is detected by GALEX introduces a bias towards blue galaxies and lower redshift (the middle two panels). The fraction of SDSS “main” galaxies detected by GALEX101010For an analysis of SDSS sources detected by GALEX that is not limited to SDSS “main” galaxies, we refer the reader to Agüeros et al. (2005) and references therein. is 42%, and approaches 100% at the bright end (the bottom left panel). The comparison of their distribution with those shown in Fig. 3 suggests that they are dominated by star-forming () galaxies, but also include AGN () galaxies. The UV colors measured by GALEX support this conclusion (Agüeros et al. 2005). Furthermore, the majority (70%) of these galaxies have emission lines, and their distribution in the BPT diagram (discussed in more detail in Section 4.3) confirms that AGN emission, rather than starbursts, is the origin of UV flux in at least 10% of SDSS-GALEX galaxies.
3.5 ROSAT FSC
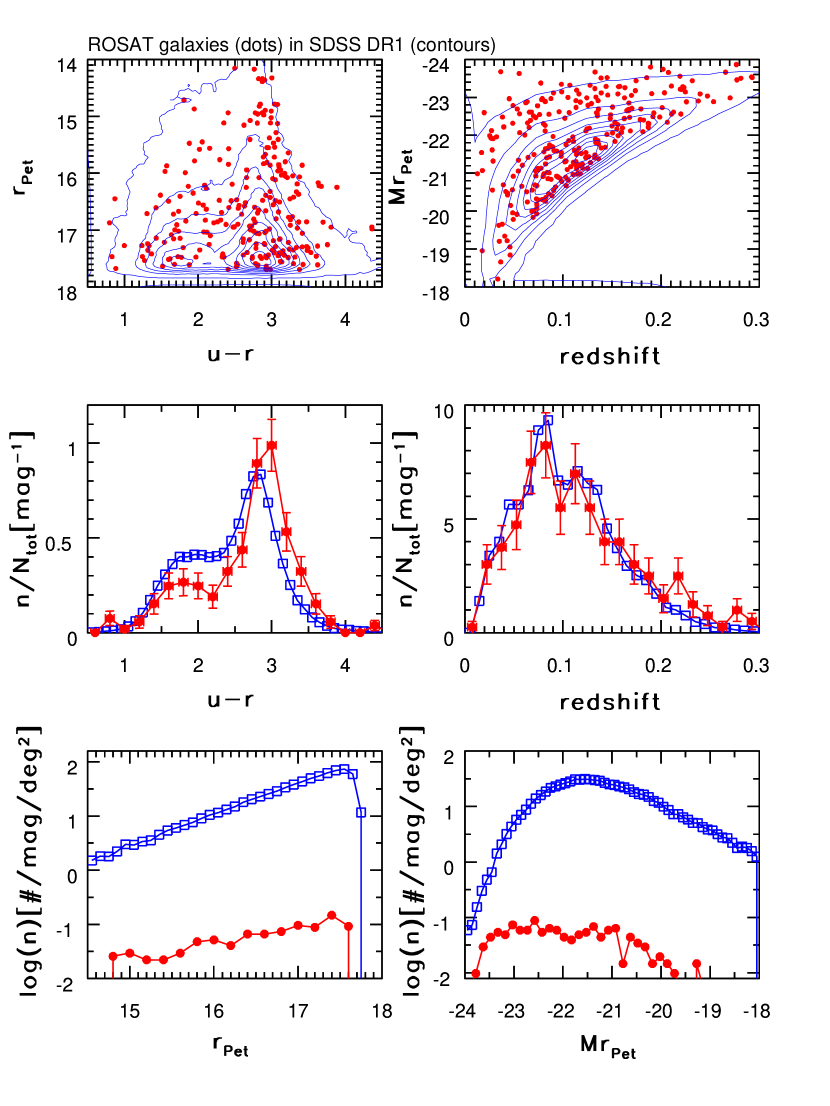
Matching ROSAT X-ray detections (including both hard and soft X-ray data) to SDSS DR1 optical counterparts produced a low (0.63%) matching fraction. Color-magnitude-redshift diagrams (Fig. 14) reveal a bias toward red galaxies, similar to that seen for radio surveys, but without a redshift bias. The small sample size prevents more detailed analysis. We refer the reader to Anderson et al. (2003) for an analysis of SDSS sources detected by ROSAT that is not limited to SDSS “main” galaxies.
4 Panchromatic Properties of SDSS Galaxies
In this Section we combine the data from multiple surveys to construct and compare the UV-IR spectral energy distributions (SEDs) for various subsamples of galaxies, and analyze the changes in the BPT diagram induced by requiring detection at different wavelengths spanning the X-ray to radio range.
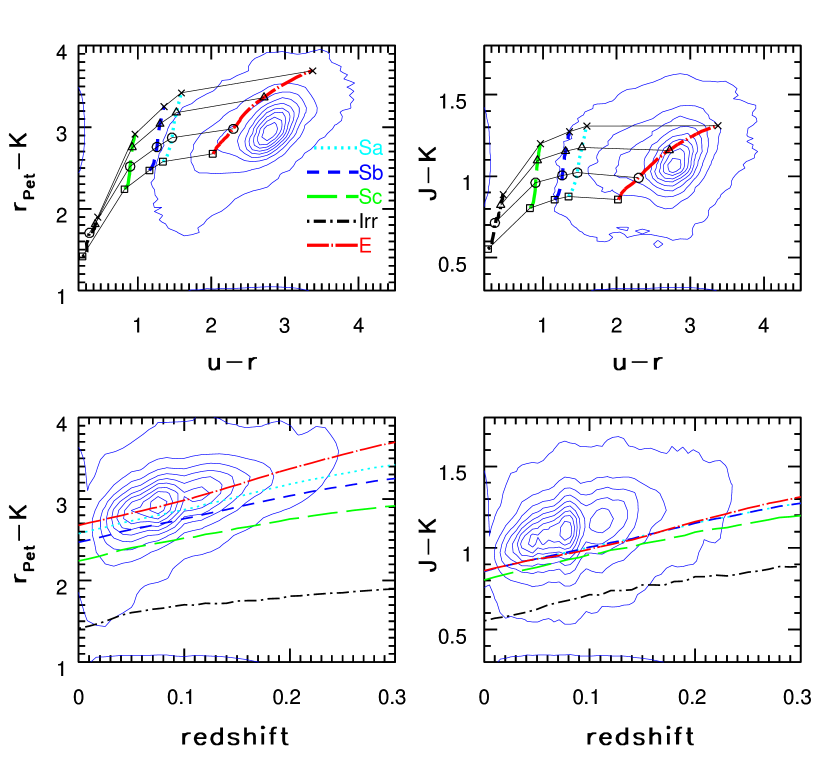
4.1 Dependence of colors on redshift and mean SEDs
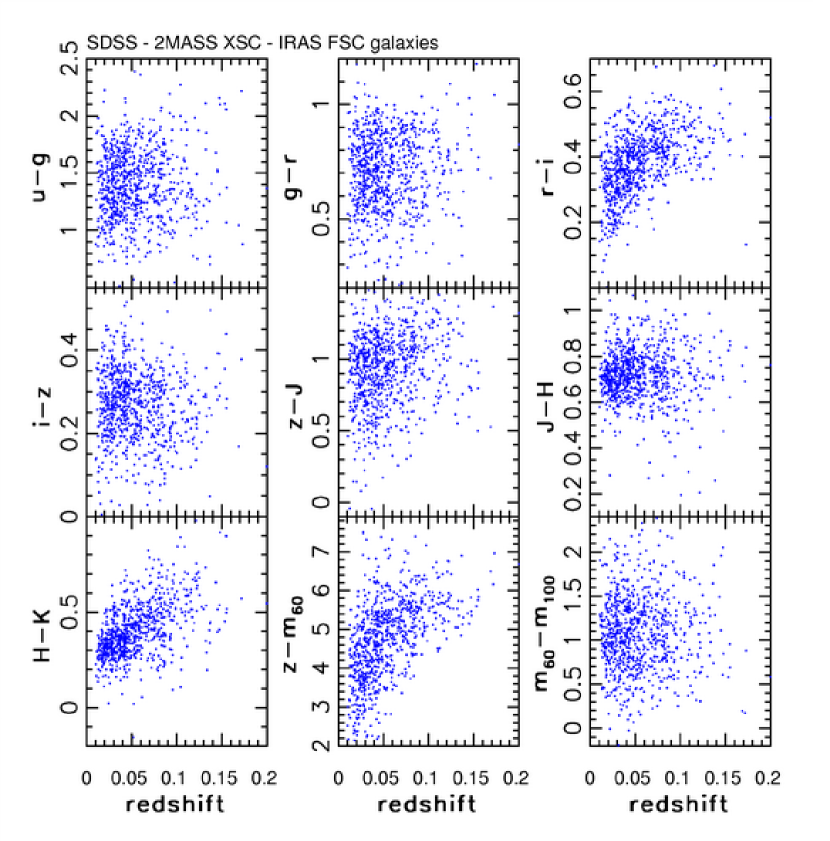
The broad-band colors (SED) of a galaxy depend both on its type and redshift (K correction). The dependence of optical and infrared colors on redshift is illustrated in Fig. 15 for SDSS “main” galaxies listed in the 2MASS XSC and IRAS FSC. We used these diagrams to select a narrow redshift range with a sufficient number of galaxies to construct the median SEDs for various subsamples (i.e., we use the median of each color to construct the overall SED). The median SEDs constructed with GALEX, SDSS, and 2MASS photometry for two subsamples of galaxies separated by color following Strateva et al. (2001) and with redshifts in the range (small enough that the colors are essentially rest-frame) are shown in the top panel in Fig. 16 (when constructing SEDs as a function of wavelength, we use Vega to AB conversion for 2MASS magnitudes from Finlator et al. 2000).
Galaxies with blue have all other colors, in the plotted wavelength range, bluer than galaxies with red . Equivalently, the galaxy SEDs constructed with GALEX, SDSS, and 2MASS data are a nearly one parameter family (GALEX far-UV measurements do provide some additional information which cannot be extracted from SDSS and 2MASS broad-band measurements, see Agüeros et al. 2005). In particular, we demonstrated in Section 3.1.1 that the 2MASS -band flux can be predicted within 0.2 mag using SDSS and fluxes. Smolčić et al. (2006) discuss an even tighter one-dimensional behavior of galaxies at wavelengths probed by SDSS.
The bottom panel in Fig. 16 shows the same SEDs as in the top panel, except that a linear scale is used instead of a logarithmic scale, and the SEDs are normalized by the bolometric flux. The bolometric flux is determined by integrating a spline fit to the 9 data points provided by GALEX, SDSS, and 2MASS, and using Rayleigh-Jeans extrapolation at wavelengths longer than 2.2 m. The data values shown in the figure are also listed in Table 2.
The two normalized SEDs cross around the SDSS band (0.9 m); showing that the dependence of the bolometric correction for galaxies on color in the SDSS photometric system is the smallest in the -band. Hence, the flux measured in this band provides the best approximation to the bolometric flux (up to a constant; the important feature is the absence of color dependence). This band also has the smallest K correction for the redshifts probed by the SDSS “main” galaxy sample (since the SED slope is the smallest around this wavelength range), and is less sensitive to dust extinction than other SDSS bands. Thus, a good color-independent estimate of the bolometric flux (in the 0.2–2.2 m wavelength range) can be simply obtained from the expression
| (4) |
or, equivalently,
| (5) |
where is the absolute SDSS -band magnitude. The uncertainty of these estimates is of order 5-10% (including calibration and SED integration errors, but not the individual -magnitude measurement error, which can exceed 10% for faint galaxies).
We caution that the -band should be used as a proxy for bolometric flux only for galaxies at redshifts . For galaxies with larger redshifts the 2MASS -band measurement should be used instead (and the band for galaxies with redshifts beyond 0.6, though the number of such galaxies detected by 2MASS may be extremely small).
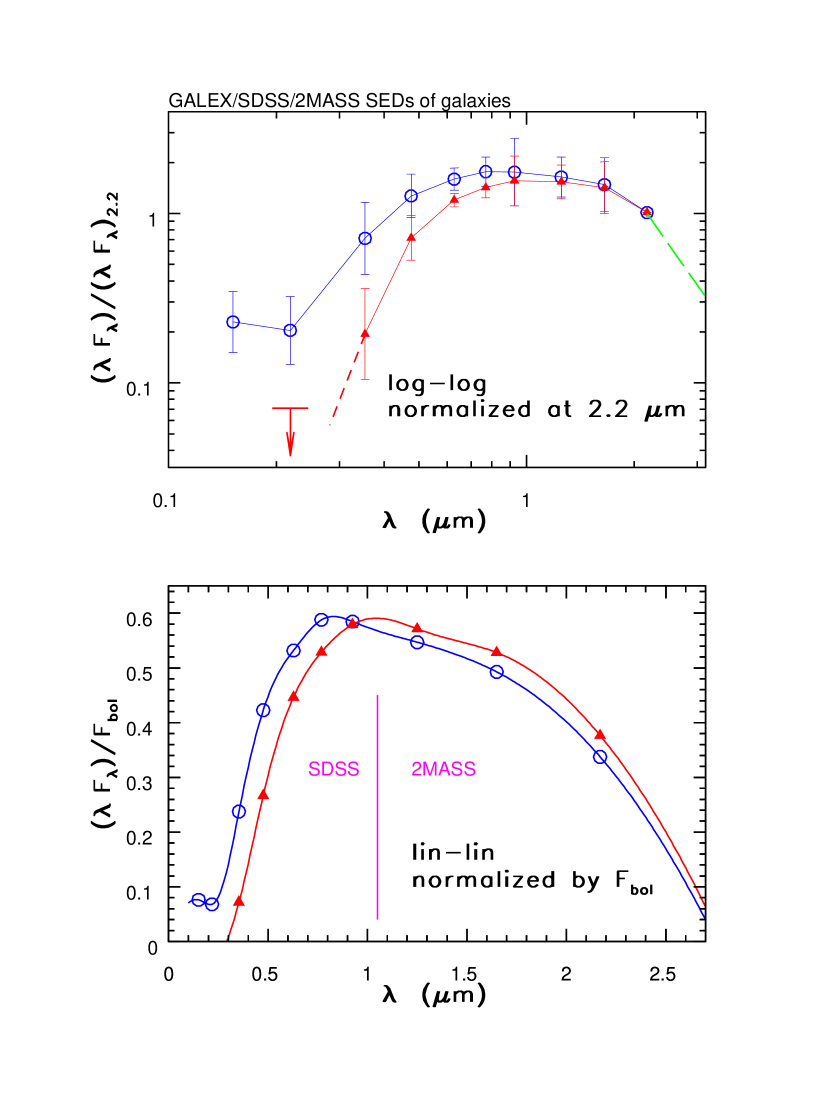
| bandpass | (m) | blue | red |
|---|---|---|---|
| f | 0.15 | 0.08 | 0.01 |
| n | 0.22 | 0.07 | 0.02 |
| u | 0.35 | 0.24 | 0.07 |
| g | 0.48 | 0.42 | 0.27 |
| r | 0.63 | 0.53 | 0.45 |
| i | 0.77 | 0.59 | 0.53 |
| z | 0.93 | 0.58 | 0.58 |
| J | 1.25 | 0.55 | 0.57 |
| H | 1.65 | 0.49 | 0.53 |
| K | 2.17 | 0.34 | 0.38 |
4.2 Do star-forming and AGN galaxies have different UV, IR, and radio properties?
In Section 2.1.2 we demonstrated that star-forming and AGN galaxies, classified using only emission-line strengths, have different broad-band optical properties such as and concentration index. Here we extend that analysis and compare their UV, IR, and radio properties.
4.2.1 The UV-color difference between star-forming and AGN galaxies
The GALEX-SDSS sample discussed here is fairly small, and we only determined the median far-UV-to-near-UV colors111111For GALEX detections we require or and correct magnitudes for interstellar extinction using and , where is the –band extinction from the maps of Schlegel, Finkbeiner & Davis (1998) distributed with SDSS data. These coefficients were evaluated using the standard interstellar extinction law from Cardelli, Clayton & Mathis (1989; M. Seibert, priv. comm.). The median for the three AIS fields is 0.12, with a root–mean–square scatter of 0.02 mag., ( and are AB magnitudes measured in the far- and near-UV GALEX bands), for the two classes. We find that star-forming galaxies are bluer (median is 0.10.1) than AGNs (median is 0.50.1). This is similar to the difference observed for (i.e., star-forming galaxies are bluer than AGNs). However, the analysis by Agüeros et al. (2005) suggests that the origin of the color differences is different for the and colors, because the latter are much more sensitive to the presence of starbursts and AGNs, while the color reflects the bolometrically dominant stellar population, as suggested by the analysis described in Section 3.1.1.
4.2.2 The IR-color difference between star-forming and AGN galaxies
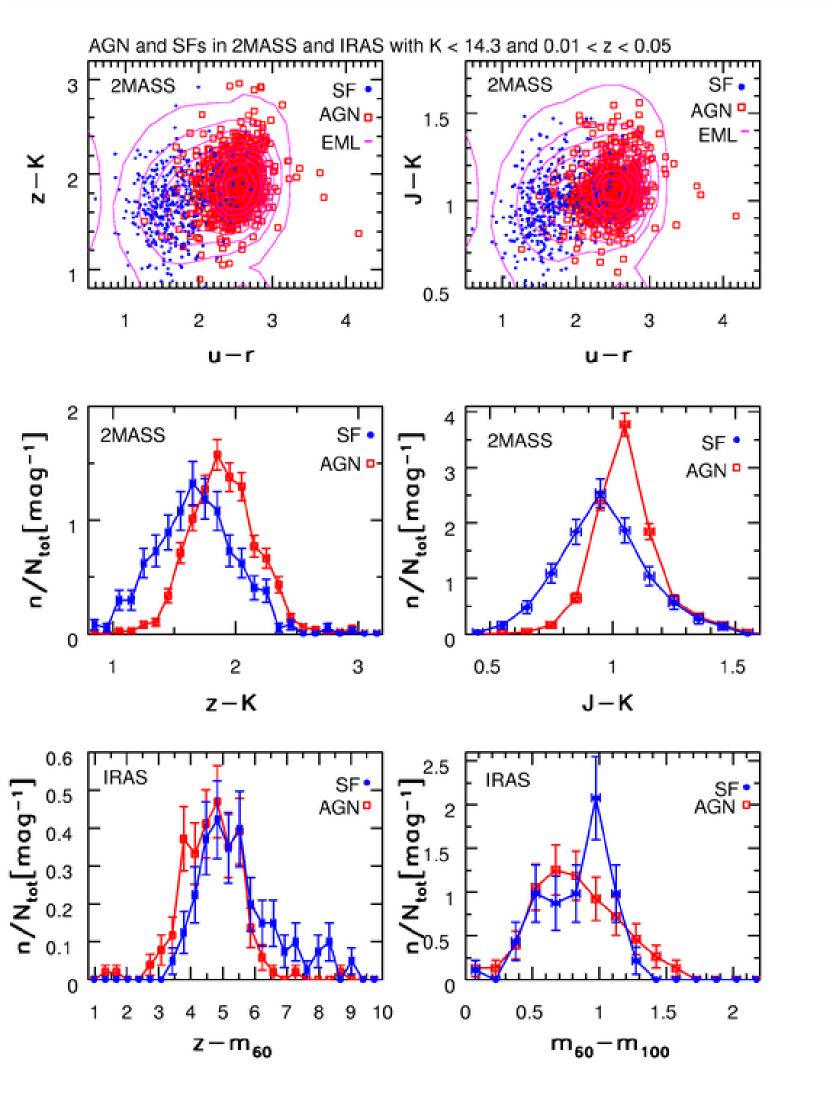
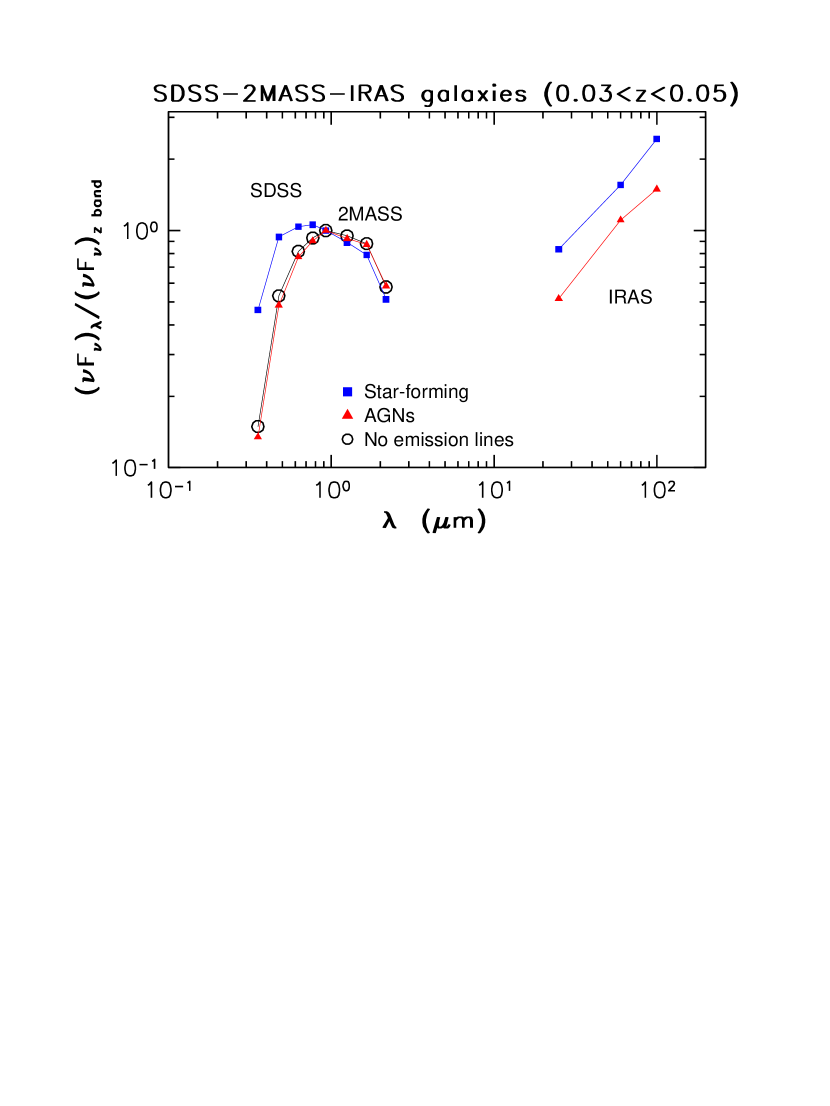
In order to study differences in infrared properties between star-forming and AGN galaxies, we use the SDSS-2MASS and SDSS-IRAS samples, and restrict the redshift range to to avoid K-correction effects (further discussed below). The distribution of these galaxies in various optical/infrared color-color diagrams is shown in Fig. 17. In general, for any combination of optical and near-IR bands, star-forming galaxies are bluer than AGNs. For example, the and mean colors differ by 0.2 and 0.1 mag, respectively. According to the Kolmogorov-Smirnov test (KS hereafter), these differences are highly statistically significant, as is easily discernible from the two middle panels. However, this relationship reverses when using far-IR bands; star-forming galaxies have redder colors by 1 mag than AGNs (the KS probability that the two subsamples are drawn from the same parent sample is ) and have a much higher fraction of sources with (see the bottom left panel). This reversal is illustrated in Fig. 18 which compares the optical-to-far-IR SEDs, normalized to the SDSS -band, for star-forming and AGN galaxies selected from a narrow redshift range. Since the -band flux is a good measure of the 0.2 - 2.2 bolometric luminosity, this implies that star-forming galaxies emit more IR radiation as a fraction of their 0.2–2.2 bolometric output, than do AGN galaxies. This difference could be partially caused by a selection effect; since the apparent -band magnitudes of star-forming galaxies tend to be somewhat fainter that those of AGN galaxies due to differences in luminosity functions and sampled redshift range, they will be detected by IRAS with the same probability only if they have somewhat redder colors. However, this effect does not seem to be quantitatively sufficient to explain the observed difference in median colors.
There are several plausible explanations for the different median colors for AGN and star-forming galaxies: star-forming galaxies could have warmer dust, significantly more dust, or more UV radiation that is absorbed by dust and re-emitted in the far-IR121212The observed difference could also be due to different dust optical properties, i.e., different ratio of far-IR to UV/optical opacity. While this possibility is not excluded by our analysis, it is not necessary in order to explain the observed trends. Similarly, we ignore the possible effects of dust geometry, e.g., the dust around AGN could have significantly different distribution than interstellar dust (e.g., Nenkova, Ivezić & Elitzur 2002). than AGN galaxies (of course, these possibilities are not mutually exclusive). Different dust temperatures is probably ruled out two types have very similar color distributions; this color is much more sensitive to dust temperature than to the amount of dust; for a detailed discussion see e.g., Ivezić & Elitzur 1997), as shown in the bottom right panel in Fig. 17. In order to test the hypothesis that the difference is caused by a different amount of dust, we compared the distributions of extinction estimates, , discussed in Section 3.2.1. As discernible from the bottom panel in Fig. 19, star-forming galaxies detected by IRAS typically have smaller than AGN galaxies, thus ruling out this hypothesis.
Thus, it appears that star-forming galaxies emit more far-IR radiation (as a fraction of bolometric flux in the 0.2–2.2 wavelength range) than AGN galaxies, despite having smaller of dust at similar temperatures, because they have significantly more UV radiation (again, as a fraction of bolometric flux in the 0.2–2.2 wavelength range) that is processed into far-IR wavelength range. This conclusion is supported by GALEX data discussed by Agüeros et al. (2005), who find a correlation between and contribution of the UV flux to the bolometric flux. Since star-forming galaxies tend to have bluer colors than AGNs (see Section 4.2.1), this implies that their UV flux contributes more to the bolometric flux than for AGN galaxies. Indeed, once a larger SDSS-GALEX-IRAS sample is available, the expected strong correlation between and (similar to, and perhaps stronger than, the correlation shown in Fig 9) can be directly tested131313The analysis of Buat et al. (2004) appears to support this expectation: they find that interstellar extinction for a far-IR flux-limited sample is higher than for a UV flux-limited sample. However, their estimates of interstellar extinction are derived from the UV-IR colors (rather than from independent data), and thus are strongly correlated with the sample flux limits. That is, the same effect would be obtained even if there were no correlation between the amount of dust in a galaxy and the UV-IR colors, and hence their analysis cannot be used to support our interpretation..
In a recent paper based on similar data, Pasquali, Kauffmann & Heckman (2005, hereafter PKH) found that the “AGN exhibit a significant excess in far-IR emission relative to star-forming galaxies”, which apparently contradicts the results presented here. However, it should be pointed out that here we discuss the amount of IR radiation (at 60 ) as a fraction of bolometric output in the 0.2–2.2 range (i.e., color), while PKH discuss the IR luminosity per unit stellar mass. Furthermore, their statement is valid for carefully selected pairs of AGN and star-forming galaxies that have similar physical characteristics such as stellar mass, color, size, etc. (it is also noteworthy that the distributions of stellar mass and stellar mass-to-light ratio are very different for AGN and star-forming galaxies, as shown by Kauffmann et al. 2003a). Hence, these are two independent, rather than contradictory, findings.
4.2.3 The radio-IR correlation
The large number of SDSS-IRAS-NVSS emission-line galaxies allows us to examine whether the well-known narrow distribution of the far-IR-to-radio flux ratio (van der Kruit 1971) is the same for (optically classified) star-forming and AGN galaxies. This correlation was interpreted by Helou et al. (1985) as a consequence of coupling between infrared thermal dust emission and radio non-thermal synchrotron emission, and it is not known whether the details of this coupling are the same for star-forming and AGN galaxies (e.g., see Bell 2003). In addition, both far-IR and radio emission are used as probes for ongoing and recent star formation (Hopkins et al. 2003 and references therein), and thus a robust measurement of this correlation is important for the comparison of studies based on different data sets.
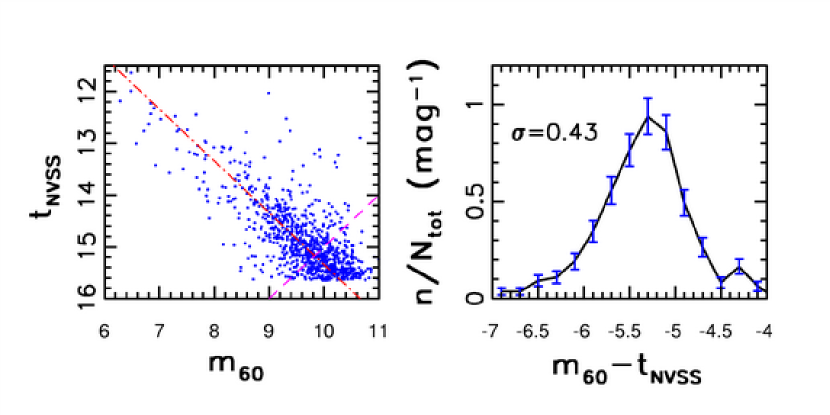
The left panel in Fig. 20 shows the radio 20 cm magnitude measured by the NVSS as a function of 60 m magnitude measured by IRAS for 948 SDSS “main” galaxies with a counterpart in IRAS FSC within 30 arcsec, and in the NVSS catalog within 15 arcsec. The strong correlation between the two fluxes141414Sometimes this correlation is shown in the luminosity vs. luminosity form, which boosts the impression of correlation strength. However, this is not a good practice since even uncorrelated measurements could give such an impression if the redshift distribution is sufficiently broad. is evident. Only about 1% of sources have anomalously bright radio emission (by about 2 mag), a fraction that is consistent with contamination by random associations (the same fractions of AGN and star-forming galaxies are found among those 1% of sources, as in the whole sample; they are all bright point sources at 20 cm), but could also be due to radio-loud objects. In order to avoid the effect of faint flux limits on the distribution of the far-IR-to-radio flux ratio (i.e., the color), we restrict the sample to 568 galaxies with (a condition perpendicular to the lines in the vs. plane, see the dashed line in the left panel in Fig. 20), and show the distribution of the color in the right panel. The median value of the color is -5.310.02 (statistical errors only), with an equivalent Gaussian width (determined from interquartile range) of 0.43 mag. Such a narrow width is quite remarkable given so different wavelengths and survey technologies, and represents a strong constraint for the theories of coupled radiation mechanisms (e.g., Helou et al. 1985). It also places an upper limit of 0.4 mag on the IRAS photometric error for galaxies.
A very similar analysis of IR-radio correlation based on a smaller sample (176 UGC galaxies) was presented by Condon & Broderick (1988), who used a slightly different parameter (sometimes also called the parameter, e.g., Bell 2003). They find a peaked distribution similar to that shown in Fig. 20, with 63 galaxies in the peak. The position of that peak corresponds to , in good agreement with our analysis based on a 10 times larger sample. The width of the distribution determined here (0.43 mag) corresponds to a width of 0.17 for the (or ) distribution, somewhat smaller than 0.26 obtained in previous studies (e.g., Yun, Reddy & Condon 2001, Bell 2003). Condon & Broderick proposed that galaxies in this peak ( ) are dominated by starbursts, while AGNs (“monsters” in their terminology) have too weak IR emission to be detected by IRAS, implying .
The high-quality SDSS spectra and corresponding BPT-diagram based separation of emission-line galaxies into AGN and star-forming galaxies allows us to examine IR-radio correlation in detail. We find that over 1/3 of SDSS-NVSS-IRAS galaxies with emission lines can be reliably classified as an AGN based on their position in the BPT diagram, with an additional 50% in the transition region (“unknown” sources, using classification described in Section 2.1.2). That is, in addition to star-forming galaxies, optically-classified AGN galaxies also follow the tight IR-radio correlation. Hence, not all the “monsters” are confined to (assuming that they are correctly recognized by BPT analysis).
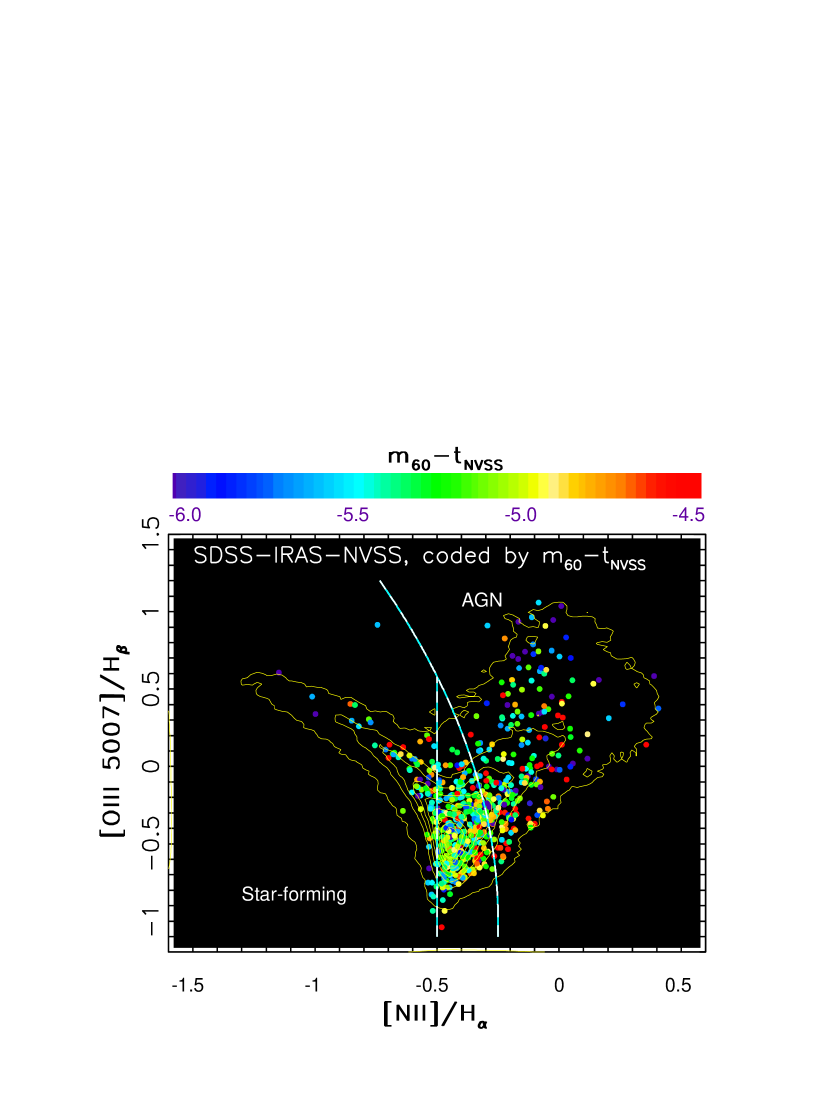
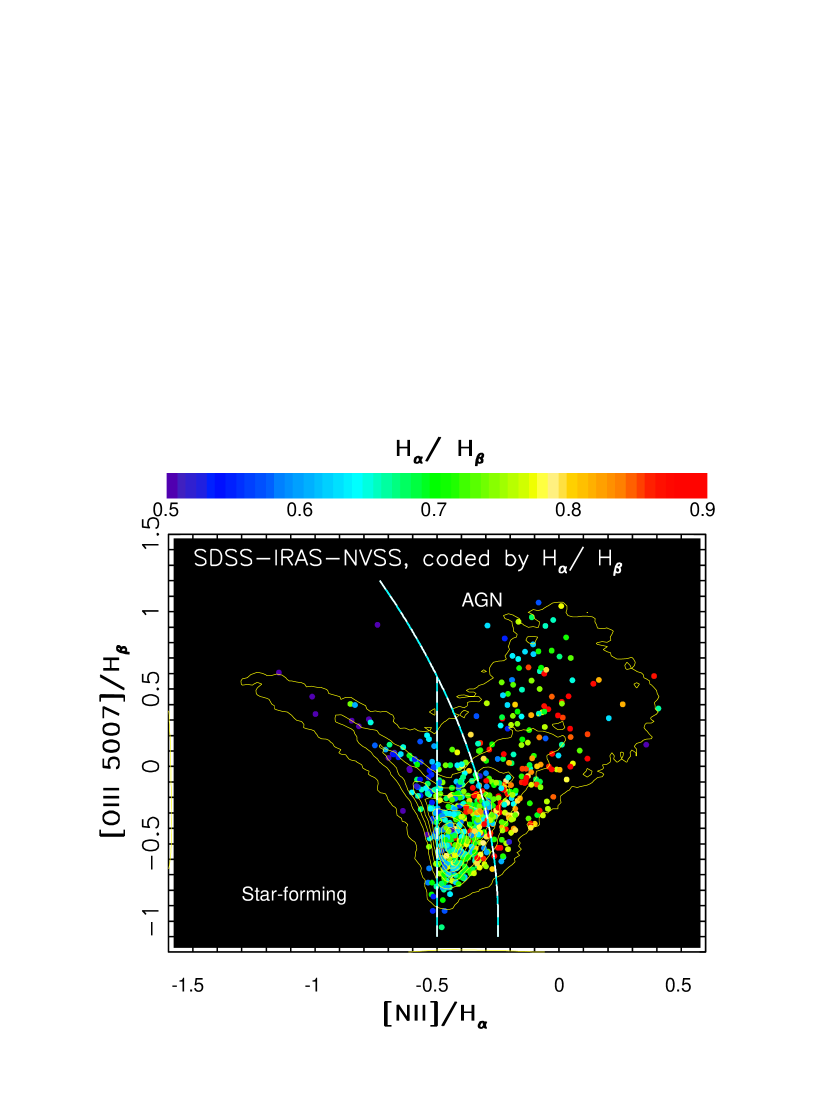
We note that the AGN/star-forming galaxy separation in the BPT diagram adopted here is fairly conservative (see Section 2.1.2). Figure 21 demonstrates that the majority of SDSS-IRAS-NVSS emission-line galaxies have ambiguous classification in the BPT diagram. However, it is easily discernible that a substantial fraction of these galaxies have optical emission-line strength ratios fully consistent with an AGN classification. The figure also shows that the position of a galaxy in the BPT diagram and the color do not appear to be correlated. Visual inspection of SDSS color composite images convincingly shows that both AGN and star-forming subsamples are dominated by galaxies with spiral morphology, as already pointed out by Condon & Broderick (1988). About half of them show disturbed morphology and nearby companions.
Using classification based on the BPT diagram, we compute and compare the slope of IR-radio correlation separately for AGN and star-forming galaxies. Two subsamples with 128 AGN and 46 star-forming galaxies yield median values of and , and widths of 0.61 and 0.38 mag, respectively151515The color measurement should not be interpreted as implying a power-law spectral energy distribution between 60 m and 20 cm with the power-law index of 0.6 (). For example, galaxies have between 6 and 20 cm (Ivezić et al. 2004a), and , implying between 100 m and 6 cm, that is, a steeper decrease of flux with wavelength, than implied by the colors.. The difference between the medians is significant, and suggests that the details of radiation coupling mechanisms may be different for star-forming and AGN galaxies (i.e., among galaxies that follow IR-radio correlation, star-forming galaxies appear to show 20% more radio emission, relative to far-IR, than AGN galaxies). We note that this result should be considered somewhat tentative because there may be systematic effects that are not included when estimating uncertainties in the medians161616Some of this difference could be due to systematically different radio morphology, an interesting possibility that is beyond the scope of this work. It is noteworthy that we did not find a correlation between the color and the radio spectral slope between 20 cm and 92 cm., and thus its significance could be overestimated. It is also noteworthy that none of star-forming galaxies have , while this is true for 4% of AGNs (that is, an opposite trend than for medians).
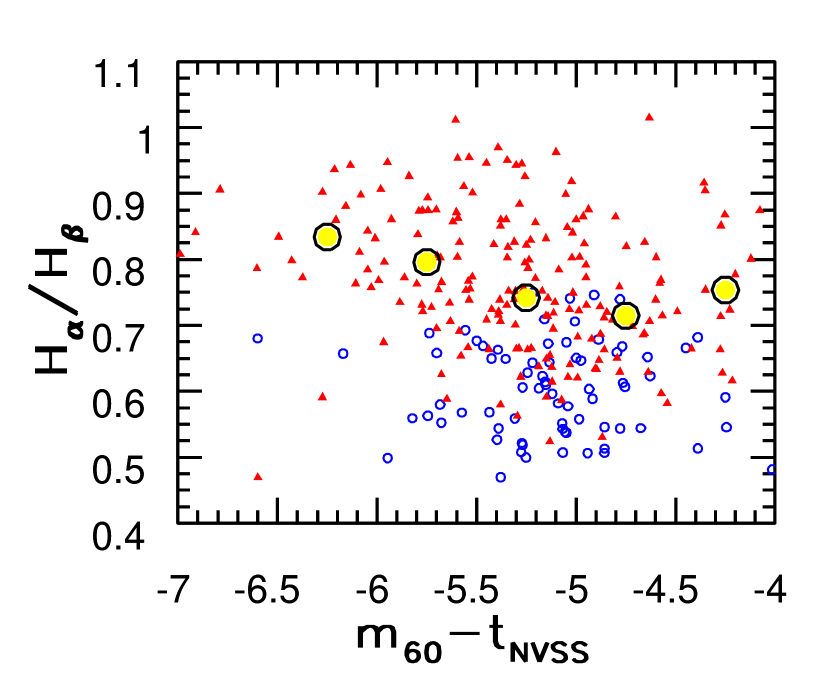
We searched for possible correlations between and other observables that could perhaps explain the different median values of this color for AGN and star-forming subsamples (either as selection effects, bad data, bad analysis method, or astrophysics). We analyzed quantities such as colors, redshift, stellar mass, luminosity, angular size, dust extinction estimate , etc., and the only quantity that appears to have an effect on is the ratio, as shown in Fig. 22 (see also Fig. 23 which illustrates correlation between the ratio and the position in BPT diagram). Star-forming galaxies are confined to the region, while AGN galaxies span the whole observed range of . Furthermore, as the line strength ratio increases, the strength of IR emission for AGN galaxies, relative to radio emission, also increases (i.e., the color becomes bluer). Since the measurement of is fully independent of the measurement, this behavior provides additional support for the 3 significant difference in the slopes of IR-radio correlation for star-forming and AGN galaxies (note, however, that the AGN presence could have an effect on the measured ratio). It is noteworthy that there is no evidence for a similar behavior in the vs diagram, although some degree of correlation exists between and . This may mean that the effects of gas and dust on infrared and radio emission are more complex than implied by a simple linear IR-radio correlation (for a detailed discussion of this possibility see Bell 2003).
Given that both AGN and star-forming subsamples of SDSS-NVSS-IRAS galaxies follow very similar, if not identical, radio-IR correlation, it is interesting to investigate what fraction of the full SDSS-NVSS and SDSS-IRAS subsamples could follow this correlation (that is, galaxies that are detected by only two, instead of all three, surveys). We perform this analysis by using the observed radio-IR correlation to predict for SDSS-IRAS galaxies, or for SDSS-NVSS galaxies. In the second step we select galaxies with predicted fluxes 1 mag brighter than the faint limit of the corresponding third catalog (to account for the scatter due to photometric errors), and then determine what fraction of these galaxies are actually detected. For example, if every IRAS galaxy follows IR-radio correlation, then we estimate that of SDSS-IRAS galaxies with predicted should be detected by NVSS. We find that indeed 92% of SDSS-IRAS galaxies with are detected by NVSS.
The converse is not true. Only about 1/3 of SDSS-NVSS emission-line galaxies with are detected by IRAS. This is consistent with a hypothesis that there is another source of radio emission, in addition to the component that is correlated with IR emission. The elevated radio emission is then responsible for the NVSS detection, but IR emission is too weak for an IRAS detection. Presumably, those AGNs that are detected by both NVSS and IRAS are mostly radio-quiet, while those with elevated radio emission are mostly radio-loud. Not surprisingly, SDSS-NVSS emission-line galaxies without IRAS detection have typically redder colors than those detected by both NVSS and IRAS (the difference in medians is 0.6 mag). The detection fraction by IRAS is different for AGN and star-forming subsamples of SDSS-NVSS sample: while 50% of star-forming SDSS-NVSS galaxies are detected by IRAS, this is true for only 20% of AGNs (for galaxies with ). These statistics indicate that the majority (80%) of emission-line galaxies classified optically as AGNs emit more flux at radio wavelengths than implied by their IR fluxes and the mean IR-radio correlation. Again, practically all of those remaining 20% AGNs from SDSS-NVSS subsample that are also detected by IRAS do follow a very tight IR-radio correlation.
4.3 Adding panchromatic information to the BPT diagram
In preceding Sections we have discussed the broad-band panchromatic properties of galaxy samples selected by their emission-line properties with the aid of the BPT diagram (see Section 2.1.2). In this Section we study how the morphology of galaxy distribution in the BPT diagram changes when requiring detections at other wavelengths (see Figs.24 to 28).
The AGN-to-star-forming galaxy number ratio is 1.6 for the whole SDSS sample. Although we exclude a large number of galaxies with uncertain classification (see Section 2.1.2), this ratio is a good relative measure of the changes in the BPT diagram171717Note that the AGN-to-star-forming galaxy number ratio depends on the adopted cutoff for the emission line detection significance. Higher values than the 3 adopted here (see Section 2.1.2) would result in a lower AGN-to-star-forming galaxy number ratio because many AGNs are very weak-lined LINERs (Heckman et al. 2004).. We find that the AGN-to-star-forming galaxy number ratio is systematically larger for subsamples with detection at other wavelengths, except for SDSS-GALEX sample, and it is the largest for SDSS-2MASS sample (10.1). Such a high ratio for SDSS-2MASS sample is a consequence of fairly bright K-band flux limit, and the fact that AGN galaxies have redder optical-to-near-IR SEDs than star-forming galaxies.
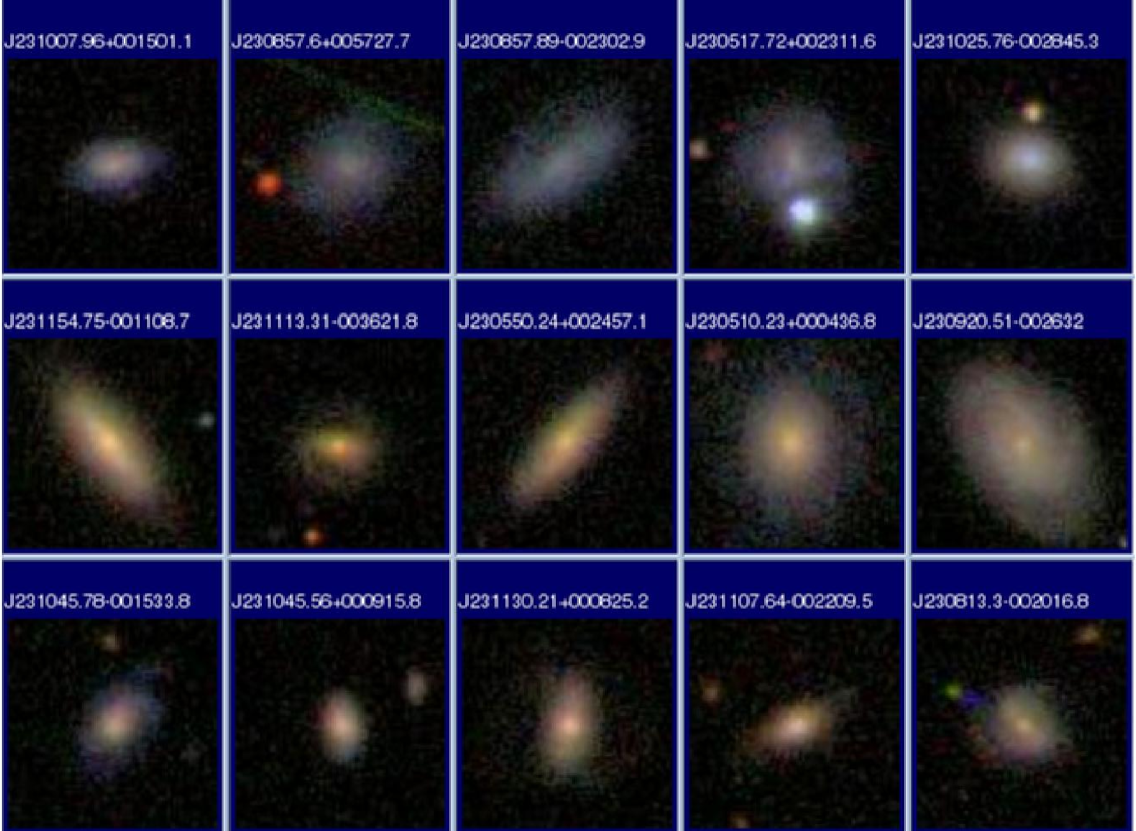
The AGN-to-star-forming galaxy number ratio is the smallest for SDSS-GALEX sample (0.1, but it could be as high as 0.3 if the unclassified galaxies are dominated by AGN galaxies, see Fig. 28). The lower limit on this ratio is sufficiently high to exclude the possibility that SDSS-GALEX galaxies represent a clean sample of starburst galaxies. In order to present further evidence for this claim, we have visually inspected SDSS color composite images of these galaxies (a total of 55) and found that the classification based on emission-line strengths is well correlated with morphology. SDSS images of random subsamples of AGN, star-forming, and unclassified galaxies are shown in Fig. 29. Clear morphological differences between galaxies classified as star-forming and as AGN are easily discernible, with the latter being more centrally concentrated. This further demonstrates that at least some GALEX/SDSS galaxies are more likely to be AGN than star-forming.
4.4 An improvement of the K band flux prediction
In Section 3.1.1 we showed that it is possible to estimate the -band magnitude with a scatter as small as 0.2 mag using only SDSS data. In this Section we explore whether the residuals between predicted and 2MASS -band magnitudes correlate with several model-dependent quantities determined by Kauffmann et al. (2003a), and whether the residuals show the same behavior when AGN and star-forming galaxies are treated separately.
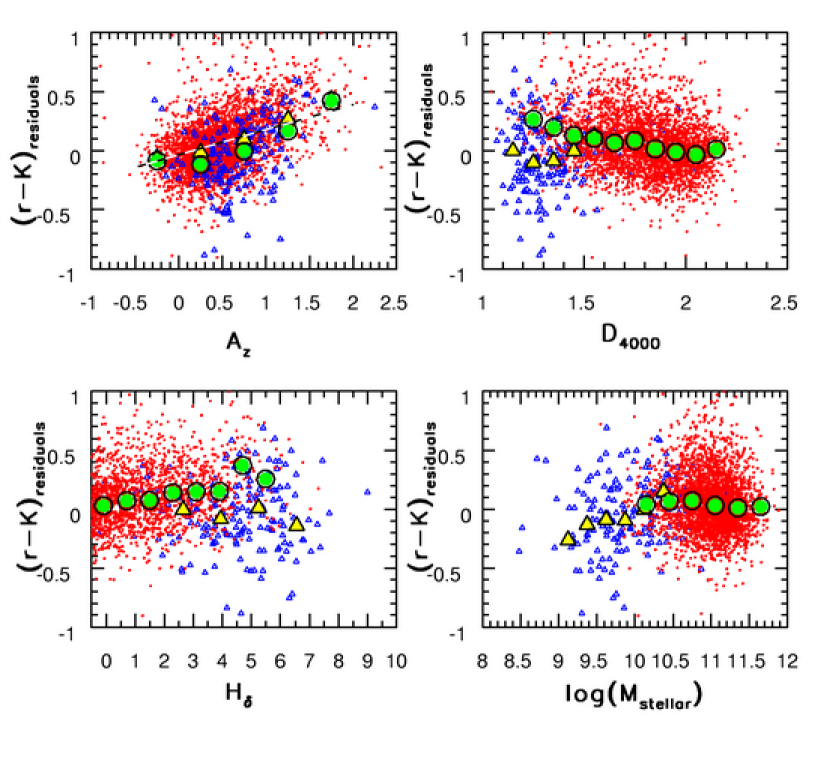
The strongest correlation between the -band SDSS-2MASS residuals and another quantity is found for , the galaxy dust content discussed in detail in Section 3.2.1. The top panel in Fig. 31 illustrates this correlation. A best straight line fit is given by
| (6) |
This correlation may be interpreted as the effect of dust on the observed -band flux (however, note that the simple extinction screen approximation is probably not appropriate). When this correlation is subtracted from given by the eq. 1, the width of the residuals distribution decreases by a factor of 2, to 0.1 mag! In other words, given the color, redshift, and determined using SDSS data, the 2MASS -band measurements can be predicted with a scatter of only 0.1 mag. Most of this scatter can be attributed to the measurement errors. For example, assuming conservative lower limits for errors in (0.03 mag), (0.03 mag, Jarrett et al. 2000), and (2%), the expected scatter due to measurement errors is 0.09 mag. Hence, the observed residual scatter of 0.1 mag is likely dominated by measurement errors. We note that the final distribution of the residuals shown in the bottom panel in Fig. 30 is skewed. This could be due to the fact that the dependence of the residuals on was fit by a straight line, while the data display some curvature. Also, it could be that there are two subpopulations of galaxies that have slightly different SEDs.
Since the residual astrophysical scatter is apparently much smaller than 0.1 mag, one is tempted to conclude that 2MASS measurements are not required to study SDSS galaxies. This would not be a valid conclusion for at least two reasons. First, the measurement error for 2MASS band magnitudes is 0.03 mag, which is smaller than the residual scatter for predicted band magnitudes (0.1 mag). Second, we have not investigated morphological properties of galaxies in the near-IR, where smaller dust extinction could reveal features not visible in the optical wavelength range.
We have also studied the correlation between the -band SDSS-2MASS residuals and the 4000 Å break (), the strength of line, and stellar mass (Fig. 31). None of the correlations is as strong as the correlation with . As shown in Fig. 31, the overall behavior of AGN and star-forming subsamples are similar to each other, though not identical.
4.4.1 Comparison with Bruzual & Charlot models
Motivated by the surprisingly small residual scatter in the K band flux prediction (0.1 mag), we have investigated the Bruzual & Charlot (1993, 2003) model predictions for the distribution of optical and near-IR galaxy colors. The top left panel in Fig. 32 shows that for a given galaxy type, the color is a function of redshift, and at a given redshift the color is a function of galaxy type. This behavior is in agreement with observations, although model galaxies have the colors too blue by several tenths of a magnitude. The models are also in agreement with a vs. redshift relation that is independent of galaxy type, as discussed in Section 3.1.1 (see top right panel).
The behavior of simple stellar populations (as opposed to synthetic galaxies) in the same diagrams suggests that both the and colors are sensitive to metallicity, with about 0.7 mag and 0.2 mag redward shifts in the and colors as the metallicity increases by a factor of 10. The observed small residual scatter in the K band flux prediction thus implies that the galaxy metallicity distribution is fairly narrow: about 0.2 dex around the median value. This is in agreement with Tremonti et al. (2004) who found a very tight mass-metallicity relation (0.1 dex metallicity scatter at a given mass).
5 Summary and Discussion
This study indicates the enormous potential of modern massive sensitive large–scale surveys, and emphasizes the added value obtained by combining data from different wavelengths. While qualitatively our study is in agreement with previous work (e.g., galaxies detected by IRAS tend to be blue), the sample size and the wealth of measured parameters allowed us to obtain some qualitatively and quantitatively new results.
Galaxy SEDs form a nearly one-dimensional sequence in the optical-to-near-IR range. For example, the SDSS and -band data, supplemented with redshift and dust content estimate, can be used to predict -band magnitudes measured by 2MASS with an rms scatter of only 0.1 mag and the intrinsic astrophysical scatter probably significantly smaller. Within the restricted wavelength range probed by SDSS, this scatter is even smaller. Smolčić et al. (2006) show that the rest-frame color (5500–8500 Å wavelength range) can be predicted with an rms of only 0.05 mag using Strömgren colors evaluated in the 4000–5800 Å wavelength range. Smolčić et al. (2006) also find a strong correlation between Strömgren colors and the position of a galaxy in the BPT diagram, a result that is confirmed here using the color. As shown by Smolčić et al., other parameters, such as those determined by Kauffmann et al. (2003a), can also be used to parametrize the position of a galaxy on this one-dimensional sequence in the multi-dimensional color space. Or equivalently, using the terminology from Yip et al. (2004), most of the variance in galaxy SEDs is already absorbed in the first few principal components.
We integrate the broad-band UV-to-near-IR SEDs of dominant galaxy types and find that the -band flux is the closest, color-independent, proxy for bolometric flux measurement in the 0.2–2.2 range for galaxies with redshifts smaller than 0.2.
We find that galaxies detected by GALEX include a non-negligible fraction (10-30%) of AGNs, and hence do not represent a clean sample of starburst galaxies. This conclusion is supported by their color distribution, position in the BPT diagram, and morphological appearance (see Agüeros et al. 2005 for more details).
We demonstrate that interstellar dust content inferred from optical spectra by Kauffmann et al. (2003a) is indeed higher for galaxies detected by IRAS confirming the reliability of the measurement. This represents a dramatic independent support for the notion that these model-based optical estimates of are related to the galaxy dust content. Furthermore, can be used with the -band measurements to predict IRAS 60 m flux within a factor of 2, which suggests that the Bruzual & Charlot (1993, 2003) models used to derive provide fairly good description of the relevant physics. Even more detailed and robust analysis along these lines will be possible with the advent of GALEX and Spitzer data.
We find that star-forming galaxies tend to be bluer than AGN galaxies for all photometric bands bluewards from the -band, while they have redder far-IR-to-optical colors. We conclude that star-forming galaxies have redder far-IR-to-optical colors than AGN galaxies because they have more UV light that is processed to far-IR range, as a fraction of the 0.2–2.2 bolometric flux. We emphasize that a variety of different data for the same galaxy sample was required to reach this conclusion: GALEX, SDSS, 2MASS, and IRAS photometry, as well as the interstellar dust content inferred from SDSS optical spectra with the aid of sophisticated models.
A large sample of galaxies that have SDSS spectra and are detected by IRAS and NVSS allowed us to study the IR-radio correlation separately for star-forming and AGN galaxies. We confirm that both galaxy types follow a tight correlation, and find that a large fraction (80%) of optically classified SDSS-NVSS AGN galaxies show significantly more radio emission than expected from their IR flux (technically, we show that IR fluxes predicted from observed radio emission for galaxies that are not detected by IRAS are higher than the corresponding IRAS upper flux limits, see Section 4.2.3). We also find marginal evidence for different slopes of IR-radio correlation for AGN and star-forming subsamples, an effect that seems to be related to the line strength ratio.
Perhaps the most important conclusion of our study is that little more than a single datum can be learned about galaxies from photometric data whose accuracy is not demonstrably better than 0.1 mag. Fortunately, all three major modern galaxy surveys, GALEX, SDSS, and 2MASS, appear to have achieved this goal and, together with surveys such as FIRST and NVSS, opened unprecedented opportunities for detailed studies of galaxies.
Acknowledgments
M.O. is grateful to Alex Szalay, Mercedes Filho, and Peter Barthel for their insights, and to Princeton University and University of Washington for financial support.
Funding for the SDSS and SDSS-II has been provided by the Alfred P. Sloan Foundation, the Participating Institutions, the National Science Foundation, the U.S. Department of Energy, the National Aeronautics and Space Administration, the Japanese Monbukagakusho, the Max Planck Society, and the Higher Education Funding Council for England. The SDSS Web Site is http://www.sdss.org/.
The SDSS is managed by the Astrophysical Research Consortium for the Participating Institutions. The Participating Institutions are the American Museum of Natural History, Astrophysical Institute Potsdam, University of Basel, Cambridge University, Case Western Reserve University, University of Chicago, Drexel University, Fermilab, the Institute for Advanced Study, the Japan Participation Group, Johns Hopkins University, the Joint Institute for Nuclear Astrophysics, the Kavli Institute for Particle Astrophysics and Cosmology, the Korean Scientist Group, the Chinese Academy of Sciences (LAMOST), Los Alamos National Laboratory, the Max-Planck-Institute for Astronomy (MPA), the Max-Planck-Institute for Astrophysics (MPIA), New Mexico State University, Ohio State University, University of Pittsburgh, University of Portsmouth, Princeton University, the United States Naval Observatory, and the University of Washington.
The FIRST Survey is supported in part under the auspices of the Department of Energy by Lawrence Livermore National Laboratory under contract No. W-7405-ENG-48 and the Institute for Geophysics and Planetary Physics.
This publication makes use of data products from the Two Micron All Sky Survey, which is a joint project of the University of Massachusetts and the Infrared Processing and Analysis Center/California Institute of Technology, funded by the National Aeronautics and Space Administration and the National Science Foundation.
The Galaxy Evolution Explorer (GALEX) is a NASA Small Explorer. The mission was developed in cooperation with the Centre National d’Etudes Spatiales of France and the Korean Ministry of Science and Technology.
References
- (1) Abazajian, K., Adelman, J.K., Agüeros, M., et al. 2003, AJ, 126, 2081
- (2) Agüeros, M.A., Ivezić, Ž., Covey, K.R., et al. 2005, AJ, 130, 1022
- (3) Anderson, S.F., Voges, W., Margon, B., et al. 2003, AJ, 126, 2209
- (4) Baldry, I.K, Glazebrook, K., Brinkmann, J., et al. 2004, ApJ, 600, 681
- (5) Baldwin, J., Phillips, M., & Terlevich, R. 1981, PASP, 93, 5
- (6) Becker, R.H., White, R.L., & Helfand, D.J. 1995, ApJ, 450, 559
- (7) Beichman, C.A., Neugebauer, G., Habing, H.J., Clegg, P.E. & Chester, T.J. 1985, IRAS Catalogs and Atlases (US GPO, Washington, DC)
- (8) Bell, E.F. 2003, ApJ, 586, 794
- (9) Bell, E.F., McIntosh, D.H., Katz, N. & Weinberg, M.D. 2003, ApJ, 585, L117
- (10) Best, P.N., Kauffmann, G., Heckman, T.M. & Ivezić, Ž. 2005a, MNRAS, 362, 9
- (11) Best, P.N., Kauffmann, G., Heckman, T.M., et al. 2005b, MNRAS, 362, 25
- (12) Blanton, M.R., Hogg, D.W., Bahcall, N.A., et al. 2003, ApJ, 592, 819
- (13) Brinchmann, J., Charlot, S., White, S.D.M., Tremonti, C., Kauffmann, G., Heckman, T., Brinkmann, J. 2004, MNRAS, 351, 1151
- (14) Bruzual, G. & Charlot, S. 1993, ApJ, 405, 538
- (15) Bruzual, G. & Charlot, S. 2003, MNRAS, 344, 1000
- (16) Buat, V., Iglesias-Páramo, J., Seibert, M., et al. 2005, ApJ, 619, 51
- (17) Cardelli, J.A., Clayton, G.C., & Mathis, J.S. 1989, ApJ, 345, 245
- (18) Chang, R., Gallazzi, A., Kauffmann, G., Charlot, S., Ivezić, Ž., Brinchmann, J. & Heckman, T.M. 2005, accepted by MNRAS (also astro-ph/0502117)
- (19) Condon, J.J., Cotton, W.D., Greisen, E.W., Yin, Q.F., Perley, R.A., Taylor, G.B., & Broderick, J.J. 1998, AJ, 115, 1693
- (20) Condon, J.J. & Broderick, J.J. 1988, AJ, 96, 30
- (21) Eisenstein, D.J., Hogg, D.W., Fukugita, M., et al. 2002, ApJ, 585, 694
- (22) Finlator, K., Ivezić, Ž., Fan, X., et al. 2000, AJ, 120, 2615
- (23) Fukugita, M., Ichikawa, T., Gunn, J.E., Doi, M., Shimasaku, K., & Schneider, D.P. 1996, AJ, 111, 1748
- (24) Goto, T. 2005, MNRAS, 360, 322
- (25) Gregory, P.C., Scott, W.K., Douglas, K., & Condon, J.J. 1996, ApJS, 103, 427
- (26) Gunn, J.E. & Oke, J.B. 1975, ApJ, 195, 255
- (27) Gunn, J.E., Carr, M., Rockosi, C., et al. 1998, AJ, 116, 3040
- (28) Hao, L., Strauss, M.A., Tremonti, C.A., et al. 2005, AJ, 129, 1783
- (29) Heckman, T.M., Kauffmann, G., Brinchmann, J., Charlot, S., Tremonti, C. & White, S.D.M. 2004, ApJ, 613, 109
- (30) Helou, G., Soifer, B.T.& Rowan-Robinson, M. 1985, ApJ, 298, 7
- (31) Hogg, D.W., Finkbeiner, D.P., Schlegel, D.J. & Gunn, J.E. 2002, AJ, 122, 2129
- (32) Hopkins, A.M., Miller, C.J., Nichol, R.C., et al. 2003, ApJ, 599, 971
- (33) Ivezić, Ž. & Elitzur, M. 1997, MNRAS 287, 799
- (34) Ivezić, Ž., Becker, R.H., Blanton, M. et al. 2001a, in AGN Surveys, IAU Colloq. 184, eds. R.F. Green, E.Ye. Khachikian & D.B. Sanders (San Francisco: ASP), p. 137 (astro-ph/0111024)
- (35) Ivezić, Ž., Tabachnik, S., Rafikov, R., et al. 2001b, AJ, 122, 2749
- (36) Ivezić, Ž., Menou, K., Knapp, G.R., et al. 2002, AJ, 124, 2364
- (37) Ivezić, Ž., Siverd, R., Steinhardt, W., et al. 2004a, in Multiwavelength AGN Surveys, Guillermo Haro Conf., eds. Mújica, R. & Maiolino, R. (Conzumel, Mexico), p. 53 (astro-ph/0403314)
- (38) Ivezić, Ž., Lupton, R.H., Schlegel, D., et al. 2004b, AN, 325, No. 6-8, 583 (astro-ph/0410195)
- (39) Jarrett, T.H., Chester, T., Cutri, R., Schneider, S., Skrutskie, M., & Huchra, J.P. 2000, AJ, 119, 2498
- (40) Lupton, R.H., Ivezić, Ž., Gunn, J.E., Knapp, G.R., Strauss, M.A. & Yasuda, N. 2002, in “Survey and Other Telescope Technologies and Discoveries”, eds. Tyson, J.A. & Wolff, S., Proceedings of the SPIE, 4836, 350
- (41) Kauffmann, G., Heckman, T.M., White, S.D.M., et al. 2003a, MNRAS, 341, 33
- (42) Kauffmann, G., Heckman, T.M., White, S.D.M., et al. 2003b, MNRAS, 341, 54
- (43) Kauffmann, G., Heckman, T.M., Tremonti, C.A., et al. 2003c, MNRAS, 346, 1055
- (44) Kewley, L., Jansen, R.A. & Geller, M.J. 2005, PASP 117, 227
- (45) McIntosh, D.H., Bell, E.F., Weinberg, M.D. & Katz, N. 2005, astro-ph/0511737
- (46) Moustakas, J., Kennicutt, R.C. & Tremonti, C.A. 2005, astro-ph/0511730
- (47) Nenkova, M., Ivezić, Ž., Elitzur, M. 2002, ApJ, 570, L9
- (48) Pasquali, A., Kauffmann, G. & Heckman, T.M. 2005, MNRAS, 361, 1121
- (49) Petrosian, V. 1976, AJ, 209, L1
- (50) Pier, J.R., Munn, J.A., Hindsley, R.B., Hennesy, G.S., Kent, S.M., Lupton, R.H. & Ivezić, Ž. 2003, AJ, 125, 1559
- (51) Rengelink, R.B., Tang, Y., de Bruyn, A.G., Miley, G.K., Bremer, M.N., Roettgering, H.J.A. & Bremer, M.A.R. 1997, A&AS, 124, 259
- (52) Richards, G.T., Fan, X., Newberg, H.J., et al. 2002, AJ, 123, 2945
- (53) Schlegel, D.J., Finkbeiner, D.P.; Davis, M. 1998, ApJ, 500, 525
- (54) Schmitt, H.R., Kinney, A.L., Calzetti, D. & Storchi Bergman, T. 1997, AJ, 114, 592
- (55) Shimasaku, K., Fukugita, M., Doi, M., et al. 2001, AJ, 122, 1238
- (56) Smith, J.A., Tucker, D.L., Kent, S.M., et al. 2002, AJ, 123, 2121
- (57) Smolčić, V., Ivezić, Ž., Gaćeša, M., et al. 2006, submitted to MNRAS
- (58) Stoughton, C., Lupton, R.H., Bernardi, M., et al. 2002, AJ, 123, 485
- (59) Strateva, I., Ivezić, Ž., Knapp, G.R., et al. 2001, AJ, 122, 1861
- (60) Strauss, M.A., Weinberg. D.H., Lupton, R.H., et al. 2002, AJ, 124, 1810
- (61) Tremonti, C.A., Heckman, T.M., Kauffmann, G., Brinchmann, J., Charlot, S., White, S.D.M., Seibert, M., Peng, E.W. Schlegel, D.J., Uomoto, A., Fukugita, M. & Brinkmann, J. 2004, ApJ, 613, 898
- (62) Voges, W.H., Aschenbach, B., Boller, Th., et al. 1999, A&A, 349, 389
- (63) Voges, W.H., Aschenbach, B., Boller, Th., et al. 2000, IAU Circ., 7432, 1
- (64) van der Kruit, P. 1971, A&A, 15, 110
- (65) Yasuda, N., Fukugita, M., Narayanan, V.K., et al. 2001, AJ, 122, 1104
- (66) Yip, C.W., Connolly, A.J., Szalay, A. et al. 2004, AJ, 128, 585
- (67) York, D.G., Adelman, J., Anderson, S., et al. 2000, AJ, 120, 1579
- (68) Yun, M.S., Reddy, N.A. & Condon, J.J. 2001, ApJ, 554, 803
Appendix A Technical summary of the analyzed surveys
A.1 Sloan Digital Sky Survey
SDSS (www.sdss.org) is a digital photometric and spectroscopic survey that will cover one quarter of the Celestial Sphere in the North Galactic cap and produce a smaller area ( 225 deg2), but much deeper, survey in the Southern Galactic hemisphere (York et al. 2000, Stoughton et al. 2002, Abazajian et al. 2003, and references therein). The flux densities of detected objects are measured almost simultaneously in five bands (, , , , and , Fukugita et al. 1996, Hogg et al. 2002, Smith et al. 2002;) with effective wavelengths of 3551 Å, 4686 Å, 6166 Å, 7480 Å, and 8932 Å (Gunn et al. 1998), accurate to 0.02 mag (root-mean-square scatter for sources not limited by photon statistics, and also for zeropoints, Ivezić et al. 2004b). The survey will result in photometric measurements for close to 100 million stars and a similar number of galaxies. Astrometric positions are accurate to better than 0.1 arcsec per coordinate (rms) for sources with (Pier et al. 2003), and the morphological information from the images allows reliable star-galaxy separation to 21.5 mag (Lupton et al. 2002). The imaging data are used to select sources for follow-up spectroscopic observations, which will result in over a million spectra. The spectra have a resolution of 1800-2000 in the wavelength range from 3800 to 9200 Å. Extragalactic sources targeted in the SDSS spectroscopic survey include a flux-limited “main” galaxy sample (17.77, Strauss et al. 2002), the luminous red galaxy sample (Eisenstein et al. 2002), and quasars (Richards et al. 2002).
A.2 ROSAT Survey
The ROentgen SATellit (ROSAT, 1990-1999) was an X-ray observatory which included the X-Ray Telescope (XRT) with its 2.4 m focal-length mirror assembly consisting of four nested Wolter-I mirrors. The focal plane instrumentation consisted of the Position Sensitive Proportional Counter (PSPC) and the High Resolution Imager (HRI). The Wide-Field Camera (WFC) with its 0.525 m focal-length mirror assembly consisting of three nested Wolter-Schwarzschild mirrors (co-aligned with the XRT). XRT covered 6-100Å(2.4-0.12keV) band, and the WFC covered the 60-300Å (0.21-0.05keV) band. ROSAT provided a 2 degree diameter field of view with the PSPC in the focal plane, and 40 arcmin diameter field of view with the HRI in the focal plane. The main aim of the ROSAT mission was the first all-sky survey with imaging X-ray and XUV telescopes; its X-ray sensitivity was about a factor of 1000 higher than that of the UHURU satellite. About 100,000 sources have been detected in the survey, an order of magnitude more than were known before ROSAT (Voges et al. 1999, Voges et al. 2000).
A.3 GALEX Survey
The Galaxy Evolution Explorer (GALEX) was launched in April 2003, and will eventually map the entire sky in two bands: the near ultraviolet (NUV; 1750–2800 ) and the far ultraviolet (FUV; 1350–1750 ), and to faint flux levels (m=20-25, AB). GALEX’s 0.5 m telescope and field of view will also be used to make deep observations (tens of kiloseconds) of individual interesting fields (such as the Lockman Hole and the Chandra Deep Field–South). The mission’s primary science goal is to observe star-forming galaxies and to track galaxy evolution. The GALEX Early Release Observations used here include three AIS fields (see www.galex.caltech.edu) which overlap with the SDSS footprint.
A.4 2MASS Survey
2MASS used two 1.3-meter telescopes, one at Mt. Hopkins, AZ, and one at CTIO, Chile, to survey the entire sky in near-infrared light (see www.ipac.caltech.edu/2mass). Each telescope’s camera was equipped with three arrays (the pixel size is 2 arcsec) of HgCdTe detectors which simultaneously observed in the (1.25 ), (1.65 ), and (2.17 ) bands. The detectors were sensitive to point sources brighter than about 1 mJy at the level, corresponding to limiting (Vega-based) magnitudes of 15.8, 15.1, and 14.3, respectively. Point-source photometry is repeatable to better than 10% precision at this level, and the astrometric uncertainty for these sources is less than 0.2 arcsec. The 2MASS catalogs contain positional and photometric information for 470,992,970 point sources (2MASS PSC) and 1,647,599 extended sources (2MASS XSC). Details about 2MASS photometry of galaxies can be found in Jarrett et al. (2000).
A.5 IRAS Survey
The Infrared Astronomical Satellite (IRAS, Beichman et al. 1985) produced an almost all-sky survey ( 98% of the sky) at 12, 25, 60 and 100 , with the resulting IRAS point source catalog (IRAS PSC) containing over 250,000 sources, and the Faint Source Catalog additional 173,000 sources. While the IRAS faint limits are of order 1 Jy, it remains a valuable resource due to its important wavelength range and nearly full sky coverege.
A.6 Radio Surveys
The basic properties of the radio surveys considered here are:
GB6: The Green Bank GB6 survey (GB6, Gregory et al. 1996) is at 4850 MHz (6 cm), with 3 arcmin resolution, and covers the declination band between and . The completeness limit of the GB6 catalog is 18 mJy, and it includes 75,000 sources.
NVSS: The NRAO VLA Sky Survey (NVSS, Condon et al. 1998) is a 1.4 GHz (20 cm) survey with 45 arcsec resolution, and covers the sky north of declination. The completeness limit of the NVSS catalog is about 2.5 mJy, and it includes 1.8 million sources.
FIRST: The Faint Images of the Radio Sky at Twenty-centimeters (FIRST, Becker, White & Helfand 1995) is a 1.4 GHz (20 cm) survey with 5 arcsec resolution, and will cover a quarter of the sky matched to the SDSS footprint. The completeness limit of the FIRST catalog is 1 mJy, and it will include about 1 million sources. The FIRST survey provides the highest resolution and most accurate radio positions among the large radio surveys. It also has the highest source density of about 90 deg-2.
WENSS: The Westerbork Northern Sky Survey (WENSS, Rengelink et al. 1997) is a 326 MHz (92 cm) survey with cos() resolution, and covers the sky north of declination. The completeness limit of the WENSS catalog is 18 mJy, and it includes 230,000 sources.