A Comptonization Model for the Prompt Optical and Infrared Emission of GRB 041219A
Abstract
Prompt optical emission from the -ray burst of GRB 041219A has been reported by Vestrand et al. There was a fast rise of optical emission simultaneous with the dominant -ray pulse, and a tight correlation with the prompt -ray emission has been displayed. These indicate that the prompt optical emission and -ray emission would naturally have a common origin. We propose that this optical component can be modeled by considering the Comptonization of -ray photons by an electron cloud. As a result of this mechanism, the arrival time of the optical photons is delayed compared with that of the -rays. We restrict that the lag time to be shorter than s, within which the prompt optical emission is considered to vary simultaneously with the prompt -ray emission. Taking the observations of GRB 041219A into account, we derive the number density of the surrounding electron cloud required for Comptonization. The redshift of GRB 041219A is predicted to be as well.
1 Introduction
GRB 041219A was detected by both the IBIS detector on the International Gamma-Ray Astrophysics Laboratory satellite (Gotz et al., 2004) and the Swift Burst Alert Telescope (BAT) (Barthelmy et al., 2004). It was an unusually bright and long burst. The fluence of measured by BAT in the 15-350 keV band would put it among the top few per cent of the 1637 -ray burst (GRB) events listed in the comprehensive fourth BATSE (Burst and Transient Source Experiment) catalog (Paciesas et al., 1999). The duration of the prompt -ray emission was approximately , making it one of the longest bursts ever detected (Vestrand et al., 2005).
So far, prompt optical and infrared emission that occurs when the main burst is still in progress has been detected from a few GRBs. These include GRB 990123 (Akerlof et al., 1999), GRB 041219A (Vestrand et al., 2005; Blake et al., 2005), GRB 050401 (Rykoff et al., 2005), GRB 060111B (Klotz et al. 2006), and GRB 050904 (Boer et al., 2006; Wei et al., 2006). The data obtained by RAPTOR (Rapid Telescopes for Optical Response) shows that the prompt optical light curve of GRB 041219A could be well fitted with a constant prompt optical-to--ray flux ratio (Vestrand et al., 2005). This strongly suggests that a direct correlation of both the time-varying spectral shape and the flux magnitude exists between the prompt optical emission and the -ray emission.
Prompt long-wavelength radiation accompanying prompt -ray emission has been widely discussed by many authors in the pre-afterglow era (Katz, 1994; Schaefer et al., 1994; Wei & Cheng, 1997; Tavani, 1996; Zhang, 2005) and in the afterglow era (Sari & Piran, 1999; Mészáros & Rees, 1999; Wu et al., 2006; van Paradijs et al., 2000; Fan & Wei, 2004a, b; Beloborodov, 2005). Recently, simultaneous variation of the optical-infrared emission with the prompt -rays from GRB 041219A has been discussed by Fan et al. (2005) using a neutron-rich internal shock model. Alternatively, here we argue that Compton attenuation of the -ray photons with a power-law spectrum by intervening electron clouds could give birth to the prompt optical emission. The -ray photons are assumed to be produced by the central engine (e.g., standard fireball model), while an electron cloud with the extremely high number density required could likely be ejected by the progenitor of the GRB, for example, as ejecta from the associated supernova in an earlier phase of the explosion (MacFadyen & Woosley, 1999). When the incident -ray photons travel through the electron cloud, some of them will be reprocessed into optical photons through the Compton attenuation mechanism. The model is addressed in detail in § 2, and we give the discussion and conclusions in § 3.
2 Model description for the prompt optical emission of GRB 041219A
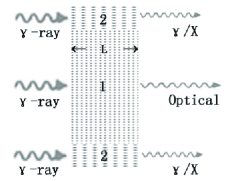
The distribution of the electron cloud is presumed to be inhomogeneous. This situation is possible if the electron cloud was created by a supernova that is associated with the GRB (further details are given below). When -ray photons escape from the central engine (e.g., a fireball) and encounter the surrounding electron cloud, energy can be exchanged between photons and electrons by Compton scattering. This process is often referred to as . It is of vital importance to know the environment of the Comptonization. If the scattering happens in a low electron density region, the resulting emission will be a GRB. Otherwise, saturated Comptonization must occur, and most of the energy of the incident -ray photons will be transferred into the electrons through repeated Compton scatterings. This makes it possible for the -ray photons to eventually be attenuated to the prompt optical-infrared emission (see Fig. 1).
To demonstrate how energy can be interchanged between photons and electrons by Compton scattering in detail is very complicated except in some simplified limiting cases. We thus introduce the Monte Carlo method to treat this problem. The simple picture can be described as follows: We initiate the Comptonization process with a photon of energy , located at the coordinate origin. When the photon travels away from its initial location by a length equal to the free path , one scattering will occur, and the scattering angle is . Assuming the coordinate system is built along our sight line, then the initial state of the incident photon is labeled as . We assume that the first scattering, with angle , change the initial energy to over a length . After the first scattering, the state of the photon can be labeled as . We label the next scattering state as , and so on. We continue the Comptonization process until the incident photon escapes from the cloud, and the final scattering state is . Thus the whole history of the incident photon before it escaped from the electron cloud can be described by
Assuming that the scattering region has an electron density of and a size of , the free path of a photon with energy is
| (1) |
where is a random variable that is uniformly distributed in (0,1), is the cross-section determined by integrating the differential cross-section over scattering angles . We use the Klein-Nishina formula to calculate :
| (2) |
(Rybicki & Lightman, 1979), where is the classical electron radius and and are the energy of any incident photon and the next scattering photon, respectively. The relative energy change of the photon satisfies
| (3) |
where is the mass of the electron. Consequently, the total optical distance traveled by one single photon for the repeated scatterings is the sum of the free paths, that is,
| (4) |
Because , the photon does not travel through the electron cloud along a straight line. But, the sum of the projection of each scattering length onto the sight line equals the size of the scattering region, that is,
| (5) |
where is the separation angle between the scattering direction and the sight line. It is determined by
| (6) |
where is a random variable that is uniformly distributed in ().
To carry out the simulations, we need to fix the election cloud’s length and the electron number density . Two scenarios for the scattering region of the electron clouds are considered: One is that the total scattering area of the electron cloud is assumed to be covered by a high and a low electron density region, referred to as the HL case. The geometry of the electron clouds for this picture is plotted in Figure 1. Another is that the scattering electron cloud could have only a high density filled in with some vacuum gaps, referred to as the HG case.
We first estimate the values of and in the HL case. We simulate -ray photons with incident energy of keV passing through the high electron density region, and require that the final radiation due to Comptonization is in the prompt optical band with energy of . Combining equations (1)-(6), we obtain the statistical quantities and from the simulations:
where is the total optical distance of a photon that passes through the relevant high-density region of the electron cloud. Correspondingly, we use to denote the total optical distance of a photon that passes through the low-density region, and the relation can be satisfied by taking into account that the value of in the high-density region is far more than that of the low-density region.
It is encouraging that the emergence of a weaker component after the end of the prompt -ray emission, detected in the PAIRITEL near-infrared observation of GRB 041219A, is interpreted as delayed reverse shock emission (Blake et al., 2005). As a result of the mechanism, the optical emission delays that of the -rays. This is favored by the work of Tang & Zhang (2006), who independently arrived at the conclusion that the prompt optical emission from GRB 041219A is consistent with the a delay of several seconds with respect to the -ray emission in their rest frames, if the redshift of GRB 041219A is taken to be 0.1 (Barkov & Bisnovatyi-Kogan, 2005). We restrict the prompt optical emission of GRB 041219A to lag by less than s with respect to the -ray emission, within which it is roughly regarded as varying with the prompt -ray emission. If the evolution of the spectrum of GRB 041219A is primarily determined by Compton scatterings, then we have where is the velocity of light.
With , we can immediately derive the number density of electrons required for the incident -ray photons to be degraded to optical photons through , The corresponding size of the scattering region is also estimated as .
The real situation is that the observed prompt optical emission from GRB 041219A would likely only be composed of a saturated Comptonization component from the total incident -ray photons. Note that the spectrum of GRBs is nonthermal, and there is a long high-energy tail extending up to GeV levels, with the energy flux peaking at a few hundred keV in many bursts (Piran, 2005). For simplicity, we assume that the incident energy distribution of -ray photons follows a power law with index and use -ray photons with energy varying from to to test our model. Fixing the size of the scattering region at , we find that if the number density of the electron cloud is , these incident -ray photons mostly become UV, optical, and infrared photons after the Comptonization process. On the contrary, if they pass through an electron cloud with , the emergent photons are mostly in the -ray band with energies of , and the distribution of these emitted -rays obeys the same power law as the initial incident photons. For these two conditions, we have simulated the process by setting the total number of incident photons at . The total energy carried by these photons is assumed to be . After Comptonization, the emerging photons traveling along the line of sight are markedly different in the former case and in the latter case, respectively. In the former case, there are photons are about 697 escaped photons, of which 34 are emitted in the IR/optical band (1.7-2.2 eV), with an energy of . In the latter case, about 16,744 escape, of which 536 are in the -ray band (15-350 keV), with a total energy of . The simulation for the numbers of radiated photons per energy interval is plotted in Figure 2.
To fit the energy flux ratio between the optical emission and the prompt -ray emission, we introduce a covering factor , which is defined as where is the area of the high-density clouds covered and stands for the total area of the electron clouds. This could be the sum of the high- and low-density regions, respectively (see Fig. 1).
Given the covering factor , from the simulations one can immediately derive the flux ratio of the optical to -rays, . Note that the observation of GRB 041219A (Vestrand et al., 2005) shows that the flux ratio between the prompt optical emission (1.7-2.2 eV) and the prompt -ray emission (15-350 keV) is . By fitting the observation with , we derive . The simulation also demonstrates the fact that the total emergent -ray (15-350 keV) photon energy is about of the total incident photon energy (see Fig. 2).
By considering the average effect of vacuum gaps that fill in the high-density region and roughly replace the low-density region of the HL case, the calculations and simulation show that a covering factor of more than is required to fit the observational data in the HG case. Compared with the HL case, this covering factor is extremely high. We do not think that so few vacuum gaps would be feasible, since nearly all the area is taken up by the high-density region. Therefore, the results for the HG case are not included, and we do not concern ourselves with this scenario any further.
It is known that the fluence of GRB 041219A in the 15-350 keV energy band measured by BAT (Barthelmy et al., 2004) is . With the isotropic energy of GRB 041219A, one can estimate its red-shift from the formulae
| (7) |
where is the luminosity distance between the GRB and us (Carroll et al., 1992), is an integral variable for the redshift, and , , and are the cosmological parameters and Hubble constant, respectively. If the isotropic energy of GRB 041219A is less than that of GRB 990123, (Kulkarni et al., 1999), then by combining equation(7), , , , and , we obtain an upper limit for the redshift of , which is roughly consistent with the result of Barkov & Bisnovatyi-Kogan (2005).
3 Discussion and Conclusion
We propose that the prompt optical and infrared emission from GRB 041219A can be modeled by the saturated Comptonization of its -ray emission. The current evidence shows that the optical emission of GRB 041219A is rather distinct from that of other GRBs, suggesting a possible environmental influence (Vestrand et al., 2005). We argue that this special event could have been surrounded by a very high density electron cloud. If the sub- lag time prompt optical emission can be considered as varying simultaneously with the prompt -ray emission, by fitting the observations we find that the required electron number density to degrade the -rays into the optical band is , and this dense scattering region is expected to cover of the total area. Although the required value of the electron number density is much higher than that of ordinary interstellar matter, it is lower than the electron number density of the Sun’s outer convection layer (Bahcall & Ulrich, 1988). We argue that the electron cloud could be a result of, for example, either the ejecta of the outer layer of the GRB progenitor ejected in an earlier phase of the explosion (MacFadyen & Woosley, 1999) or the capture of a star by the GRB progenitor (Wang & Zhao, 2001). If the scattering electron cloud is produced by the former mechanism, its total mass can be estimated as , where is the proton mass and is the radius of the GRB progenitor star, with adopted here. Suppose that the ejected outer layer of the progenitor has a typical length of and density of ; when it expands into a size of , it could create an electron cloud as required by the model. As a result, we predict that an upper limit on the redshift of GRB 041219A of if the isotropic energy of this GRB is less than that of GRB 990123.
Further more, many photons radiated in the UV/soft X-ray band could be inferred. Nevertheless, the XRT and UVOT instruments on board Swift did not autonomously slew to the burst, since automated slewing is not yet enabled (Fenimore et al., 2004); it is interesting to note that the Rossi X-Ray Timing Explorer All Sky Monitor obtained some soft X-ray data for the initial 120 s of GRB 041219A (McBreen et al., 2006). The results presented here highlight the need for continued broadband observations of -ray burst and the afterglow.
Acknowledgement: We thank the anonymous referee for valuable comments and suggestions that lead to an overall improvement of this study. We are thankful to Y.-F. Huang, S.-N. Zhang and K.-S. Cheng for both helpful comments and useful discussions. Thanks also to H.-X. Yin and W. Qiao for useful discussions. This research was supported by the National Natural Science Foundation of China (grants 10573021, 10273011, and 10433010), and by the Special Funds for Major State Basic Research Projects.
References
- Akerlof et al. (1999) Akerlof, C., et al., 1999, Nature, 398, 400
- Barkov & Bisnovatyi-Kogan (2005) Barkov, M. V., & Bisnovatyi-Kogan, G. S. 2005, Astrophysics, 48, 369
- Bahcall & Ulrich (1988) Bahcall, J.N., Ulrich, R.K., 1988, Rev. Modern Phys., 60, 297
- Barthelmy et al. (2004) Barthelmy, S., et al., 2004, GCN Circ. 2874,
- Beloborodov (2005) Beloborodov, A.M., 2005, ApJ, 618, L13
- Boer et al. (2006) Boër, M., Atteia, J. L., Damerdji, Y., Gendre, B., Klotz, A., & Stratta, G., 2006, ApJ, 638, L71
- Blake et al. (2005) Blake, C.H., et al. 2005, Nature, 435, 181
- Carroll et al. (1992) Carroll, S. M., Press, W. H., & Turner, E. L., 1992, ARA&A, 30, 499-542
- Fan & Wei (2004a) Fan, Y.Z., & Wei, D.M., 2004, MNRAS, 351, 292
- Fan & Wei (2004b) Fan, Y.Z., & Wei, D.M., 2004, ApJ, 615, L69
- Fan et al. (2005) Fan, Y.Z., Zhang, B. & Wei, D.M., 2005, ApJ, 628, L25
- Fenimore et al. (2004) Fenimore, E., et al, 2004, GCN Circ. 2906,
- Gotz et al. (2004) Gotz,D., Mereghetti,S., Shaw, S., Beck, M., & Borkowski, J. 2004, GCN Circ.2866,
- Katz (1994) Katz, J.I., 1994, ApJ, 432, L107
- Klotz et al. (2006) Klotz, A., et al., 2006, astro-ph/0604061
- Kulkarni et al. (1999) Kulkarni, S.R., et al., 1999, Nature, 398, 389
- MacFadyen & Woosley (1999) MacFadyen,A.I. & Woosley,S.E., 1999, ApJ, 524, 262
- McBreen et al. (2006) McBreen, S., et al., 2006, astro-ph/0604455, accepted for publication in A&A
- Mészáros & Rees (1999) Mészáros, P., & Rees, M.J., 1999, MNRAS, 306, L39
- Paciesas et al. (1999) Paciesas, W., et al., 1999, ApJS, 122, 465
- Piran (2005) Piran, T., 2005, Rev. of Mod. Phys., 76, 1143
- Rybicki & Lightman (1979) Rybicki, G. B. & Lightman A.P., 1979, ”Radiative Progresses In Astrophysics”, John Wiley & Sons Inc
- Rykoff et al. (2005) Rykoff, E.S., et al., 2005, ApJ, 631, L121
- Schaefer et al. (1994) Schaefer, B.E., 1994, ApJ, 422, 71
- Sari & Piran (1999) Sari, R., & Piran, T., 1999, ApJ, 517, L109
- Tang & Zhang (2006) Tang, S.M., & Zhang, S.N., 2006, submitted to A&A
- Tavani (1996) Tavani, M., 1996, ApJ, 466, 768
- Vestrand et al. (2005) Vestrand, W.T., et al. 2005, Nature, 435, 178
- van Paradijs et al. (2000) van Paradijs, J., Kouveliotou, C., Wijers R. A. M. J., 2000, ARA&A, 38, 379
- Wang & Zhao (2001) Wei W. & Zhao, Y.H., 2001, ChJAA, 6, 487
- Wei et al. (2006) Wei, D. M., Yan, T., & Fan, Y. Z., 2006, ApJ, 636, L69
- Wei & Cheng (1997) Wei, D.M., & Cheng, K.S., 1997, MNRAS, 290, 107
- Wu et al. (2006) Wu, X.F., Dai, Z.G., Wang, X.Y., Huang, Y.F., Feng, L.L., Lu, T., 2006, ApJ, submitted (astro-ph/0512555)
- Zhang (2005) Zhang, B., 2005, to appear in Proc. of ”Astrophysics Sources of High Energy Particles and Radiation”, eds. T. Bulik, G. Madejski and B. Rudak, Torun, Poland, 20-24,June (astro-ph/0509571)