The discovery of a significant sample of massive galaxies at redshifts 5z6 in the UKIDSS Ultra Deep Survey Early Data Release
Abstract
We have exploited the large area coverage of the combined UKIDSS Ultra Deep Survey (UDS) and Subaru/XMM-Newton Deep Survey (SXDS) to search for bright Lyman-break galaxies (LBGs) at . Using the available optical+near-infrared photometry to efficiently exclude low-redshift contaminants, we identify nine LBG candidates brighter than within the 0.6 square degree overlap region between the UDS early data release (EDR) and the optical coverage of the SXDS. Accounting for selection incompleteness, we estimate the corresponding surface density of LBGs with to be per square arcmin. Modelling of the optical+near-infrared photometry constrains the candidates’ redshifts to lie in the range , and provides estimates for their stellar masses. Although the stellar mass estimates are individually uncertain, a stacking analysis suggests that the typical stellar mass of the LBG candidates is which, if confirmed, places them amongst the most massive galaxies currently known at . It is found that CDM structure formation can produce sufficient numbers of dark matter halos at to accommodate our estimated number density of massive LBGs for plausible values of and the ratio of stellar to dark matter. Moreover, it is found that recent galaxy formation models can also account for the existence of such massive galaxies at . Finally, no evidence is found for the existence of LBGs with stellar masses in excess of at this epoch, despite the large co-moving volume surveyed.
keywords:
galaxies: high-redshift - galaxies: evolution - galaxies: formation1 INTRODUCTION
The increasing availability of survey fields with deep multi-wavelength data has led to so-called “dropout” techniques becoming established for photometrically identifying high-redshift galaxies. At redshifts of it is now standard practice to select galaxy candidates using the drop technique, a straightforward extension of the Lyman-break method pioneered at by Guhathakurta, Tyson & Majewski (1990) and Steidel & Hamilton (1992). Within this context, the unique combination of depth and image quality provided by the Hubble Space Telescope (HST) has arguably made the largest contribution to our understanding of high-redshift galaxies. Analysis of the Hubble deep fields, the GOODS fields, and in particular the Hubble ultra-deep field (HUDF), has led to the identification of hundreds of drop galaxy candidates at faint (111All magnitudes are quoted in the AB system (Oke & Gunn 1983)) magnitudes (e.g. Bouwens et al. 2006; Malhotra et al. 2005; Bunker et al. 2004; Dickinson et al. 2004). As a consequence, we now have a vastly improved understanding of the galaxies which undoubtedly dominate the star-formation density of the Universe during the epoch immediately following reionisation.
However, although HST has greatly advanced our knowledge of high-redshift galaxies, the various HST deep fields suffer from one fundamental weakness. Crucially, their small area (e.g. the HUDF covers 13 square arcmin) makes them subject to significant cosmic variance (Somerville et al. 2004) and completely unsuitable for investigating the most luminous, rarest objects. Indeed, of the many hundreds of drop galaxies identified in the deep HST fields, only one has (SBM03, spectroscopically confirmed at ; Bunker et al. 2003). This is an important shortcoming because accurately determining the number density of massive galaxies at high-redshift () has the potential to place important new constraints on galaxy formation models, only 1 Gyr after the Big Bang. From an observational perspective, it is clear that what is required is a combination of both depth and large area coverage.
In this respect, the study of LBGs in the Subaru Deep Field (SDF; Maihara et al. 2001) by Shimasaku et al. (2005) is perhaps the most notable. Based on deep Subaru optical imaging covering 767 square arcmin, Shimasaku et al. identified twelve bright LBGs with -band magnitudes in the range 25.426.6, photometrically selected to lie in the redshift range . Moreover, by using two medium-band filters ( and ) which divide the Subaru -prime filter in half, Shimasaku et al. gained crucial information on the UV slope of their high-redshift candidates. As a consequence, Shimasaku et al. were able to select a very clean sample, which should have negligible contamination from low-redshift interlopers. In addition, Ota et al. (2005) performed a search for LBGs over a sky area of square degree in the SXDS field, using a primary selection criterion of . However, Ota et al. were only able to strongly constrain the surface density of LBG candidates at , because at brighter magnitudes their lack of near-infrared data made it impossible to exclude significant contamination from low-redshift interlopers, and cool galactic stars in particular. Finally, it should be noted that there is already evidence for a large population of galaxies at fainter band magnitudes within the SXDS/UDS field. Using a combination of the broad band SXDS imaging and a narrow band filter (Å), Ouchi et al. (2005) identified 515 potential Ly emitters (LAEs) within the redshift interval , over an area of one square degree. Further deep optical spectroscopy subsequently confirmed eight LAEs at with asymmetric Ly emission lines. However, the LAEs detected by Ouchi et al. are fainter () than the objects identified in this study (and presumably have lower mass).
In this paper we exploit two crucial advantages of the combined SXDS/UDS data-set to explore a new area of LBG parameter space at . Firstly, the overlap region between the SXDS and the UDS EDR is times larger than the SDF ( square degrees), offering the prospect of identifying the rarest LBGs with . Secondly, the near-infrared data from the UDS EDR allows us to effectively clean the sample of low-redshift contaminants, and to obtain stellar mass estimates for the LBG candidates. The structure of the paper is as follows. In Section 2 we give a brief review of the optical and near-infrared data currently available in the SXDS/UDS field. In Section 3 we outline the criteria adopted for selecting the galaxy candidates, and discuss the possible sources of contamination. In Section 4 we present the results of our modelling of the candidates’ spectral energy distributions (SEDs). In Section 5 we estimate the number densities of massive LBGs at and compare with the predictions of current galaxy formation models. In Section 6 we compare our results with those in the recent literature, before presenting our conclusions in Section 7. Throughout the paper we adopt the following cosmology: km s-1Mpc-1, , . When referring to the and band filters, and specifically refer to the Subaru filters, whereas and are the equivalent HST filters.
2 The data
In this paper we identify potential massive galaxies at high redshift by combining optical data from the Subaru telescope with near-infrared data from the UK Infrared Telescope (UKIRT). The optical data were taken as part of the Subaru/XMM-Newton Deep Survey (Sekiguchi et al. 2005) while the near-infrared data has been taken from the early-data release (Dye et al. 2006) of the UKIRT Infrared Deep Sky Survey (Lawrence et al. 2006). The properties of both data-sets are briefly outlined below.
2.1 The Subaru/XMM-Newton Deep Survey
The Subaru/XMM-Newton Deep survey (SXDS) primarily consists of optical and X-ray imaging covering an area of square degrees, centred on RA=02:18:00, Dec=-05:00:00 (J2000). In addition, the SXDS field has IRAC and MIPS data from the Spitzer SWIRE survey (Lonsdale et al. 2003), deep 1.4 GHz radio observations from the VLA (Simpson et al. 2006a) and 850-micron sub-mm observations from SCUBA (Mortier et al. 2005). Of primary concern for this study is the deep optical imaging of the field undertaken with Suprime-Cam (Miyazaki et al. 2002) on Subaru. The optical imaging consists of 5 over-lapping Suprime-Cam pointings, and covers an area of square degrees. The whole field has been imaged in the filters, to typical depths of , , , and (2′′diameter apertures).
2.2 The UKIDSS Ultra Deep Survey
The Ultra Deep Survey (UDS) is one of five near-infrared surveys being undertaken with WFCAM (Casali et al. 2006, in preparation) on UKIRT, which together comprise the UKIRT Infrared Deep Sky Survey (UKIDSS). The UDS will take seven years to complete, and will provide ultra-deep imaging of a 0.8 square degree area (centred on the SXDS field), to point-source limits of , and . The UDS early-data release consists of the first twelve hours of imaging data and reaches limits of and within a 2′′diameter aperture. For this paper we have used an improved version of stacking and catalogue extraction constructed by the current authors, rather than the default version in the WFCAM Science Archive. This will be described in Foucaud et al (2006). The authors of this paper are also members of the UKIDSS consortium, so we intend that our improved stacking and source extraction will be made available to help to develop the final WSA database. Due to a small change in the UDS field centre shortly after the beginning of the survey, the current imaging is not uniform over the entire 0.8 square degree field. Consequently, for the purposes of this paper, we restrict our analysis to the square degree central region which has uniform data and optical Subaru coverage.
| Source | RA(J2000) | DEC(J2000) | |||||||
|---|---|---|---|---|---|---|---|---|---|
| MCD1 | 02:16:27.81 | 04:55:34.1 | |||||||
| MCD2 | 02:16:57.29 | 04:52:00.8 | |||||||
| MCD3 | 02:17:02.70 | 04:56:59.3 | |||||||
| MCD4 | 02:17:02.90 | 05:23:17.3 | |||||||
| MCD5 | 02:18:26.56 | 05:01:51.0 | |||||||
| MCD6 | 02:18:47.30 | 05:21:04.9 | |||||||
| MCD7 | 02:18:53.20 | 04:40:40.5 | |||||||
| MCD8 | 02:19:00.46 | 04:44:58.7 | |||||||
| MCD9 | 02:19:04.30 | 04:47:55.2 |
3 High-redshift candidate selection
Our sample of bright LBGs at was initially selected from the Subaru optical imaging, followed by SED fitting of the Subaru+UDS data to isolate robust candidates. The optical selection criteria were as follows:
-
•
-
•
non-detection () in the and bands
-
•
The magnitude cut at was chosen to fully exploit the area of the UDS, and to isolate the most luminous/massive galaxies which cannot be studied using smaller-area surveys. Furthermore, from a practical point of view, for objects with the shape of the SED long-ward of the band cannot be properly constrained (with the early-release UDS data), making it impossible to identify robust candidates (see Section 3.2). The requirements for non-detections in the and bands, together with a red colour, are designed to ensure our selection function has a sharp low-redshift cut-off at . At both the and bands sample rest-frame wavelengths short-ward of Ly, and any genuine high-redshift LBGs should not be detected at significance in these bands. Moreover, in the redshift interval the Subaru and filters bracket the onset of absorption by the Ly forest, and simulations demonstrate that a colour-cut of effectively excludes galaxies at . Finally, it should be noted that during the optical selection process we did not actually impose the standard drop criterion. The reason for this is that the standard colour cut (i.e. ; Bunker et al. 2004) can exclude galaxies in the redshift range . In contrast, for the purposes of this study, we are interested in including all possible candidates at , which is better achieved using the colour-cut. However, as can be seen from Table 1, all of the final nine LBG candidates satisfy , fully consistent with the expected colours of LBGs in the Subaru filter set.
3.1 Optical+near-infrared model fitting
Following the application of the initial optical selection criteria, the next step in the selection process was to analyse each potential candidate with our template-fitting photometric redshift code (Cirasuolo et al. 2006, in preparation), which is largely based on the public package hyperz (Bolzonella, Miralles & Pelló 2000). The photometric redshift for each galaxy is computed by fitting the observed multi-wavelength () photometry with synthetic galaxy templates. We adopt the stellar population synthesis models of Bruzual & Charlot (2003) for the galaxy templates, assuming a Salpeter initial mass function (IMF) with a lower and upper mass cutoff of 0.1 and 100 respectively. Both instantaneous burst and exponentially declining star formation models – with e-folding times in the range – were included, all with fixed solar metallicity. The code accounts for dust reddening by following the Calzetti et al. (2000) obscuration law within the range , and accounts for Lyman series absorption due to the HI clouds in the inter galactic medium according to the Madau (1995) prescription. In addition to the best-fitting photometric redshift, the code also returns best-fit values for: SED type, age, mass and reddening.
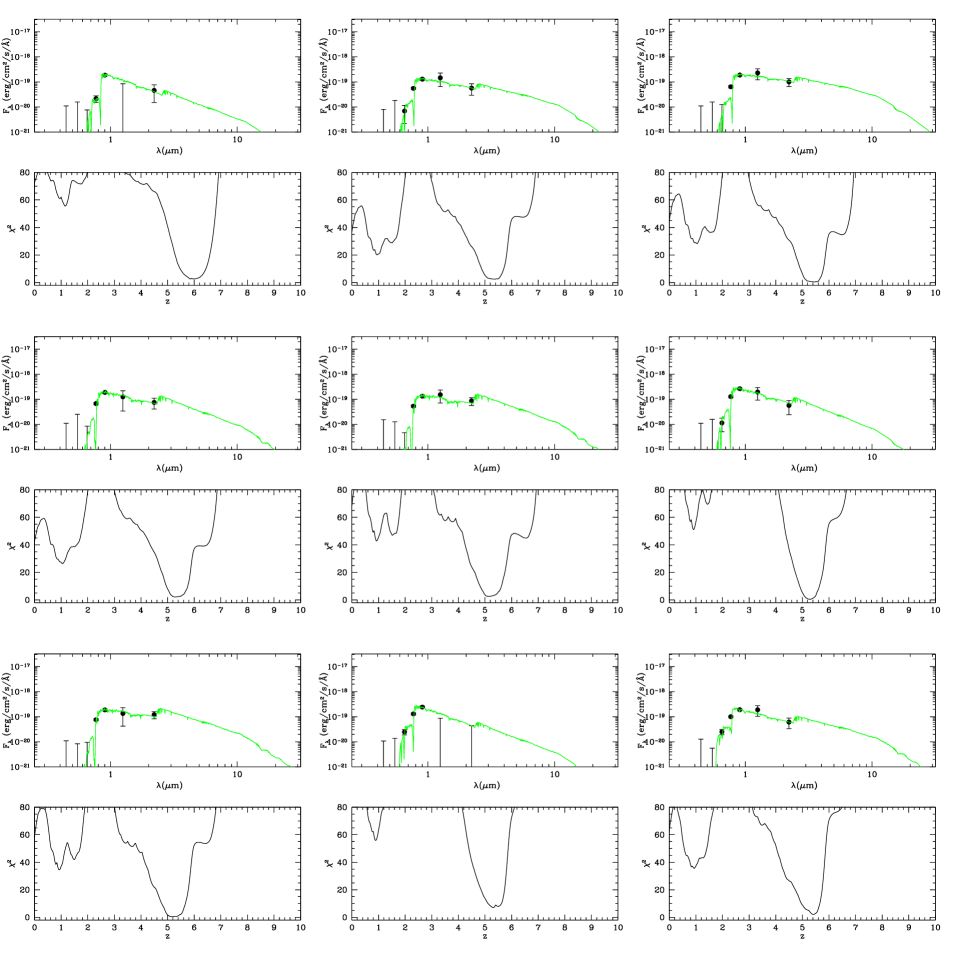
In addition to providing redshift and stellar mass estimates, the principle reason for performing the optical+near-infrared SED fits was to clean the sample of low-redshift interlopers. A simple application of the optical selection criteria described above produced an initial sample of 74 candidates. By making full use of the extra information provided by the near-infrared UDS data, 65 members of this initial sample were eventually excluded as low-redshift contaminants. The names, positions and photometry for the final nine LBG candidates are listed in Table 1, and the fits to their optical+near-infrared photometry are shown in Fig 1. In the next section we discuss in detail the potential sources of contamination, and the strategies adopted for excluding them from the final sample.
3.2 Sources of contamination
In the current study there are three types of contaminants which are of potential concern: ultra-cool galactic stars (M, L or T dwarfs), extremely red objects (EROs) at and high-redshift quasars. It is important to develop strategies for excluding these contaminants based on their optical+near-infrared SEDs because, unlike previous HST studies, ground-based resolution makes it impossible to exclude stellar and QSO contaminants on the basis of being spatially unresolved.
3.2.1 Ultra-cool galactic stars
Due to the ′′ FWHM resolution of the available ground-based imaging of the SXDS/UDS field, high-redshift LBGs are expected to be unresolved point sources. Consequently, the prospect of significant contamination of the final sample by ultra-cool galactic stars is potentially serious. Ultra-cool galactic stars (M, L or T dwarfs) perfectly mimic the redshifted SEDs of LBGs in the optical (Hewett et al. 2006), and would certainly pass our initial optical selection criteria. Consequently, in order to exclude stellar contaminants it is necessary to rely on the fact that ultra-cool galactic stars exhibit redder colours than genuine LBGs. To quantify this we used the library of spectra maintained by Sandy Leggett 222www.jach.hawaii.edu/skl to calculate the likely colours of M, L and T dwarfs in the Suprime-Cam+WFCAM filter set. This process revealed that we could efficiently exclude the cooler L and T dwarfs from the final sample by rejecting any potential candidate which was detected in the UDS EDR band imaging at significance. This is because the red colours typical of L and T dwarfs means that, at , they should be significant () detections in the EDR band imaging. However, unfortunately the potential for contamination by M dwarfs is much more significant. Due to the fact that none of the final nine LBG candidates are formally detected in the band (all detections), the limits on their colours are typically , compatible with those of M dwarfs with . To tackle this issue, as part of the SED fitting we used the available M dwarf spectra (spectral types M1 to M9) as templates to fit the LBG candidates’ photometry. For seven of the nine final candidates, using galaxy templates produced significantly better fits to the LBG photometry (Table 2) than could be achieved with the M dwarf templates. However, for two of the final candidates (MCD2 & MCD3) the M dwarf SED fits were of comparable quality to those achieved with galaxy templates. Consequently, it remains possible that these two objects are M dwarf contaminants. However, we have chosen to keep them in the final sample because LBG templates provide a very good fit to their photometry and, even including these two objects, a stacking analysis suggests the final candidate list of nine objects is not heavily contaminated by M dwarf stars.
3.2.2 Stacking analysis
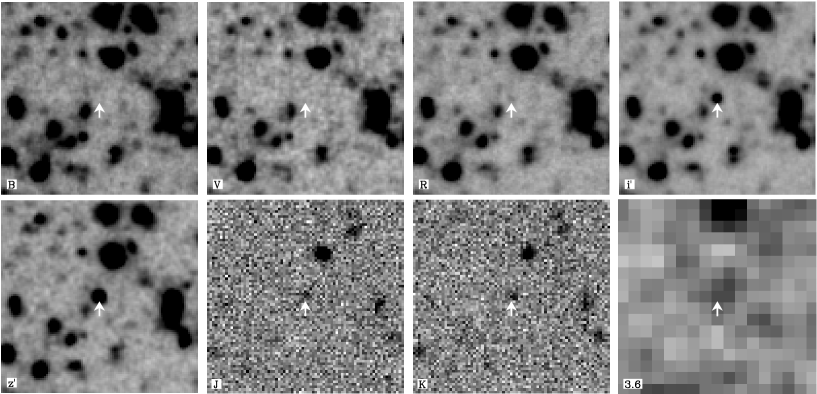
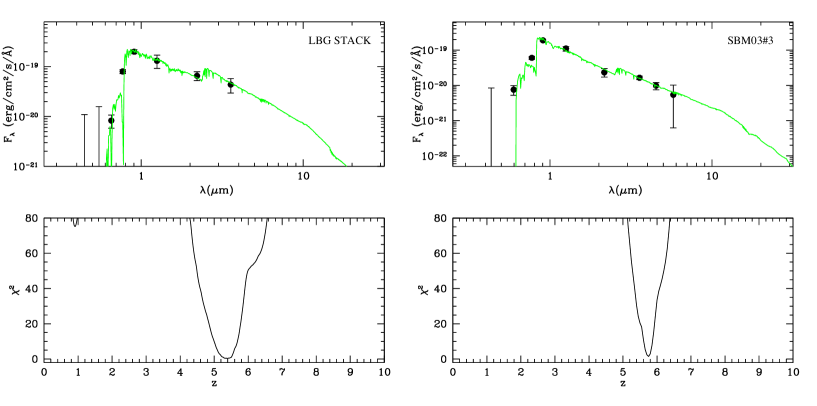
In order to confirm that the final sample of nine LBG candidates is not heavily contaminated by galactic M-dwarf stars, we stacked (averaged) the images of the final nine candidates in all available bands. Postage stamp images centred on the stack of all nine high-redshift LBG candidates in the and 3.6m Spitzer bands are shown in Fig 2, and the SED fit to the stacked photometry is shown in Fig 3.
Several points regarding the stacked image and accompanying SED fit are noteworthy. Firstly, due to the extra magnitude in depth achieved by stacking, it is possible to confirm that the average SED of the final candidates is robustly undetected in the bluest optical bands to limits of and . Secondly, the colours of the LBG stack are and . An M-dwarf star with is expected to have , significantly redder than the colour of the LBG stack. This alone is enough to strongly suggest that the final candidate list is not heavily contaminated by M-dwarfs, and is confirmed by the fact that the best-fit to the stacked photometry using an M-dwarf template can be confidently excluded (). Moreover, although each of the final nine candidates is individually undetected in the 3.6m SWIRE data, the stack does provide a marginal detection (), entirely consistent with a prediction based on the individual SED fits shown in Fig 1. Crucially, if the final candidate list consisted largely of ultra-cool galactic stars, there would be no detection at 3.6m.
There is one final comparison which can be performed using the stacked data to provide further information on the reliability of our selection technique. As previously mentioned, in the GOODS CDFS field there is one bright LBG known with (SBM03), spectroscopically confirmed to be at by Bunker et al. (2003). This object is the only high-redshift LBG within the deep HST survey fields which is comparable in brightness to the candidates selected here. In the right-hand panel of Fig 3 we show the photometry for this object, together with our SED fit. Reassuringly, our SED fit accurately recovers the spectroscopic redshift () using best-fitting model parameters very similar to those required to fit the photometry of our nine high-redshift LBG candidates. Moreover, it can clearly be seen from Fig 3 that the SEDs of SBM03 and our LBG stack are very similar, providing additional evidence that our final candidate list is robust.
3.2.3 Extremely red objects
Based solely on our optical selection criteria, contamination of the final sample by EROs at is possible if the 4000Å break is confused with the Lyman break. However, given the extra information from the UDS EDR near-infrared data, we can be confident that ERO contamination is not an issue. As can be seen from Fig 1, none of the final nine candidates displays a problematic degeneracy between plausible solutions at low and high redshift. Although an alternative photometric redshift solution at inevitably exists for each candidate, in every case the low-redshift solution can be excluded at % confidence (). This is confirmed by our SED fit to the stacked LBG photometry (Fig 3) which shows the ERO solution at to be completely unacceptable (). This clear separation between high and low-redshift solutions is particularly notable given that during the SED fitting process, extreme values of intrinsic reddening () were fully explored.
From a more empirical perspective, we have also investigated the potential for contamination using a sample of 3715 (Vega) EROs with a band limit of , selected from the same data-set as our LBG candidates (Simpson et al. 2006b). Within this sample there are 2140 EROs with photometric redshifts in the range and . As expected, none of these EROs display a statistically acceptable photometric redshift solution at . The fundamental reason for this is that none of them have the blue SED slope long-ward of the band displayed by our final LBG candidates. Perhaps the most convincing evidence for this comes from the SED of the stacked photometry of all nine LBG candidates (Figs 2 & 3), which has a colour of . For comparison, the average colour of EROs in the UDS field is (where the quoted uncertainty is the standard deviation).
3.2.4 High-redshift quasars
High-redshift quasars in the redshift range have predicted and colours which are comparable with those of our final nine LBG candidates (Willott et al. 2005). However, none of the final candidates are detected in the deep keV band X-ray imaging of the SXDS with XMM-Newton. The sensitivity of the XMM-Newton SXDS observations varies somewhat over the SXDS field, but the typical X-ray flux upper limits imply X-ray luminosity limits of erg s-1 (rest-frame energy band keV). Moreover, based on the latest constraints on the QSO luminosity function at (Willott et al. 2005), contamination of our sample from high-redshift QSOs is expected to be minimal (conservatively QSO is anticipated with over the SXDS/UDS field).
3.2.5 Lensing
Finally, given that we have deliberately selected the brightest objects of their type at , it is important to at least consider the possibility that some of the final LBG candidates may be lensed. The first scenario to consider is the prospect of moderate amplification due to a lensing geometry where the LBG candidates lie outside the Einstein radii of lensing objects along the line-of-sight. If we model the potential lens as a single isothermal sphere, then the amplification is : , where is the Einstein radius , is the velocity dispersion of the lensing galaxy, is the angular diameter distance of the source and is the angular diameter distance of the source from the lens. Four of the final nine LBG candidates have nearby companions within ′′of the line-of-sight, which could potentially produce amplification via lensing. To investigate this we have estimated the velocity dispersions and consequent amplification for these objects, using their photometric redshifts and the correlation at from Bernardi et al. (2003). This calculation reveals that none of the companion objects are compatible with having km s-1, and that any amplification from lensing is therefore small (i.e. ).
The second scenario to consider is the prospect of high amplification due to extremely close alignment along the line-of-sight between the LBG candidates and potential lensing objects in the foreground. Although difficult to rule-out completely, the remarkably clean nature of the LBG candidates’ optical photometry suggests that it is quite unlikely. For the LBG candidates the largest cross-section for lensing occurs at . Consequently, if we consider an elliptical at as the potential lens, we can predict that it would have apparent magnitudes of , and (assuming ; Pozzetti et al. 2003). These magnitudes are completely incompatible with those of the stack of the final nine LBG candidates, which is undetected to limits of and , and has a band magnitude of . Consequently, the average luminosity of any potential lensing objects would have to be to avoid detection in the stacked photometry, which leads us to conclude that the probability of lensing is negligible.
3.2.6 Colour-colour selection
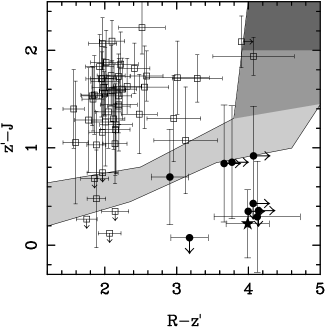
Finally, for completeness, in Fig 4 we show the location of the final nine high-redshift LBG candidates on the versus colour-colour plane. Also shown in Fig 4 is the locus of M, L and T dwarfs and those EROs from Simpson et al. (2006b) which satisfy our selection criteria of being undetected in the and bands, and have band magnitudes in the same range as the LBG candidates (). Although Fig 4 suggests that traditional colour-colour selection based on and would successful isolate our high-redshift LBG candidates from low-redshift EROs, it also illustrates the potential for contamination by M dwarf stars (as discussed in Section 3.2.1). However, once again, the location of the stacked LBG photometry on the versus plane strongly suggests that the final LBG candidate list is not significantly contaminated by low-redshift interlopers. For the purposes of obtaining a robust sample of high-redshift LBG candidates, Fig 4 further emphasises the importance of modelling the full SEDs, using both galaxy and stellar templates, rather than relying on simple colour-colour selection.
| Source | SED | z | AV | Age/Myr | Log( | M | ||
|---|---|---|---|---|---|---|---|---|
| MCD1 | 1 | 2.6 | 5.85 | 5.766.20 | 0.0 | 57 | 10.3 | |
| MCD2 | 1⋆ | 2.5 | 5.38 | 5.08 5.56 | 0.8 | 57 | 10.8 | |
| MCD3 | 1⋆ | 0.4 | 5.47 | 5.16 5.62 | 1.0 | 57 | 11.2 | |
| MCD4 | 1 | 2.1 | 5.29 | 5.16 5.54 | 0.0 | 181 | 11.0 | |
| MCD5 | 1 | 2.5 | 5.13 | 5.00 5.38 | 0.0 | 255 | 11.1 | |
| MCD6 | 1 | 0.5 | 5.26 | 5.12 5.42 | 0.0 | 114 | 10.6 | |
| MCD7 | 1 | 0.4 | 5.18 | 5.02 5.44 | 0.4 | 181 | 11.3 | |
| MCD8 | 1 | 7.0 | 5.31 | 5.22 5.38 | 0.0 | 57 | 10.0 | |
| MCD9 | 2 | 2.1 | 5.41 | 5.30 5.54 | 0.6 | 509 | 11.2 |
4 modelling results
In Table 2 we list the best-fitting galaxy template parameters resulting from the optical+near-infrared SED fits to each of the final nine high-redshift LBG candidates (as illustrated in Fig 1). All of the candidates have best-fitting photometric redshifts in the range , validating our original selection criteria. Moreover, as previously discussed, none of the candidates displays a plausible low-redshift solution, despite the fact that an extreme range of intrinsic reddening () was explored during the SED fitting process. This is potentially crucial because, as highlighted by Dunlop, Cirasuolo & McLure (2006), it is possible to confuse extremely dusty () low-redshift objects with genuine high-redshift galaxies if the range of reddening explored is constrained to moderate values (e.g. ).
4.1 Ages and reddening
Although the age of the Universe at ( Gyrs) was not used as a prior in the model fitting, reassuringly the best-fitting ages for all the final nine candidates naturally satisfy this constraint, and are consistent with formation redshifts in the range . As is expected given the LBG selection criteria, there is no evidence in our sample for substantial amounts of reddening. Indeed, the range of reddening displayed by our sample () is perfectly consistent with that found for LBGs at by Shapley et al. (2001).
4.2 Stellar masses
By concentrating exclusively on the brightest () candidates, this study was designed to investigate the most massive LBGs at . The success of this policy can be seen from Table 2, which shows that six of the nine final candidates have estimated stellar masses , and five have estimated masses . If these stellar mass estimates are accurate, then the LBG candidates are among the most massive galaxies yet discovered at these redshifts (see discussion in Section 5), and are comparable to the highest stellar masses found for LBGs at by Shapley et al. (2001), who also adopted a Salpeter IMF. In fact, these stellar mass estimates suggest that several of the LBG candidates have already built-up a stellar mass comparable with M today (; Cole et al. 2001).
However, given the current depth of the near-infrared data from the UDS EDR, and the fact that the SWIRE data covering the UDS field is not deep enough to individually detect the LBG candidates, it is clear that on an object-by-object basis the stellar mass estimates must be regarded with some caution. The first issue to consider is the range of stellar masses which are allowable within the SED templates we have adopted to fit the optical+near-infrared photometry. By identifying the SED templates with the lowest and highest masses which still provide a statistically acceptable fit to the observed photometry (conservatively , marginalised over all other free parameters), we have calculated the allowable stellar mass range for each of the LBG candidates (Table 2). This calculation reveals that the photometry of most of the LBG candidates can be acceptably reproduced (although with a worse ) by SED templates with a factor of less stellar mass.
In addition, there is also the added uncertainty introduced by the choice of a specific IMF. For the SED fits presented in this paper we have made the standard choice of adopting a Salpeter IMF, for ease of comparison with previous results in the literature. However, it is widely recognised that the Salpeter IMF results in higher stellar mass estimates than other popular choices. For example, re-fitting the LBG optical+near-infrared photometry with a Kennicutt or Chabrier IMF would produce stellar mass estimates a factor of lower. In conclusion, it is clear that the individual stellar mass estimates for the LBG candidates are very likely uncertain to within a factor of .
In order to obtain a more robust estimate of the typical mass of the LBGs, we have also calculated stellar mass estimates based on the stacked LBG photometry. The obvious advantage of this is that the extra depth provided by stacking produces much more robust photometry in the and bands, and also provides a detection at 3.6m from the stacked SWIRE data. Using a straightforward average stack of the LBG data (see Figs 2 & 3) our SED fit returns a stellar mass estimate of . However, this stack is biased due to the inclusion of the two LBG candidates with the lowest stellar mass estimates (MCD1 & MCD8), which have the faintest photometry. This is confirmed by an SED fit to a median stack of the LBG photometry, which returns a stellar mass estimate of (as anticipated from the results in Table 2). In conclusion, taking into account systematic differences due to the choice of IMF, the evidence from stacking the LBG data suggests a typical stellar mass of .
5 massive galaxies at high redshift
The results presented in the previous section suggest that, despite the considerable uncertainties, the typical stellar mass of the LBG candidates is . In this section we investigate whether the existence of such massive galaxies at this early epoch is consistent with CDM structure formation and current galaxy formation models. Within this section we adopt the best-fitting stellar mass estimates for each LBG candidate, based on a Salpeter IMF. However, when necessary, we adjust our estimated number densities to account for differences due to specific choices of IMF.
5.1 Surface density
The first, model independent, quantity of interest to calculate is the surface density of galaxies at . However, in order to accurately compute the surface density, it is first necessary to account for the inevitable incompleteness introduced during the construction of the original SExtractor (Bertin & Arnouts 1996) catalogues due to object blending. To quantify this effect we performed simulations based on introducing 1000 fake LBG candidates at a time into the band images, and attempting to recover them using the same SExtractor configuration adopted for constructing the original band catalogues. This immediately revealed that on average we lose of possible LBG candidates due to object blending on the band images. In addition, we then proceeded to run SExtractor in two-image mode on the corresponding and band data, using the band as the detection image. This revealed that we lose further LBG candidates due to contamination of the matched apertures in the and bands by nearby companions. In around of cases this contamination is sufficient to fail our selection criteria requiring detections in both the and bands.
Consequently, when calculating the surface density of LBGs it is necessary to scale-up by a factor of . Allowing for this correction factor, our estimate for the surface density of LBGs at is per square arcmin. We note that this figure is compatible with, although obviously much more robust than, a prediction based on the one previously known LBG with in a compilation of deep HST survey fields; per square arcmin (Bouwens et al. 2006). We also note that our final list of nine LBGs at is fully consistent with the previous findings of Shimasaku et al. (2005) in the SDF. Within the 767 square arcmin area of the SDF, Shimasaku et al. did not find any possible LBGs, but did identify 12 candidates in the magnitude range . However, it is important to remember that the selection technique adopted by Shimasaku et al. was tuned to identify LBGs in the redshift interval . Only one of our final list of nine candidates lies within this redshift range (MCD1). Consequently, based on our final sample, we would predict only LBG candidates with within the SDF area which would satisfy the Shimasaku et al. selection criteria, entirely consistent with their finding of none.
5.2 Number densities
The best-fitting stellar mass estimates listed in Table 2 suggest that five of the LBG candidates have masses of M . In order to convert the estimated surface density of M LBGs at into a number density, it is necessary to compute the effective co-moving volume of our survey (defined by the survey area and the redshift intervals within which each of the LBG candidates could have been detected; ). Due to our adopted optical selection criteria, our selection function has a sharp low-redshift cut-off at . To compute we have taken the SED fit to each candidate and redshifted it (keeping age, reddening and mass constant) until the candidate fades below our magnitude limit (). This calculation reveals that, for the five LBG candidates with M , the effective volume of the survey is equivalent to the full co-moving volume covered by our 0.6 square degree area over the redshift interval (i.e. Mpc3).

5.2.1 Completeness
Additionally, in order to calculate a meaningful estimate of the number density of M LBGs in our sample, it is also necessary to estimate our completeness as a function of stellar mass. To investigate this we produced simulated photometry for 10,000 LBGs with parameters randomly selected from uniform distributions with the following ranges:
-
•
Stellar masses: M
-
•
Ages: 50 Myr age 500 Myr
-
•
Extinction:
where the adopted parameter ranges are based on the results of the SED fits presented in Table 2, and are also consistent (in terms of ages) with recent results suggesting that reionisation occurred in the redshift interval (Fan et al. 2006; Page et al. 2006). The simulated LBG catalogue was then subjected to the same optical and near-infrared selection criteria adopted for the real data-set (see Section 3). In Fig 5 we show the resulting estimate for sample completeness as a function of stellar mass. It can be seen from this figure that for LBGs with stellar masses of we are only complete. Consequently, to calculate our final estimate of the number density of M LBGs within our sample we are required to correct the observed numbers by a factor of . Taking this correction into account, our final estimate for the number density of M LBGs at is , where the quoted error includes a 20% contribution from cosmic variance (Somerville et al. 2004), but does not include possible systematics in the adopted completeness correction. If, in reality, LBG candidate MCD3 is an M dwarf contaminant, then the estimate number density would be % lower.

5.3 Comparison with dark matter halo number densities
The most fundamental test which we can perform is to ask whether CDM produces the required number of dark matter halos to host galaxies with stellar masses of at this early epoch. In order to explore this issue we have calculated the number density of dark matter halos as a function of redshift predicted by the Press-Schechter formalism (Bond et al. 1991) 333using code kindly provided by Will Percival. In Fig 6 we show the redshift evolution of the dark matter halo number density for halos more massive than , which corresponds to a stellar to dark matter ratio of 15. Although the typical stellar to dark matter ratio of massive galaxies as a function of redshift is not accurately known, our choice of 15 as a representative figure is motivated by several lines of reasoning. Firstly, assuming a halo occupation number of unity, the predicted number density of M dark matter halos at is in good agreement with the locally observed number density of galaxies with stellar masses (Salpeter IMF; Cole et al. 2001). Moreover, a ratio between halo mass and stellar mass of at low-redshift is in good agreement with recent galaxy-galaxy lensing results (Mandelbaum et al. 2006). Finally, at high redshift, a stellar to dark matter ratio of is also in agreement with the predictions of recent galaxy formation models (R. Bower, private communication). At high redshift the number density of dark matter halos is strongly dependent on the value of the parameter. Consequently, in Fig 6 we show the dark matter halo number density evolution for four different values of (0.90, 0.85, 0.80 & 0.75). The final value of is in agreement with the WMAP three year results (Spergel et al. 2006).
In Fig 6 we also plot our estimated number density of LBGs with stellar masses from this study (median ). It can be seen from Fig 6 that, assuming a stellar to dark matter ratio of 15, CDM does produce sufficient halos at high redshift to host our LBG candidates provided . In fact, given the large uncertainties associated with our estimated number density, our results are also fully consistent with the latest determination of . Consequently, we can conclude that our estimated number density of massive galaxies at can certainly be accommodated within current CDM models of structure formation.
Furthermore, it has recently been suggested that of the stellar mass at is missed by traditional drop-out selection techniques (Stark et al. 2006), which exclude high-redshift galaxies which are too red in the rest-frame optical to satisfy LBG selection criteria (see discussion in Section 6). However, even if we increase our estimated number density of massive galaxies at by a factor of two, and assume , CDM can still produce the required number of dark matter halos if the stellar to dark matter ratio is .
In Fig 6 we also show the estimated number densities of galaxies at derived from a band selected sample of galaxies in the GOODS CDFS (Caputi et al. 2006). The Caputi et al. sample has a magnitude limit of , and is % complete for stellar masses (Salpeter IMF) at redshifts . As can be seen from Fig 6, the conclusions of Caputi et al. were that % of the local mass density comprised by galaxies with stellar masses was already in place by , and that the majority was in place by . Similar conclusions have been reached by numerous studies of deep, small area, near-infrared surveys (e.g. Drory et al. 2005; Fontana 2004). The results presented here strongly suggest that the increase in number density of massive galaxies within the redshift interval closely traces the build-up of suitable dark matter halos and that, as a consequence, only of the local density of galaxies was in place by .

5.4 Comparison with galaxy formation models
It has recently become apparent that the number density of massive, red galaxies observed at high redshift is much larger than would have been predicted by semi-analytic galaxy formation models five years ago (e.g. Cimatti et al. 2002; Glazebrook et al. 2004). In essence this is simply a result of the fact that galaxy formation models based on hierarchical assembly naturally produce the most massive galaxies at late times. This apparent discrepancy between the models and observations has been described variously as “anti-hierarchical” behaviour, or cosmic downsizing. It is clear therefore that important constraints can be placed on the latest generation of galaxy formation models via comparison with the observed number density of massive galaxies already in place at .
In Fig 7 we show the predicted number density of galaxies as a function of stellar mass at (median redshift of our LBG candidates) from the latest generation of Durham semi-analytic galaxy formation models, which incorporate AGN feedback (Bower et al. 2006). Also shown in Fig 7 are the predictions (G.L. Granato, private communication) from the latest version of the Granato et al. (2004) galaxy formation model, which is based on an anti-hierarchical baryon collapse scenario. The filled circle is our estimate for the number density of galaxies within a bin centred on , based on the results of this study. When plotting the data-point in Fig 7, we have shifted the centre of the bin to lower mass by 0.15 dex, to account for the difference between the Salpeter IMF adopted in this paper, and the IMFs adopted in the Bower et al. and Granato et al. models (Kennicutt and Romano et al. 2002 respectively). As can be seen from Fig 7, our estimated number density is clearly in good agreement with the predictions of the Bower et al. and Granato et al. models. Interestingly, given that our number density is almost certainly a lower limit, both model predictions can accommodate a number density which is a factor of higher than our estimate, as required if LBGs constitute of the total stellar mass at (e.g. Stark et al. 2006). Finally, although not included in Fig 7, we also note that our estimated number density of LBGs at is fully consistent with the hydro-dynamical simulations of Night et al. (2006).
6 Comparison with recent results
In this study we have exploited the large co-moving volume covered by the SXDS/UDS data-set to identify a sample of bright () LBGs at . In this section we compare our results with those of three recent studies based on the extensive multi-wavelength data available in the GOODS CDFS (Grazian et al. 2006; Stark et al. 2006; Yan et al. 2006).
The GOODS-MUSIC sample (Grazian et al. 2006) consists of band and band selected samples in the southern GOODS field, and provides a photometric redshift for each object calculated from SED fits to the extensive, high-quality, HST+VLT+Spitzer imaging available in the field. The band catalogue is complete to and, although it only covers 142 square arcmin, it is obviously of some interest to compare the number of galaxies found in the MUSIC sample to the results presented here. Based on the results of this study, and correcting for the difference in area, the number of LBG-type galaxies within the GOODS-MUSIC catalogue should be consistent with . Interestingly, the GOODS-MUSIC catalogue contains seven objects with and a photometric redshift estimate of , seemingly very inconsistent with the results presented here. However, our own SED fits to the MUSIC photometry for these seven objects suggest that only two are believable high-redshift candidates.
Three of the seven objects (MUSIC IDs 1133, 8316 & 12966) have SEDs which are clearly stellar in nature, and have SExtractor stellarity parameters of 0.98, 0.99 and 0.99 respectively. In addition, MUSIC ID=7004 has a clear band detection which is inconsistent with the best-fitting photometric redshift of . Finally, MUSIC ID=10140 has a very unusual SED which would appear to be due to severe blending with bright nearby objects in the near-infrared and Spitzer bands. Of the original seven objects, this leaves two apparently robust candidates with (MUSIC IDs 499 & 3094). One of these (MUSIC ID=499) is the spectroscopically confirmed LBG SBM03#03 (Bunker et al. 2003) and the other (MUSIC ID=3094) has been spectroscopically confirmed at by the GOODS VLT spectroscopy campaign (Vanzella et al. 2006). Consequently, given that the GOODS MUSIC catalogue is complete to (i.e does not employ any colour selection), and the much larger cosmic variance in the smaller GOODS field (; Somerville et al. 2004), we conclude that the number of robust galaxies with in the MUSIC catalogue is in good agreement with the results presented here.
In their recent study, Stark et al. (2006) assemble a combined photometric and spectroscopic catalogue of objects in the GOODS-CDFS field to investigate the stellar mass density at . Within their sample Stark et al. have two objects with and , one with a spectroscopic redshift of (MUSIC ID=3094) and the other with a photometric redshift of (also from the MUSIC catalogue). Our SED fits to these two objects successfully reproduce the redshift of the spectroscopically confirmed candidate, but are unable to produce a statistically acceptable high-redshift fit to the candidate with . Consequently, if we also include SBM03#03 (; Bunker et al. 2003), we again conclude that the GOODS-CDFS field contains two objects with .
Interestingly, the object in the Stark et al. sample is not a classic drop () and would not have passed our strict selection criteria (estimated colour in the Subaru filters). This has two consequences. Firstly, it brings the observed number of LBGs in the GOODS-CDFS field with into good agreement with the results presented here, which correspond to objects per GOODS-CDFS area. Secondly, it provides further evidence for the conclusion of Stark et al. (2006) that traditional drop-out selection techniques are missing of the stellar mass at . Finally, Yan et al. (2006) have recently completed a study of the stellar mass density at based on drop selection of galaxies in the north and south GOODS fields (combined area square arcmin). Within their sample, Yan et al. find two objects at with . This is in good agreement with the results presented in this paper, which correspond to objects per GOODS field (N+S).
6.1 The absence of super-massive galaxies
As a final comment we note here that we have found no evidence in this study for the existence of LBGs with masses in excess of in the redshift interval . Although still uncertain, this non-detection is notable given that we should be complete to LBG-type objects of this mass (see Fig 5) over a volume of Mpc3. Consequently, the detection of even one object of this mass within the UDS/SXDS field would have pointed to a number density of . Our non-detection is in agreement with the recent search for galaxies within the GOODS-CDFS field by Dunlop, Cirasuolo & McLure (2006).
7 Conclusions
In this paper we have presented the results of a study aimed at exploiting the large co-moving volume of the SXDS/UDS data-set to identify the most massive LBGs at . Our main conclusions can be summarised as follows:
-
1.
We have identified a robust sample of nine bright () LBG candidates with photometric redshifts in the range .
-
2.
Our corresponding estimate of the surface density for LBGs at is per square arcmin. This surface density estimate is in good agreement with, although much more robust than, a prediction based on the one previously known LBG candidate with in a compilation of the deep HST fields; per square arcmin (Bouwens et al. 2006).
-
3.
SED fits to the stacked photometry of the final nine LBG candidates suggests that their typical stellar mass is (Salpeter IMF), comparable with the most massive galaxies currently known at .
-
4.
Based on our best-fitting stellar mass estimates, five of the nine LBG candidates have estimated stellar masses . Our corresponding estimate for the number density of LBGs with stellar masses is .
-
5.
This number density is found to be compatible with the density of suitable dark matter halos predicted by CDM structure formation models for plausible combinations of and the ratio of stellar to dark matter.
-
6.
It is found that recent galaxy formation models can account for the existence of such massive galaxies at high redshift, even if LBGs only account for of the total stellar mass at .
-
7.
Despite the large co-moving volume surveyed, no evidence is found for the existence of LBGs with masses in excess of at .
8 acknowledgements
The authors would like to acknowledge Richard Bower and Gian Luigi Granato for providing their stellar mass function predictions. The authors would also like to acknowledge Nigel Hambly and Niall Deacon for useful discussions on the nature of cool galactic stars and Will Percival for providing the code to calculate halo number densities. RJM, OA and IS would like to acknowledge the funding of the Royal Society. MC, SF and CS would like to acknowledge funding from PPARC. We are grateful to the staff at UKIRT and Subaru for making these observations possible. We also acknowledge the Cambridge Astronomical Survey Unit and the Wide Field Astronomy Unit in Edinburgh for processing the UKIDSS data.
References
- [1] Bernardi M., et al., 2003, AJ, 125, 1849
- [2] Bertin E., Arnouts S., 1996, A&AS, 117, 393
- [3] Bolzonella M., Miralles J.M., Pelló, 2000, A&A, 363, 476
- [4] Bond J.R., Cole S., Efstathiou G., Kaiser N., 1991, ApJ, 379, 440
- [5] Bouwens R.J., Illingworth G.D., Blakeslee J.P., Franx M., 2006, ApJ, in press, astro-ph/0509641
- [6] Bower R.G., Benson A.J., Malbon R., Helly J.C., Frenk C.S., Baugh C.M., Cole S., Lacey C.G., 2006, MNRAS, submitted, astro-ph/0511338
- [7] Bruzual G., Charlot S., 2003, MNRAS, 344, 1000
- [8] Bunker A.J., Stanway E.R., Ellis R.S., McMahon R.G., McCarthy P.J., 2003, MNRAS, 342, L47
- [9] Bunker A.J., Stanway E.R., Ellis R.S., McMahon R.G., 2004, MNRAS, 355, 374
- [10] Calzetti D., Armus L., Bohlin R. C., Kinney A. L., Koornneef J., Storchi-Bergmann T., 2000, ApJ, 533, 682
- [11] Caputi K.I., McLure R.J., Dunlop J.S., Cirasuolo M., Schael A.M., 2006, MNRAS, 366, 609
- [12] Cimatti A., et al., 2002, A&A, 391, L1
- [13] Cole S., et al., 2001, MNRAS, 326, 255
- [14] Dickinson M., et al., 2004, ApJ, 600, L99
- [15] Drory N., Salvato M., Gabasch A., Bender R., Hopp U., Feulner G., Pannella M., 2005, ApJ, 619, L131
- [16] Dunlop J.S., Cirasuolo M., McLure R.J., 2006, MNRAS, submitted, astro-ph/0606192
- [17] Dye S., et al., 2006, MNRAS, submitted, astro-ph/0603608
- [18] Eyles L.P., Bunker A.J., Stanway E.R., Lacy M., Ellis R.S., Doherty M., 2005, MNRAS, 364, 443
- [19] Fan X., et al., 2006, AJ, in press, astro-ph/0512082
- [20] Fontana A., et al., 2004, A&A, 424, 23
- [21] Foucaud S., et al., 2006, MNRAS, submitted, astro-ph/0606386
- [22] Glazebrook K., et al., 2004, Nature, 430, 181
- [23] Granato G.L., De Zotti G., Silva L., Bressan A., Danese L., 2004, ApJ, 600, 580
- [24] Grazian A., et al., 2006, A&A, in press, astro-ph/0603094
- [25] Guhathakurta P., Tyson J.A., Majewski S.R., 1990, ApJ, 357, L9
- [26] Hawley S.L., et al., 2002, AJ, 123, 3409
- [27] Hewett P.C., Warren S.J., Leggett S.K., Hodgkin S.T., 2006, MNRAS, 367, 454
- [28] Lawrence A., et al., 2006, MNRAS, submitted, astro-ph/0604426
- [29] Lonsdale C.J., et al., 2003, PASP, 115, 897
- [30] Madau P., 1995, ApJ, 441, 18
- [31] Malhotra S., et al., 2005, ApJ, 626, 666
- [32] Maihara T., et al., 2001, PASJ, 53, 25
- [33] Mandelbaum R., Seljak U., Kauffmann G., Hirata C.M., Brinkmann J., 2006, MNRAS, 368, 715
- [34] Mortier A.M.J., 2005, MNRAS, 363, 563
- [35] Miyazaki S., et al., 2002, PASJ, 54, 833
- [36] Night C., Nagamine K., Springel V., Hernquist L., 2006, MNRAS, 366, 705
- [37] Oke J.B., Gunn J.E., 1983, ApJ, 266, 713
- [38] Ota K., Kashikawa N., Nakajima T., Iye M., 2005, JKAS, 38, 179
- [39] Ouchi M., et al., 2005, ApJ, 635, L117
- [40] Page L., et al., 2006, ApJ, submitted, astro-ph/0603450
- [41] Pozzetti L. et al., 2003, A&A, 402, 837
- [42] Romano D., Silva L., Matteucci F., Danese L., 2002, MNRAS, 334, 444
- [43] Shapley A.E., Steidel C.C., Adelberger K.L., Dickinson M., Giavalisco M., Pettini M., 2001, ApJ, 562, 95
- [44] Shimasaku K., Ouchi M., Furusawa H., Yoshida M., Kashikawa N., Okamura S., 2005, PASJ, 57, 447
- [45] Sekiguchi K., et al., 2005, in Renzini A. & Bender R. ed., Multiwavelength mapping of galaxy formation and evolution. Springer-Verlag, Berlin, p82
- [46] Simpson C., et al., 2006a, MNRAS, submitted
- [47] Simpson C., et al., 2006b, MNRAS, submitted
- [48] Somerville R.S., Lee K., Ferguson H.C., Gardner J.P., Moustakas L.A., Giavalisco M., 2004, ApJ, 600, L171
- [49] Spergel D.N., et al., 2006, ApJ submitted, astro-ph/0603449
- [50] Stark D.P., Bunker A.J., Ellis R.S., Eyles L.P., Lacy M., 2006, ApJ, submitted, astro-ph/0604250
- [51] Steidel C.C., Hamilton D., 1992, AJ, 104, 941
- [52] Vanzella et al., 2006, A&A, in press, astro-ph/0601367
- [53] West A.A., Walkowicz L.M., Hawley S.L., 2005, PASP, 117, 706
- [54] Willott C.J., Delfosse X., Forveille T., Delorme P., Gwyn D.J., 2005, ApJ, 633, 630
- [55] Yan H., Dickinson M., Giavalisco M., Stern D., Eisenhardt P.R.M., Ferguson H.C., 2006, ApJ, in press, astro-ph/0604554