Long RXTE Observations of A2163
Abstract
A2163 was observed by the RXTE satellite for 530 ks during a 6 month period starting in August 2004. The cluster primary emission is from very hot intracluster gas with keV, but this component does not by itself provide the best fitting model. A secondary emission component is quite clearly needed, and while this could also be thermal at a temperature significantly lower than keV, the best fit (to the combined PCA and HEXTE datasets) is obtained with a power law secondary spectral component. The deduced parameters of the non-thermal (NT) emission imply a significant fractional flux amounting to of the integrated 3-50 keV emission. NT emission is expected given the intense level of radio emission, most prominently from a large extended (‘halo’) central region of the cluster. Interpreting the deduced NT emission as Compton scattering of the radio-emitting relativistic electrons by the CMB, we estimate the volume-averaged value of the magnetic field in the extended radio region to be G.
1Center for Astrophysics and Space Sciences, University of California, San Diego, La Jolla, CA 92093-0424
2School of Physics and Astronomy, Tel Aviv University, Tel Aviv, 69978, Israel
34789 Panorama Drive, San Diego CA 92116
Subject headings: Galaxies: clusters: general — galaxies: clusters: individual (A2163) — galaxies: magnetic fields — radiation mechanisms: non-thermal
1 Introduction
High quality spatially resolved measurements with current X-ray satellites have clearly shown that intracluster (IC) gas is not isothermal. With increasing image detail it will likely be found that non-isothermality is a general feature of clusters. This is only to be expected, given the gas extent, origin, and the processes that have affected its evolution. The only justification for spectral fitting of the emission from a large cluster region by a single temperature plasma emission code (what has been a standard procedure) was insufficient spectral and spatial resolution.
Not only the assumption of isothermality is generally invalid when characterizing the emission from a large cluster region, the expectation that the emission is purely thermal may also be doubtful when a wide spectral band is considered. This is particularly so in clusters with known extended regions of radio emission, where the radio emitting relativistic electrons give rise to non-thermal (NT) X-ray emission by Compton scattering off the Cosmic Microwave Background (CMB) radiation. The well known possibility that cluster X-ray spectra may have high energy power law tails (e.g., , Rephaeli 1977) has been largely ignored, also because of the low sensitivity of past X-ray satellites to the detection of the predicted low-level NT emission.
Non-isothermal gas distribution and NT emission are of considerable interest both intrinsically, for the detailed understanding of the astrophysics of clusters, as well as in the use of cluster properties and phenomena as cosmological probes. X-ray emission is currently our best probe of the properties of IC gas; the thermal structure of the gas can yield important information on energy exchange and transport processes. More globally, the detailed gas density and temperature profiles are required in analysis of measurements of the Sunyaev-Zeldovich (S-Z) effect and its use as a cosmological probe of the global parameters of the universe and its large scale structure. On the other hand, NT phenomena in clusters have the potential to contribute significantly to our understanding of the origin of relativistic particles and magnetic fields. It is obvious, therefore, that there is strong motivation for a more realistic characterization of cluster X-ray spectra.
The search for NT X-ray emission in clusters has been advanced considerably by the RXTE and BeppoSAX satellites. We have initiated and analyzed long RXTE observations of the Coma cluster (Rephaeli, Gruber & Blanco 1999, Rephaeli & Gruber 2002), A2319 (Gruber & Rephaeli 2002), and A2256 (Rephaeli & Gruber 2003). In all three clusters we found evidence for a second spectral component. While a secondary emission component would generally reflect the non-isothermality of IC gas, we found that in these three clusters the additional emission is likely to be mostly NT in origin. In each of the clusters this conclusion is based on the relative quality of the statistical fits (of thermal vs. NT models), and the high physical plausibility of NT X-ray emission in the central cluster region in which extended radio emission was measured. Similar BeppoSAX searches for NT in these and other clusters (including A119, A754, and A2199) also yielded evidence for NT emission in at least some of the clusters (Fusco-Femiano et al. 1999, Kaastra et al. 1999), Fusco-Femiano et al. 2000, Fusco-Femiano et al. 2003). Note that the significance of the BeppoSAX/PDS results has been questioned by Rossetti & Molendi (2003), who claim that the level of instrumental error is higher than what was previously assumed, and that the detection of NT emission in Coma is much less significant than originally reported by Fusco-Femiano et al. (1999). However, this claim has been disputed by Fusco-Femiano et al. (2004).
The moderately distant cluster A2163, , is one of the hottest, most luminous clusters, and a prime target of radio, S-Z, and X-ray observations in recent years. Its extended central region of radio emission (Herbig & Birkinshaw 1994) was extensively mapped by Feretti et al. (2001); this radio ‘halo’ is one of the largest and most luminous. Spatial correlation between bright regions in the Chandra and radio maps may be interpreted as evidence for intense merging activity (Markevitch & Vikhlinin 2001), which is thought to enhance the efficiency of particle acceleration. The gas temperature profile and a detailed temperature map were determined from XMM (Pratt et al. 2001) and Chandra (Govoni et al. 2004) measurements. Here we report the results from a very long observation of A2163, the most distant of the radio (‘halo’) clusters observed with the RXTE.
2 Observations and Data Reduction
A2163 Observations with the Proportional Counter Array (PCA) and the High Energy X-ray Timing Experiment (HEXTE) on RXTE were made during 95 separate pointings in the period August 24, 2004 - March 11, 2005. Data from PCA detectors 0 and 2 were collected in the ‘Good Xenon’ spectral mode, which produces a 256-channel count spectrum nominally from 2 to 1000 keV. The background estimation tool was found to produce spectra with a several percent gain error for the epoch of these observations; this was corrected to better than 1% in the software. Data from the two independent HEXTE clusters of detectors were taken in event-by-event mode, and were subsequently accumulated into 256-channel spectra spanning 12–250 keV. To subtract the background, each HEXTE cluster was commanded to beamswitch every between on-source and alternate off-source positions 1.5∘ on either side.
Standard screening criteria were applied to the data segments (Earth elevation angle, spacecraft pointing, avoidance of the South Atlantic Anomaly, times of geomagnetic activity), resulting in a net exposure time for PCA of ks and an average exposure time of ks for the HEXTE clusters. The HEXTE net observation times were shorter than the PCA time because HEXTE spends half of the time measuring the background, and some more time is lost from electronic dead time caused by cosmic rays.
The PCA background was estimated with the ‘L7/240’ faint source model provided by the instrument team, and was corrected for errors in detector gain independently in the two detectors. Uncertainties in the background correction precluded using PCA data above 17 keV. The total PCA counting rate was 8 count/s (c/s), or 21% of background. For HEXTE the net counting rate was 0.6 c/s, or 0.4% of background. The PCA background level is estimated to be accurate within 0.5%, or 0.2 c/s. The HEXTE background, which is directly measured, has been determined (MacDonald 2000) to be accurate to within a few hundredths c/s in long exposures.
3 Spectral Analysis
Inspection of the screened light curves for PCA and HEXTE revealed no significant variation, as expected for a cluster of galaxies. Accordingly, we co-added all the selected PCA and HEXTE data to form net spectra for analysis. Spectra from the individual PCA detectors were also coadded, and the small differences in gain were accounted for in the generation of the energy response matrices, following procedures prescribed by the PCA analysis team.
A small energy dependence for systematic errors (e.g., Gruber et al 2001) averaging about 0.8%, was applied to the PCA spectrum. Additionally, PCA spectral channels below 3 keV and above 17 keV were excluded because of sensitivity to artifacts in the background model, as well as the rapidly declining effective area of the PCA outside these bounds. Upon inspection of the high energy channels of HEXTE we restricted the analysis to data in the range 12–80 keV.
We fit the joint PCA and HEXTE spectra summed over all observations to three simple spectral models: a Raymond-Smith (R-S) thermal plasma emission model, two R-S models at different temperatures, and a R-S plus a power law model. In addition we have checked whether we can find a meaningful indication for a temperature structure by fitting the data with two R-S thermal components plus a power law. In all cases most of the observed flux is in a primary keV R-S component. Best-fit parameters and 90% confidence intervals are listed in Table 1. The best-fit temperature in the single isothermal gas model is keV, in good agreement with the range determined from XMM (Pratt et al. 2001) and Chandra (Govoni et al. 2004). The observed keV Fe XXV Kα line yields an abundance of (where denotes solar abundance), quite consistent with previously determined values (). No cold absorption was measurable, and given the 3 keV PCA threshold, none was expected.
The fit to a single isothermal model is only marginally acceptable, with for 32 degrees of freedom. Residuals have a high-low-high pattern which signals the need for another smooth spectral component. When a second thermal component is added, best-fit parameters are keV, and keV, with the second component accounting for a minor fraction, roughly 1% of the 3–50 keV flux. For this fit, , lower by 7.5 than the value obtained in the single R-S model. The F-test probability of the second component is 0.94 for two additional degrees of freedom. Although the is acceptable for this fit, the 90% error bounds of [16,80] keV for lie outside - in fact, well outside - the more tightly constrained values of keV obtained with ASCA (Markevitch 1996), keV with ROSAT (Elbaz et al. 1994), keV with XMM (Pratt et al. 2001), and keV measured with Chandra (Govoni et al. 2004). We therefore view this solution as doubtful. Indeed, the range of solutions is very wide because the problem is numerically highly degenerate. If we consider the possible sets of (, ), the value defines the joint 90% probability contour in parameter space. The lowest temperature combination permitted in this range is keV and keV, with fractions of the 3–50 keV flux, respectively, of 99% and 1%. The highest temperature combination has keV and unbounded, with 13% of the 3–50 keV flux in the higher temperature component. These results seem to indicate that the two temperature fit improves on a single temperature one mostly by accounting for emission at the higher energy channels.
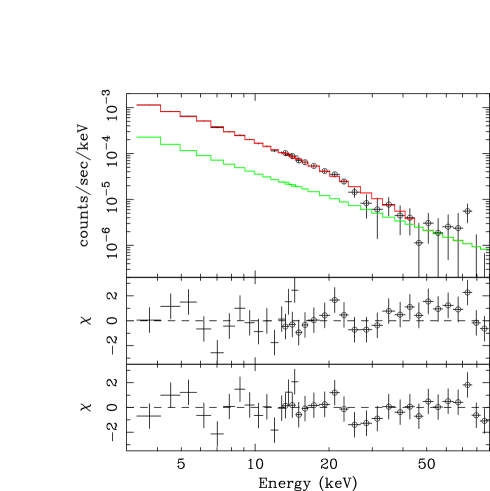
When the second component is a power law the best-fit has , fully 11.0 lower than for the isothermal fit. The best-fit power law index is with 90% confidence bounds of [-2.4, 2.7], and the 3-80 keV flux is erg/(cm2 s), with 90% confidence bounds of erg/(cm2 s). The F-test probability of this power law component is 0.99 for two additional degrees of freedom. The 3–50 keV flux of the power law component is 27% of the total. This component comprises most of the flux at energies keV. The iron abundance is , with 90% confidence bounds of . The best-fit fluxes from the combined thermal and power law emissions, and that of just the power law component, are shown in Figure 1, together with the data points. Residuals of this best fit model are plotted in the lowest panel; for comparison, the residuals to the single temperature model are shown in the middle panel. Differences between the latter two plots are apparent mostly at high energies.
The results of the temperature mapping with XMM (Pratt et al. 2001) and Chandra (Govoni et al. 2004) clearly necessitate inclusion of a temperature distribution in the fits. The RXTE FOV includes a region which is much larger than that probed by both XMM and Chandra. This, and the fact that the RXTE lacks spatial resolution, make the RXTE insensitive to even large scale features in the Chandra temperature map. The above fit to a two-temperature model grossly samples substantially different temperature components. Just so as to verify that we cannot get additional useful information from a more detailed spectral modeling, we have considered also a model with three components - two R-S and a power law. When the model parameters are fully unconstrained their values are obviously very loosely determined: The best-fit to this model - with for 28 dof - yields keV, a negligible second thermal component with keV, , , and power law normalization of erg/(cm2 s). The decrease in when a power law component is added is , so (from F-test statistics) the significance is about 85% (or, more specifically, 83% - 86%, depending on the particular choice of ‘interesting’ parameters). However, the hypersurface around the minimum correspoding to this parameter set is not very deep, meaning that a small increase of above its minimum value results in a rather different parameter set. In spite of the implied substantial uncertainty, we find that the need for a power law component is removed only when keV, which we consider to be rather unrealistic.
A power law component at the above deduced level is apparent in the HEXTE measurements. To check general consistency between results from the PCA and HEXTE, we have determined the parameters of this component by analyzing HEXTE data separately. Clearly, due to the relatively high (12 keV) lowest energy channel of HEXTE, an appreciable fraction of the thermal emission cannot be detected by this experiment, so we have set the parameters of the isothermal component to its best-fit values from the joint (PCA & HEXTE) data. Fitting for the power law, we obtain , and erg/(cm2 s) for the power law (photon) index and the integrated 3-80 keV flux. Thus, HEXTE data alone provide significant additional evidence for NT emission whose spectral index has a narrower 90% confidence interval than that determined in the joint fits. While this is a constrained fit, with only two free parameters, it is both physically (by virtue of the anticipated levels of thermal and NT emissions) and practically (given the relative insensitivity of HEXTE to emission at low energies) well motivated.
| Parameter | single R-S | two R-S | R-Spower law |
|---|---|---|---|
| 43.2/32 | 35.6/30 | 32.2/30 | |
| (keV) | 15.5 [14.6, 16.4] | 20.9 [15.6, 80] | 14.5[12.1, 21.0] |
| Normalizationa | 0.450 [0.043, 0.047] | 0.036 [0.001, 0.044] | 0.036 [0.022, 0.046] |
| Fe abundanceb | 0.24 [0.12, 0.37] | 0.27 [0.12, 0.54] | 0.32 [0.11, 0.79] |
| (keV) | 5.7 [0.8, 14.3] | ||
| Normalizationa | 0.014 [0.001, 0.045] | 0.0035 | |
| (5 keV) () | (1.33 | ||
| Photon index | 1.8 [-2.4, 2.7] |
We note that a relatively short ks observation of A2163 with BeppoSAX/PDS yielded an upper limit on power law emission, erg/(cm2 s) (Feretti et al. 2001). Our much deeper observation yields a significant detection of NT emission with a flux level erg/(cm2 s), whose 90% confidence interval includes the PDS upper limit.
4 Discussion
The results of the above spectral analysis clearly indicate that the emission in A2163 cannot be described by a single temperature emission model (as is apparent from positive residuals at both low and high energies). A better fit is provided by a two-temperature model, with the secondary thermal component accounting for the low energy residuals. The Chandra temperature map of the central cluster region shows a region, roughly in area, where the temperature is keV. The secondary thermal component we deduce has a somewhat lower value, but given the large uncertainty in the value we deduce, the difference is not significant, as is the rough - due to the substantially larger ( FWHM) RXTE FOV, which includes the emission from the cooler outer regions - consistency of the relative flux values of the two thermal components.
However, in the best fitting model the second component is not thermal, but rather a NT power law. Indeed, NT emission is expected from the populations of relativistic electrons that emit both the extended IC radio emission, as well as the emission from the several powerful radio sources in the central Mpc region of A2163. In Table 2 we list the measured radio fluxes and spectral (energy) indices for the dominant sources in the RXTE FOV. In addition to the remarkably luminous emission from the most extended, regularly-shaped ‘halo’ region, we include the emission from four sources measured by Feretti et al. (2001). Fluxes and spectral indices for the ‘halo’ and ’relic’ sources are determined from VLA measurements at 6 & 20 cm. To estimate the expected X-ray fluxes also from the three tailed (T) sources, we need to specify their spectral indices; since these were not given by Feretti et al. , we adopt a typical value of .
| Source | Flux Density - 20 cm (mJy) | Spectral (energy) index | Size (kpc) |
|---|---|---|---|
| Halo | 155 2 | 1.6 0.3 | 2070 70 |
| Relic | 18.7 0.3 | 2.1 0.3 | 460 40 |
| J1615-062 (T1) | 34.5 0.5 | 0.8 0.1 | 450 |
| J1615-061 (T2) | 6.0 0.3 | 0.8 0.1 | 120 |
| J1616-062 (T3) | 24.9 0.4 | 0.8 0.1 | 270 |
On the relevant spatial scales the radiation field most tightly coupled to the electrons by Compton scattering is the CMB, coupling that is only further enhanced in A2163 () due to the dependence of the CMB energy density. In order to quantify the emission that effectively results from the scattering, we need to determine the spectral density distribution of the electrons. Radio emission from the central extended source dominates the overall emission, and since we expect the mean, volume-averaged field in this extended source to be much lower than field strengths in the galactic radio sources, it is clear that most of the Compton-produced X-ray emission comes from the ’halo’. Nonetheless, we have estimated the emission by relativistic electrons in the other sources listed in Table 2.
Compton fluxes of the radio sources in Table 2 can be estimated from their measured radio fluxes and estimated mean field values. The latter can be determined by assuming energy equipartition between particles and fields. This assumption may be roughly valid in the particles galactic sources, by virtue of the relatively short timescales of all the relevant processes governing the particles and fields - acceleration, couplings to the field and interstellar gas. (We note in passing that the attainment of equipartition in the IC space is questionable: IC fields and particles are likely to be of galactic origin, but the evolution during their expulsion from galaxies and in IC space is quite different; effective equilibration is not likely to occur there.) Using the deduced values of the equipartition in the radio sources we have estimated their respective Compton X-ray fluxes. These turn out to be quite small for the relic as well as the three tailed sources, whose combined flux in the 3-80 keV band is of the measured value. (Note that consideration of the dominant non-’halo’ radio sources in the clusters in which we have previously found evidence for NT emission - Coma, A2256, and A2319 - similarly shows that their predicted X-ray emission contributes negligibly to the deduced NT emission in each of these clusters.)
Since the known radio sources in the central region of A2163 do not contribute appreciable X-ray emission, we attribute all the measured emission to electrons in the ’halo’, and proceed to determine the mean, volume-averaged field in this region, , using the Compton-synchrotron formulae (e.g., Rephaeli 1979). For consistency with the basic premise that most of the measured Compton flux is due to electrons in the ‘halo’, and the fact that the electron spectrum can be more precisely deduced from the radio data, we use the radio spectral index in order to infer the electron index. Doing so we compute G. It should be emphasized that the overall uncertainty in the estimated mean field is substantially higher than this formal error due to the lack of spatial information on NT X-ray emission, which necessitates invoking the assumption that the emitting relativistic electrons and the field are co-spatial.
As a consequence of the assumption that the spatial factors in the theoretical expressions for the radio and NT X-ray fluxes are roughly equal, it follows that the mean value of the deduced magnetic field is independent of the source size and distance. The relativistic electron energy density does depend on these parameters. Scaling to the observed radius of the diffuse radio emission, and integrating the electron spectral distribution over all energies above 1 GeV, we obtain , where is the value of the Hubble constant in units of km s-1 Mpc-1). Based on the high Galactic proton to electron energy density ratio of cosmic rays, it can be conjectured that the energetic proton energy density much higher than this value. A more specific assessment cannot be made without consideration of the electron and proton origin and their respective energy losses.
IC magnetic fields can also be estimated from Faraday rotation measurements of background radio sources seen through clusters, yielding a different mean field value, . These measurements usually yield field values that are a few G (see, e.g., , Clarke, Kronberg, and Böhringer 2001, and the review by Carilli & Taylor 2002), up to an order of magnitude higher than values of . Average field strength of a few G over an extended cluster region would have important implications on the range of electron energies that are deduced from radio measurements, and therefore on the electron (synchrotron and Compton) energy loss times. Weaker mean (volume-averaged) fields imply higher electron energies, and therefore shorter electron energy loss times, with possibly important ramifications for relativistic electron models (e.g., , Rephaeli 1979, Sarazin 1999, Ensslin et al. 1999, Brunetti et al. 2001, Petrosian 2001). However, the apparent discrepancy between deduced values of and is usually naively interpreted. and actually provide very different measures of the mean field strength: is essentially a weighted volume-average of the relativistic electron density and of , with ; on the other hand, is an average of the product of the line of sight component of the field and the gas density. In general, the overall spatial dependence of these averages are considerably different, and so are their deduced values. Specific examples and quantitative comparisons, including also the impact of observational uncertainties, are given by Goldshmidt & Rephaeli (1993), and by Newman, Newman & Rephaeli (2002).
We are grateful to the referee for very helpful critical comments. This work was supported by a NASA grant at UCSD.
REFERENCES
Brunetti, G., et al. 2001, MN, 320, 365
Carilli, C.L., & Taylor, G.B. 2002, ARAA, 40, 319
Clarke, T.E., Kronberg, P.P., & Böhringer, H. 2001, ApJ, 547, L111
Elbaz D., et al. 1995, A&A, 993, 337
Ensslin T.A., et al. 1999, A&A, 344, 409
Ferreti L., Fusco-Femiano G., Giovannini G. & Govoni F. A&A 2001, 373, 106
Fusco-Femiano, R., et al. 1999, ApJ, 513, L21
Fusco-Femiano, R. et al. 2000, ApJ, 534, L7
Fusco-Femiano, R. et al. 2003, Proceedings of ‘Matter and Energy in Clusters of Galaxies’, ASP, Conf. Ser., eds: S.Bowyer & C-Y.Hwang
Fusco-Femiano, R., et al. 2004, ApJ, 602, 73
Goldshmidt, O., & Rephaeli, Y., 1993, ApJ, 411, 518
Govoni, F. et al. 2004, ApJ, 605, 695
Gruber, D.E. et al. 2001, ApJ 562, 499.
Gruber, D.E., & Rephaeli, Y. 2002, ApJ, 565, 877
Herbig, T., & Birkinshaw, M. 1994, BAAS, 185, 530
Kaastra, J.S. et al. 1999, ApJ, 519, L119
MacDonald, D., & Gruber, D.E. 2000, BAAS, 32, 1184
Markevitch, M. 1996, ApJ, 465, L1
Markevitch, M. and Vikhlinin, A. 2001, ApJ, 563, 95
Newman, W.I., Newman, A.L., & Rephaeli, Y. 2002, ApJ, 575, 755
Petrosian, V. 2001, ApJ, 557, 560
Pratt, G.W., Arnaud, M., & Aghanim, N. 2001, XXI Moriond Astrophysics Meeting, eds. D.M. Neumann & J.T.T. Van
Rephaeli, Y. 1977, ApJ, 212, 608
Rephaeli, Y. 1979, ApJ, 227, 364
Rephaeli, Y., & Gruber, D.E. 2002, ApJ, 579, 587
Rephaeli, Y., & Gruber, D.E. 2003, ApJ, 595, 137
Rephaeli, Y., Gruber, D.E., & Blanco, P.R. 1999, ApJ, 511, L21
Rossetti, M., and Molendi, S. 2004, A&A, 414, L41
Sarazin, C.L. 1999, ApJ, 520, 529