Bright Localized Near-Infrared Emission at 1–4 AU in the AB Aurigae Disk Revealed by IOTA Closure Phases
Abstract
We report on the detection of localized off-center emission at 1–4 AU in the circumstellar environment of the young stellar object AB Aurigae. We used closure phase measurements in the near-infrared made at the long baseline interferometer IOTA, the first obtained on a young stellar object using this technique. When probing sub AU scales, all closure phases are close to zero degrees, as expected given the previously-determined size of the AB Aurigae inner dust disk. However, a clear closure phase signal of is detected on one triangle containing relatively short baselines, requiring a high degree of non-point symmetry from emission at larger (AU-sized) scales in the disk. We have not identified any alternative explanation for these closure phase results and demonstrate that a “disk hot spot” model can fit our data. We speculate that such asymmetric near-infrared emission detected might arise as a result of localized viscous heating due to a gravitational instability in the AB Aurigae disk, or to the presence of a close stellar companion or accreting sub-stellar object.
1 Introduction
AB Aurigae (A0 Ve, pc, V = 7.1, H = 5.9) is often referred to as the prototype of the Herbig Ae/Be (HAeBe) class of pre-main sequence stars of intermediate mass. Like their solar-type analogs, the T Tauri objects, HAeBe objects are known to be surrounded by pre-planetary disks of gas and dust. AB Aur was one of the first young stellar objects (YSO) to be spatially resolved in the near-infrared (NIR) (Millan-Gabet et al., 1999), using the technique of long baseline optical interferometry. These and subsequent observations of a relatively large sample of HAeBe (and T Tauri) objects found that essentially all objects have characteristic NIR sizes much larger than expected from previous-generation disk models that were tuned to fit the spectro-photometric data alone (Tuthill, Danchi & Monnier, 1999; Akeson et al., 2000; Millan-Gabet, Schloerb, and Traub, 2001; Akeson et al., 2002; Eisner et al., 2004; Akeson et al., 2005; Eisner et al., 2005; Monnier et al., 2005). These results have prompted in part a significant revision of disk models, whereby previously ignored detailed physics of the disk inner edge are now incorporated with some success (Natta et al., 2001; Dullemond, Dominik & Natta, 2001; Monnier & Millan-Gabet, 2002; Muzerolle et al., 2003; Isella & Natta, 2005). For a recent review of these developments the reader is also referred to Millan-Gabet et al. (2006).
A common characteristic of all the interferometer studies mentioned is that they were based on single-baseline data, and therefore depended on the interpretation of only visibility amplitudes and with very sparse spatial frequency coverage. One of the unexplored frontiers in optical long baseline interferometry, particularly in the area of YSO science, is the measurement and interpretation of not only visibility amplitudes, but also closure phases (CP), obtained at arrays containing three or more telescopes. Contrary to the visiblity amplitudes or phases measured for baseline pairs, the CP is uncorrupted by atmospheric turbulence (Jennison, 1958; Monnier, 2003), and can be calibrated to higher precision. The CP can have values different from 0 or only for a non-point-symmetric sky brightness, and is therefore a highly effective probe of this type of morphology. Moreover, CP and visibility amplitude data may be used together to provide powerful constraints to parametric models describing relatively complex morphologies. In principle, given sufficient spatial frequency coverage, direct image reconstruction becomes possible, as is commonly done at radio wavelengths (Readhead et. al., 1980; Cornwell & Wilkinson, 1981).
The new models of HAe objects, and of AB Aur in particular, successfully reproduce the spectral features and broadband spectral energy distribution (SED) with a model in which no or little optical depth exists between the central star and the dust disk inner edge, such that the frontal stellar heating forms a hot wall of emission from which essentially all the NIR (disk) flux arises. This model is also successful at reproducing the characteristic NIR sizes measured interferometrically. Moreover, the outer regions of circumstellar disks are believed to have scale heights that increase with radius (flaring, Kenyon & Hartmann, 1987). Thus, non-point-symmetric brightness distributions and non-zero CPs are expected for star-disk systems such as AB Aur if they have some inclination to the observer’s line of sight, as the cooler foreground disk regions occult part of the hotter inner disk regions (see also Tuthill, Danchi & Monnier, 1999; Malbet, Lachaume & Monin, 2001; Isella & Natta, 2005). The original goal of the work presented here, was to search for such skewed emission coming from the inner dust disk; and in a forthcoming publication (Monnier et al., 2006) we discuss in detail the results of our survey of 14 YSOs in the context of hot inner-dust wall models. In this Letter, we report instead on the unexpected detection of a strong CP signal that originates further out in the AB Aur disk.
2 Observations and Data Analysis
The data presented here were obtained at the upgraded three-telescope Infrared Optical Telescope Array (IOTA) (Traub et al., 2003), using the new integrated-optics (IO) H-band combiner IONIC-3 (Berger et al., 2003). IOTA/IONIC-3 has been in routine operation since December 2002, and first scientific results were published in Monnier et al. (2004) and Kraus et al. (2005).
The three IOTA telescopes are moveable along two orthogonal linear arms; telescopes A and C can move along a 35 m north-east arm, while telescope B moves along a 15 m south-east arm. This allows an aperture of 35 m 15 m to be synthesized, giving a maximum physical baseline m. For the AB Aur declination (), the projected baselines are in the range m, providing spatial resolution mas (or 0.6 – 2.4 AU) in H-band (). The IONIC-3 optical circuit acts to split the light from each telescope before recombining each telescope pair (AB, BC, AC) at three IO couplers, leading to six interferometric channels (two for each baseline).
The work presented here is based on observations made over the period December 2002 December 2004, comprising a total of 18 epochs, 14 two-telescope configurations (visibility amplitude data) and 6 three-telescope configurations (CP data). As is standard practice, observations of AB Aur were interspersed with observations of nearby calibrator stars to measure slowly varying system visibilities and CPs. We used the calibrator stars HD 32406 (K0III, V = 6.2, H = 3.6) and HD 31233 (K0, V = 7.2, H = 4.6); of uniform-disk angular diameters mas and mas respectively. The observations presented here were made using a standard H-band filter (, ) and in un-polarized light.
Reduction of the visibility amplitude data was carried out using a custom implementation of the method outlined by Coudé du Foresto, Ridgway & Mariotti (1997) and already described and demonstrated in Monnier et al. (2004). To ensure a good CP measurement, we required that interferograms be detected on baselines, a condition nearly always maintained by a real-time fringe packet “tracker” (Pedretti et al., 2005). Based on studies of our absolute night-to-night calibration accuracy, we adopt a typical systematic error of (e.g., 2.5% error in visibility for unresolved sources); this error has been combined (in quadrature) with the statistical error for plotting and fitting purposes. We followed the method of Baldwin (1996) for calculating the complex triple amplitude in deriving the CP, explicitly guaranteeing “fringe frequency closure” (). Chromaticity effects are the main limitation to our absolute precision when the calibrator and source are of very different spectral types because of different effective wavelengths. While we minimize these errors by using calibrators of spectral type relatively similar to that of the target, a conservative systematic error of has been adopted here. Further details on our data reduction and calibration methods are given in Monnier et al. (2006). The and CP data have been averaged in the 2-D spatial frequency plane using an averaging interval of 4 m, resulting in 75 and 37 independent and CP measurements, respectively. The calibrated and CP data are available from the authors111The data can also be found in the data archives section of the Optical Long Baseline Interferometry News (OLBIN) web site, http://www.olbin.jpl.nasa.gov in the OI-FITS format (Pauls et al., 2005).
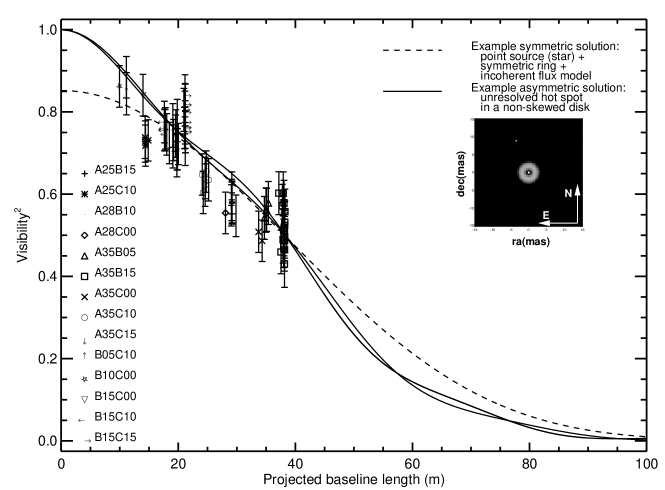
The and CP data are shown in Figures 1 and 2, along with models discussed in the next section. The main characteristics of our AB Aur data which underlie the principal results presented in this Letter are as follows: (1) A definite CP signal is detected ( to ), which surprisingly appears in a triangle of relatively short baselines (triangle A25B15C10)222The notation AxxByyCzz indicates an IOTA configuration in which telescope A is located at the station which is xx meters from the array origin, located at the corner of the L-shaped track, and similarly for telescopes B and C, indicating some degree of non-point-symmetry on relatively large spatial scales (1–4 AU, see 3). (2) The CP data are consistent with zero on all other baseline triangles (Figure 2), indicating a high degree of point-symmetry on sub-AU spatial scales for AB Aur. (3) In spite of including baselines of varying orientations, the curve traced by the vs. baseline length data (Figure 1) is relatively smooth, indicating that the NIR brightness is also largely circularly symmetric on small scales (consistent with previous interferometer observations). (4) The vs. baseline length curve traced by the data does not appear to extrapolate to 1.0 at zero spatial frequency, implying the presence of an extended component contributing a small fraction of the H-band flux (% if it were completely resolved by the shortest IOTA baselines, m). We note that of the 14 YSOs in our CP survey (Monnier et al., 2006), AB Aur is unique in showing non-zero CP simultaneous with such high visibilities.
3 Modelling and Results
The coverage obtained in these observations is relatively dense, unprecedented for YSO observations using an optical interferometer. However, it still contains significant gaps, a pronounced north-south bias, and even for the longest IOTA baselines AB Aur appears only partially resolved (); all of which frustrate attempts to directly reconstruct a meaningful image from the and CP data.
We have thus turned to parametric imaging in order to interpret our observations. Motivated by the inner dust-wall models introduced in 1 we begin by modelling the AB Aur NIR brightness as central star plus a Gaussian ring, of inner diameter and width (expressed as fraction of the inner ring diameter). We use previous results based on SED decomposition which have established that the central star in AB Aur contributes % of the H-band flux and is unresolved (point-like) to the IOTA baselines (Millan-Gabet, Schloerb, and Traub, 2001) – the exact stellar fractional flux is not relevant to the conclusions of this Letter. Although the visibility amplitude data allow a direct measurement of the ring diameter, they do not constrain the ring width well, and we follow previous workers in adopting a 25% fractional width for the ring (also not critical to our conclusions). Fits of elliptical rings (representing inclined inner disks) to the data find near-unity major axis/minor axis ratios, i.e., small disk inclinations consistent with previous results from near-IR interferometry (Millan-Gabet, Schloerb, and Traub, 2001; Eisner et al., 2004), scattered light images (Grady et al., 1999; Fukagawa et al., 2004) and mm interferometry (Corder, Eisner & Sargent, 2005). We therefore adopt a face-on orientation. From the best fit starring model shown in Figure 1 it can be seen (as mentioned above) that the curve does not extrapolate to , and therefore the model allows for a fraction of the total flux to be completely incoherent (i.e., large compared to the angular resolution of the shortest baselines). The best-fit solution (to only, resulting in ) has the following parameters: mas (0.39 0.02 AU), ; and is shown with dashed lines in Figures 1 and 2. This value for the ring diameter is in good agreement with recent interferometer measurements (Eisner et al., 2004).
The above model describes some of the main features of the AB Aur system (number of components needed, characteristic size and shape). However, in order to also fit the non-zero CPs, we need to consider non-symmetric models. As described in 1, flared disks with non-zero inclination are expected to evince occultation the near side of the inner disk, resulting in a non-symmetric brightness. However, as just discussed, the inclination of the AB Aur disk is believed to be low. Moreover, in order to measure the CP resulting from asymmetries in the inner disk, the emission has to be well resolved. As shown in Monnier et al. (2006) the CP is strongly suppressed when, as in the AB Aur case, the inner disk diameter (3.1 mas) is less than 1/2 the fringe spacing corresponding to the longest baseline in a triangle. Here we have confirmed this result by introducing an azimuthal cosine modulation of the Gaussian ring in order to approximate the morphology of a partially occulted inner disk (see Monnier et al. (2006) for details of these skewed ring models), and found that it can produce at most a signal of when the solutions are constrained to reproduce (even approximately) the data and the zero CP measured in the other baseline triangles.
We therefore must add an additional source component at larger spatial scales which introduces additional skewness to the model. In order to quantify the level of asymmetry that is required, we have adopted a simple Gaussian profile which is offset with respect to the central disk emission (“Disk Hot Spot” model). The new component is thus characterized by its full-width at half-maximum (), location (angular separation and position angle ) and the fractional flux () it contributes. Fitting this simple model we find that solutions exist that reproduce both the and CP data reasonably well. However, we emphasize that several solutions exist which are statistically equivalent, and although we can assign definite spatial scales and fractional fluxes to the offset Gaussian, we are not able to assign a definite direction to the asymmetry (e.g., there are reasonable solutions with northern as well as southern offsets). We have included the best-fit parameters associated with a few of the best solutions in Table 1 for reference.
Quantitatively, the solutions found are defined by the following characteristics: (1) when the offset Gaussian feature is allowed to be spatially extended, the angular separations are mas (4.3 AU), width mas (1.7 AU) and fractional flux % (we also note that in this case slightly better fits are found when the inner ring is also allowed to be skewed, rather than symmetric); and (2) for the special case that the offset component is unresolved (i.e., a point source companion), closer separations mas (1.25 AU) and lower fractional fluxes % are found (in this case with no benefit from additional skew in the inner ring). An example fit of the latter case is shown (solid lines) in Figures 1 and 2. The example shown is typical of the quality of the fits obtained () and corresponds to the parameters: , mas (1.4 AU) and . As can be seen, although the solution is not entirely adequate on all baseline pairs and triangles, indicating the need for a more complex model, this simple model is capable of reproducing most data well, in particular the observed .
4 Discussion
The principal result of this Letter is the clear detection of an unexpected localized asymmetry in the circumstellar environment of AB Aur at spatial scales of 1–4 AU; this is an intermediate scale between the the inner wall containing the hottest dust and the outer disk.
We first considered that the physical origin of this emission could be H-band scattering off the disk atmosphere or “halo”. The required asymmetry could easily arise from a small photocenter shift due to e.g., forward scattering in combination with a small disk inclination. However, this emission would arise from large angular scales (up to ) and would be completely resolved by even the shortest IOTA baselines, and therefore could not result in a CP signal. Indeed, the model fitting described above shows that the offset Gaussian must be relatively compact ( mas or 1.7 AU), and it is difficult to reconcile the required amount of flux with scattering over such a small area. Due to the low inclination known for the AB Aur disk, we also do not favor outer disk occultation or opacity effects.
A more likely explanation, is that the asymmetry is due to compact thermal emission. The presence and persistence of such a local inhomogeneity in the AB Aur disk at these spatial scales would however be surprising, given that the dynamical time-scales are very short (1–5 years) compared to the age of the system ( Myr). A possible explanation is that the disk is not steady state, and the feature corresponds to a gravitational instability, possibly associated with an inner extension of the spiral density waves seen in near-IR coronographic and millimiter interferometry images (Fukagawa et al., 2004; Pietu, Guilloteau & Dutrey, 2005). The existence of a disk instability at few AU radii and for a disk of this age clearly has important implications for the formation of planets in these disks.
Alternatively, we could be detecting a companion embedded in the AB Aur disk.333We note that Baines et al. (2006) report “spectro-astrometric” evidence for binarity in AB Aur (and several other HAeBe objects). However, they infer large separations of ; therefore this putative companion can not be related to the CP signatures modelled here. A stellar companion at the few–AU separation we infer is however unlikely, given that a substantial circumstellar disk has in fact survived around AB Aur. The intriguing possibility therefore arises that the companion is instead a proto-planetary object forming in the disk.
Similar claims (but based on visibility amplitudes rather than the more robust CP) for a disk thermal instability or close companion have been recently made for the active-disk system FU Orionis (Malbet et al., 2005). We also note the possible connection between the extended structure detected here, and the intriguing compact halo (45 mas FWHM) seen in the T Tauri object DG Tau in lunar occultation observations by (Leinert et al., 1991). As discussed by Monnier et al. (2006), disk “halos” appear to be common (although not the norm) in young star disk systems, and deserve new observational and modelling scrutiny.
Our hypothesis is readily testable. If the non-zero CP arises in a “disk hot spot,” variability in the CP signal over 1–5 years should reveal the orbital motion that could be followed using short or long baselines from the VLTI AMBER (Malbet et al., 2004) or MIDI (Leinert et al., 2003) instruments, respectively. The angular scales involved also make this object a prime target for direct imaging using high resolution techniques on large single-aperture telescopes.
References
- Akeson et al. (2000) Akeson, R. L., Ciardi, D. R., van Belle, G. T., Creech-Eakman, M. J., and Lada, E. A. 2000, ApJ, 543, 313
- Akeson et al. (2002) Akeson, R. L., Ciardi, D. R., van Belle, G. T., & Creech-Eakman, M. J. 2002, ApJ, 566, 1124
- Akeson et al. (2005) Akeson, R. L., Walker, C.H., Wood, K., Eisner, J.A., Scire, E., Penprase, B., Ciardi, D. R., van Belle, G. T., Whitney, B., and Bjorkman, J.E., 2005, ApJ, 622, 440
- Baines et al. (2006) Baines, D. et al. 2006, MNRAS, 367, 737
- Baldwin (1996) Baldwin, J. E. et al. 1996, A&A, 306, L13
- Berger et al. (2003) Berger, J-P. et al. 2003, Proc. SPIE, 4838, 1099
- Corder, Eisner & Sargent (2005) Corder, S., Eisner, J. & Sargent, A., 2005, ApJ, 622, 133L
- Cornwell & Wilkinson (1981) Cornwell, T. J. & Wilkinson, P. N. 1981, MNRAS, 196, 1067
- Coudé du Foresto, Ridgway & Mariotti (1997) Coudé du Foresto, V., Ridgway, S. & Mariotti, J. M. 1997, A&AS, 121, 379
- Dullemond, Dominik & Natta (2001) Dullemond, C. P., Dominik, C., Natta, A. 2001, ApJ, 560, 957
- Fukagawa et al. (2004) Fukagawa, M. et al. 2004, ApJ, 605, L53
- Grady et al. (1999) Grady, C. A. et al. 1999, ApJ, 523, L151
- Eisner et al. (2004) Eisner, J.A., Lane B.F., Hillenbrand, L.A., Akeson, R.L. & Sargent, A.I., 2004, ApJ, 613, 1049
- Eisner et al. (2005) Eisner, J.A., Hillenbrand, L.A., White, R.J. Akeson, R.L. & Sargent, A.I. 2005, ApJ, 623, 952
- Isella & Natta (2005) Isella, A. & Natta, A. 2005, A&A, in press
- Jennison (1958) Jennison, R. C. 1958, MNRAS, 118, 276
- Kenyon & Hartmann (1987) Kenyon, S. J. & Hartmann, L. 1987, ApJ, 323, 714
- Kraus et al. (2005) Kraus, S. et. al. 2005, AJ, 130, 246
- Leinert et al. (1991) Leinert, Ch. et al. A&A, 250, 407
- Leinert et al. (2003) Leinert, Ch. et al. 2003 Ap&SS, 286, 1, 73-83.
- Malbet et al. (2004) Malbet F. et al. 2004, in Proceedings of the SPIE, 5491, 1722.
- Malbet et al. (2005) Malbet, F. et al. 2005, A&A, 437, 627
- Malbet, Lachaume & Monin (2001) Malbet, F., Lachaume, R. & Monin, J. L. 2001, A&A, 379, 515
- Millan-Gabet et al. (1999) Millan-Gabet, R., Schloerb, F. P., Traub, W. A., Malbet, F., Berger, J. P., & Bregman, J. D. 1999, ApJ, 513, L131
- Millan-Gabet, Schloerb, and Traub (2001) Millan-Gabet, R., Schloerb, F. P., and Traub, W. A, 2001, ApJ, 546, 358
- Millan-Gabet et al. (2006) Millan-Gabet, R. et al., 2006, in Protostars and Planets V, in press
- Monnier (2003) Monnier, J. D. 2003, Reports on Progress in Physics, 66, 789
- Monnier & Millan-Gabet (2002) Monnier, J. D. & Millan-Gabet, R. 2002, ApJ, 579, 694
- Monnier et al. (2004) Monnier, J. D. et al. 2005, ApJ, 602, L57
- Monnier et al. (2005) Monnier, J. D. et al. 2005, ApJ, 624, 832
- Monnier et al. (2006) Monnier, J. D. et al. 2006, ApJ, in press
- Muzerolle et al. (2003) Muzerolle, J., Calvet, N., Hartmann, L., D’Alessio, P. 2003, ApJ, 597, 149
- Natta et al. (2001) Natta, A.; Prusti, T., Neri, R., Wooden, D., Grinin, V. P., Mannings, V. 2001, A&A, 371, 186
- Pauls et al. (2005) Pauls, T., Young, J. S., Cotton, W. D., Monnier, J. D. 2005, PASP, in press
- Pedretti et al. (2005) Pedretti, E. et al. 2005, Applied Optics, in press
- Pietu, Guilloteau & Dutrey (2005) Pietu, V., Guilloteau, S. and Dutrey, A., 2005, A&A, 443, 945
- Readhead et. al. (1980) Readhead, A. C. S.; Walker, R. C.; Pearson, T. J.; & Cohen, M. H. 1980, Nature, 285, 137
- Traub et al. (2003) Traub, W. A. et al. 2003, Proc. SPIE, 4838, 45
- Tuthill, Danchi & Monnier (1999) Tuthill, P. G.; Monnier, John D.; Danchi, William C. 1999, Nature, 398, 487
| Model | Fraction of Light | Disk Properties | Spot Properties | Reduced | ||
|---|---|---|---|---|---|---|
| Description | Star | Disk | Spot | (V2,CP) | ||
| Unresolved hot spot | 0.3 | 0.68 | 0.02 | Ring Diameter 3.6 mas | Unresolved Spot | 1.5 |
| with non-skewed diskbbThe predictions of this model are compared to the data in Figures 1 and 2. | Ring Width/Diameter 0.25 | 9 mas at PA 22 | ||||
| Gaussian hot spot | 0.3 | 0.62 | 0.08 | Ring Diameter 3.1 mas | Gaussian FWHM 12 mas | 1.8 |
| with skewed disk | Ring Width/Diameter 0.5 | 29 mas at PA 12 | ||||
| Max Skew1.0 at PA 172 | ||||||