The Large-Scale Structure view on the Galaxy-Quasar-AGN connection
Combined investigations of the clustering properties of galaxies of different spectral type and high-redshift quasars strongly suggest local ellipticals to be the parent population of optically bright Active Galactic Nuclei (AGN). However, the picture gets more blurred when one extends the analysis to that class of AGNs which show enhanced radio emission. Objects belonging to this class in fact are found to be associated with structures which are about an order of magnitude more massive than those that host radio-quiet AGNs. Also, masses for the black holes engines of radio-enhanced AGN emission turn out to be systematically higher than those which fuel ’normal’ quasars. On the other hand, the level of radio-activity in radio-luminous objects does not seem to be connected with black hole/host galaxy mass, at variance with what found in the optical case. These results, together with evidences for different cosmological evolutions of different types of AGNs pose a serious challenge to all those models aiming at providing a unified picture for black hole-powered sources.
1 The Quasar-Galaxy Connection
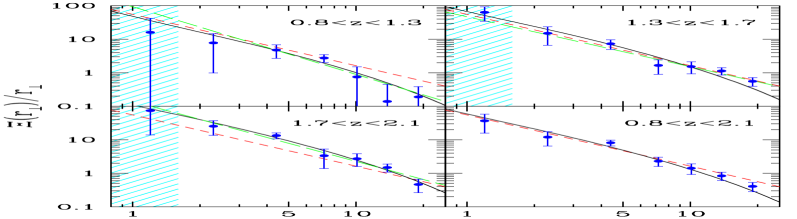
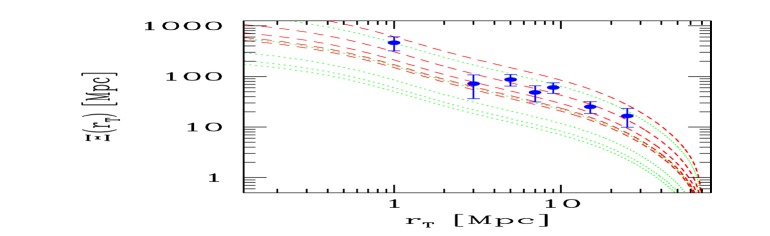
A careful analysis of the clustering properties of optically selected quasars has been performed by . These authors have concentrated on objects taken from the 2dF Quasar Redshift Survey in the redshift range . Investigations of the projected spatial correlation function (see Figure 1) was performed by means of the so-called Halo Occupation Model. Its main quantity, the Halo Occupation Number (HON) , provides the mean number of sources brighter than some luminosity threshold hosted by a dark matter halo of chosen mass and, for halo masses greater than some chosen value , can be written as follows:
| (1) |
Combinations of values for the three parameters , presented in equation (1) have been considered so to match the observations in three different redshift ranges, in order to investigate any possible evolution of the quasar properties with look-back time. The main results, presented in Table 1 and in the left-hand panel of Figure 1, indicate that the typical minimum masses of haloes hosting optically selected quasars do not show great variations with redshift and lie in the narrow range . Also, the way the number of quasars hosted by a halo increases with its mass can be considered as constant () with good approximation. As a matter of fact, found that the 2dF QSO clustering data can be easily described if one assumes values for the halo occupation number which stay constant in the whole redshift range covered by the data, denoting no evolution for at least some of the main structural properties connected to the presence and activity of quasars.
| Early - | QSOs - | QSOs - | QSOs - |
|---|---|---|---|
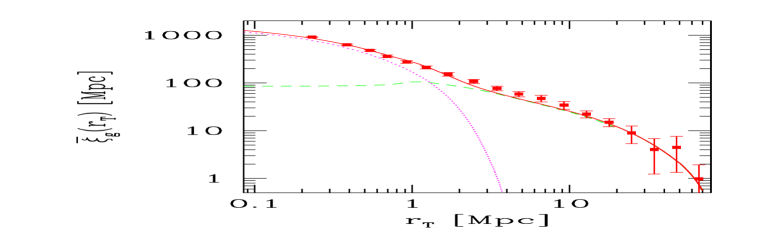
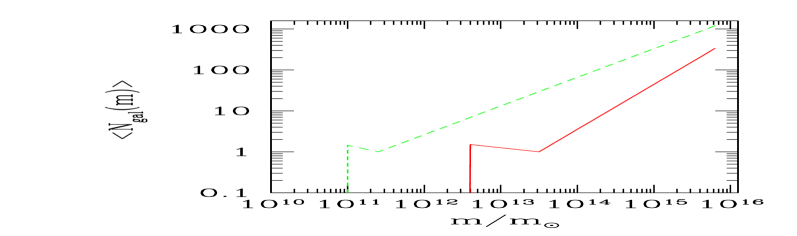
The HON estimates summarized in Table 1 are in extremely good agreement with those obtained by in the investigation of the clustering properties of 2dF galaxies of early spectral type as measured by . By again working within the HON framework, these authors indeed find that the projected correlation function of early-type galaxies (left-hand panel of Figure 2) can be very nicely described by assuming local elliptical galaxies to be hosted by haloes always more massive than , with a mean number increasing linearly with halo mass (, cfr right-hand panel of Figure 2 and Table 1). We note that such an agreement between halo occupation properties of local () elliptical galaxies and intermediate-to-high redshift quasars is even more striking as the functional form adopted by for shows a number of differences when compared to that presented in equation (1).
The above results then imply that the structures which host QSOs at high redshifts are the same as those harbouring elliptical galaxies in the local universe. The picture that emerges purely from Large-Scale Structure studies is that of a strong evolutionary connection between local elliptical galaxies and high-redshift quasars, whereby the former class of sources can be identified as the parent population of bright, optically active AGNs. The chances to find an elliptical galaxy in its AGN phase is however low (in the redshift range considered by the ratio between the number of galaxies hosting a quasar to that of the whole galaxy population is ), due to the limited life-time of the quasar phenomenon. is estimated by to be yr at , showing some hint for a decline at lower redshifts, possibly due to the more limited reservoir of gas needed to fuel the black hole (BH) hosted in the galaxy centres.
2 Radio AGN
Having dealt with optically selected quasars, we can now move on to investigating the properties of the broader class of Active Galactic Nuclei. In particular, we will concentrate our attention on radio-active sources, trying to tackle the following issues:
– What is the connection between optical AGNs and radio sources?
– Is the evolution of radio-active sources the same as that of optical AGNs?
– Is radio-activity related to short-scale and/or large-scale processes?
– And ultimately: what triggers radio-activity?
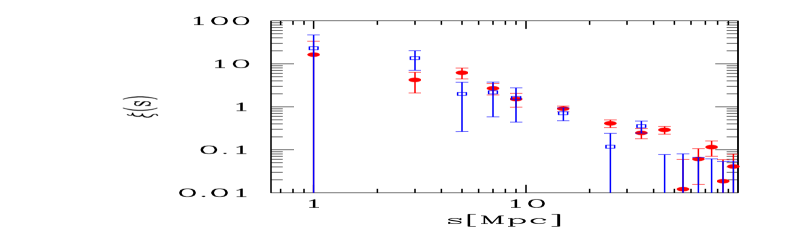
Once again, investigations of the large-scale properties of radio-active sources proves to be a very important diagnostic tool towards a correct interpretation of the AGN phenomenon. For instance, analyses of the clustering properties of the population of local radio galaxies performed by show that the correlation function of such sources has an amplitude which is about twice that found for ’normal’ elliptical galaxies . Furthermore, comparisons with models (cfr left-hand panel of Figure 3) clearly indicate that local radio-active AGN have to reside in haloes more massive than . This figure is about a factor 10 higher than that found for optically selected quasars in Section 1. If we use the relation developped by , the above findings imply masses for the black holes powering the quasar phenomenon to be about an order of magnitude smaller than those fuelling radio galaxies ( vs ).
Another important piece of information can be obtained through the study of the clustering properties of sources with different radio luminosities. The results are illustrated in the right-hand panel of Figure 3 and show that, within the errors, differences in the redshift-space correlation function of radio galaxies belonging to different classes of radio luminosity are negligible. If we then once again connect the clustering properties of bright and faint radio sources with the masses of the haloes which host them, and also refer to the results presented so far, we can conclude that there seems to be the need for a threshold halo (BH) mass to produce significant emission from AGN. However, once radio activity is onset, there is no evidence for a connection between radio luminosity and dark matter content (BH mass). We note that a strong back-up to the above statement comes from the results of who estimated BH masses directly from the spectra of a sub-sample of optically selected quasars with intense radio emission and found them not only to be independent on the level of radio activity, but also to be systematically more massive than those associated to the whole quasar population ( vs ).
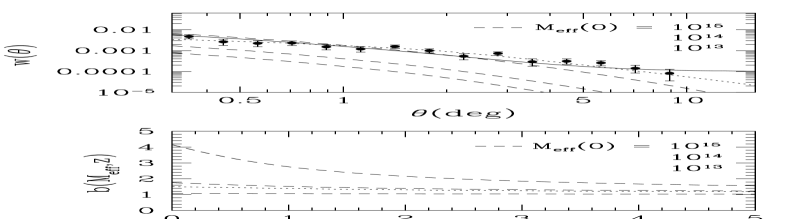

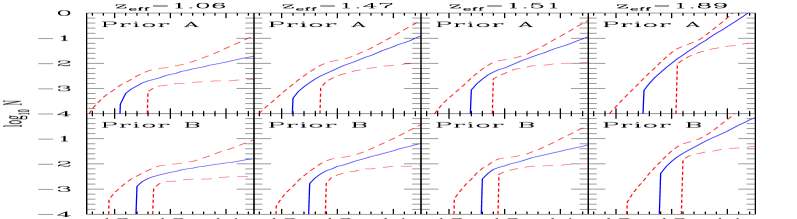
Some more interesting constraints on the behaviour of radio sources can be obtained by investigating the clustering properties of the whole radio population, regardless of their redshift distribution. The angular two-point correlation function of sources brighter than 10 mJy as measured by in fact presents the puzzling behaviour of a power-law trend which extends up to angular scales of the order of degrees (left-hand panel of Figure 4). The redshift distribution of radio sources with S mJy is predicted to be quite broad, spanning the redshift range, with a peak at . The maximum contribution to the angular correlation function is then expected to originate from those sources which identify the peak of . On the other hand, the spatial correlation function for the dark matter is shown to become negative for comoving separations Mpc (the exact value depending on the adopted cosmology) which, for a median redshift , corresponds to degrees. It then follows that if one assumes constant masses for the dark matter halos which host radio sources as it was in the case of optically-selected quasars, it is impossible to explain the observed positive tail of beyond degrees. We note that this problem is not alleviated either by adding to the total a contribution from local star-forming galaxies or by adopting different halo masses. Even variations of the background cosmology (performed by considering different values for the parameters , and ) do not manage to reconcile models with observations (for a detailed approach to the above issues see ).
The only possible way out to this problem is to invoke a clustering which was
weaker in the past. This can be done if we assume the characteristic mass
of halos hosting radio sources to be proportional to , i.e. the
typical mass-scale when fluctuations collapse to form bond
structures . In this case, the predicted provides a much
better description to the data on all scales (cfr dashed curves in Figure 4).
The best-fit correlation is provided in the standard WMAP cosmological scenario by
a local mass for the halos hosting radio sources , showing once again that – at least locally – radio sources
trace the distribution of the most massive structures in our universe such as
clusters of galaxies.
Taken at face value, the above result points to different
evolutionary properties for different classes of AGNs.
In fact, while optically selected quasars are associated to halos
with effective masses which
stay constant with look-back time up to the highest probed redshifts
(, cfr the right-hand panel in Figure 4), masses for those
hosting radio sources are found to decrease with . Indeed, radio sources seem
to reside within the largest structures which collapse at any given epoch;
in a narrow redshift interval around these correspond to the hosts of
optical quasars, while in the local universe they can be identified with
groups and clusters of galaxies.
3 Conclusions
The results presented in this work and mainly based on Large-Scale Structure studies can be summarized as follows:
-
1.
There exists a strong evolutionary connection between high-z quasars and local elliptical galaxies.
-
2.
Local radio galaxies are associated to structures which are about a factor of 10 more massive than those which host optically-selected quasars. They are also most likely fuelled by heavier BHs.
-
3.
In radio-active sources there does not seem to be any connection between radio luminosity and BH/halo mass.
-
4.
The clustering of radio sources is found to be weaker in the past. This implies radio-active objects to be hosted by halos with masses which decrease with look-back time at variance with the quasar case which requires const at all redshifts probed by available surveys. These two classes of objects seem to be associated to the same kind of structures only at z .
The above conclusions raise a number of issues that need to be addressed whenever investigating possible connections – both on large and on small scales – between radio sources and optically-selected AGNs such as quasars. In fact, these two classes of objects are found to reside in different structures, be fuelled by black holes of different masses and exhibit different cosmological evolutions, results which pose a serious challenge to all those models aiming at providing a unified picture for black hole-powered sources.
Acknowledgments
MM wishes to thank Cristiano Porciani, Mattia Negrello and Gianfranco De Zotti for their substantial contribution to the work presented in this conference.
References
References
- [1] Porciani C., Magliocchetti M, Norberg P., MNRAS 355, 1010 (2004).
- [2] Croom S.M., Smith R.J., Boyle B.J., Shanks T., Miller L., Outram P.J., Loaring N.S., MNRAS 349, 1397 (2004).
- [3] Magliocchetti M, Porciani C., MNRAS 346, 186 (2003).
- [4] Madgwick D.S., et al. (2dfGRS Team)3448472003
- [5] Magliocchetti M., et al. (2dFGRS Team), MNRAS 350, 1485 (2004).
- [6] Ferrarese L., ApJ 578, 90 (2002)
- [7] Metcalf R.B., Magliocchetti M., MNRAS 365, 101 (2006)
- [8] Blake C., Wall J.W., MNRAS 337, 993 (2002)
- [9] Dunlop J.S., Peacock J.A., MNRAS 247, 19 (1990)
- [10] Negrello M., Magliocchetti M., De Zotti G., MNRAS 368, 935 (2006).
- [11] Mo H.J., White S.D.M., MNRAS 282, 347 (1996)
- [12] Croom S.M., Boyle B.J., Shanks T., Smith R.J., Miller L., Outram P.J., Loaring N.S., Hoyle F., da ngela J., MNRAS 356, 415 (2005)
- [13] Grazian A., Negrello M. Moscardini L., Cristiani S., Haehnelt M.G., Matarrese S., Omizzolo A., Vanzella E., AJ 127, 592 (2004)