2 INAF-Osservatorio Astronomico di Bologna, Via Ranzani 1, 40127 Bologna, Italy
3 Dipartimento di Fisica, Università di Bologna, Via Berti-Pichat 6/2, 40127 Bologna, Italy
4 Dipartimento di Astronomia, Università di Bologna, Via Ranzani 1, 40127 Bologna, Italy
5 Max-Planck-Institut für Astrophysik, Karl-Schwarzschild-Str. 1 85748, Garching bei Muenchen, Germany
6 Shanghai Astronomical Observatory: the partner group of MPA, Nandan Road 80, Shanghai 200030, China
7 Department of Astrophysical Sciences, Princeton University, Peyton Hall, Ivy Lane, Princeton, NJ 08544, USA
8 INFN, Sezione di Bologna, viale Berti Pichat 6/2, 40127 Bologna, Italy
Arc sensitivity to cluster ellipticity, asymmetries and substructures
Abstract
Aims. We investigate how ellipticity, asymmetries and substructures separately affect the ability of galaxy clusters to produce strong lensing events, i.e. gravitational arcs, and how they influence the arc morphologies and fluxes. This is important for those studies aiming, for example, at constraining cosmological parameters from statistical lensing, or at determining the inner structure of galaxy clusters through gravitational arcs.
Methods. We do so by creating two-dimensional smoothed, differently elliptical and asymmetric versions of some numerical models. By subtracting these smoothed mass distributions from the corresponding numerical maps and by gradually smoothing the residuals before re-adding them to the clusters, we are able to see how the lensing properties of the clusters react to even small modification of the cluster morphology. We study in particular by how much ellipticity, asymmetries and substructures contribute to the strong lensing cross sections of clusters. We also investigate how cluster substructures affect the morphological properties of gravitational arcs, their positions and fluxes.
Results. On average, we find that the contributions of ellipticity, asymmetries and substructures amount to , and of the total strong lensing cross section, respectively. However, our analysis shows that substructures play a more important role in less elliptical and asymmetric clusters, even if located at large distances from the cluster centres (Mpc). Conversely, their effect is less important in highly asymmetric lenses. The morphology, position and flux of individual arcs are strongly affected by the presence of substructures in the clusters. Removing substructures on spatial scales kpc, roughly corresponding to mass scales , alters the image multiplicity of of the sources used in the simulations and causes position shifts larger than for of the arcs longer than .
Conclusions. We conclude that any model for cluster lens cannot neglect the effects of ellipticity, asymmetries and substructures. On the other hand, the high sensitivity of gravitational arcs to deviations from regular, smooth and symmetric mass distributions suggests that strong gravitational lensing is potentially a powerful tool to measure the level of substructures and asymmetries in clusters.
Key Words.:
gravitational lensing – galaxies: clusters, dark matter1 Introduction
Thanks to the improvements in the quality and in the depth of astronomical observations, in particular from space, an increasing number of gravitational arcs has recently been discovered near the centres of many galaxy clusters (see e.g. Broadhurst et al., 2005). Since the appearance of these images reflects the shape of the gravitational potential which is responsible for their large distortions, strong lensing is, in principle, a very powerful tool for investigating how the matter, in particular the dark component, is distributed in the inner regions of cluster lenses.
Determining the inner structure of galaxy clusters is one of the major goals in cosmology, because it should allow us to set important constraints on the growth of the cosmic structures in the Universe. Moreover, constraining the mass distribution in the centre of dark matter halos has become increasingly important in the recent years, since observations of the dynamics of stars in galaxy-sized systems revealed the presence of a potential problem within the Cold-Dark-Matter (CDM) scenario. While numerical simulations in this cosmological framework predict that dark matter halos in a large range of masses should develop density profiles characterised by an inner cusp, observations of the rotation curves of dwarf and low-surface-brightness galaxies suggest that these objects rather have flat density profiles (Flores & Primack, 1994; Moore, 1994; Burkert, 1995; Burkert & Silk, 1997; McGaugh & de Blok, 1998; Dalcanton & Bernstein, 2000; Firmani et al., 2001).
While the centres of galaxies are dominated by stars, which renders it extremely complicated to derive constraints on the distribution of their dark matter, galaxy clusters are an alternative and, in many respects, preferable class of objects for testing the predictions of the CDM model. In fact, several authors already tried to investigate the inner structure of these large systems, using and often combining several kinds of observations. Apart from lensing, the gravitational potential of galaxy clusters can be traced with several other methods, for example through the emission in the X-ray band by the hot intra-cluster gas. However, while gravitational lensing directly probes the matter content of these objects, the other techniques usually rely on some strong assumptions about their dynamical state and the interaction between their baryonic and dark matter. For example, it must be often assumed that the gas is in hydrostatic equilibrium within the dark matter potential well and that the system is spherically symmetric.
Some ambiguous results were found when comparing the constraints on the inner structure of clusters as obtained from X-ray and lensing observations. First, masses estimated from strong lensing are usually larger by a factor of 2-3 than the masses obtained from X-ray observations (Chen et al., 2003; Ota et al., 2004). Deviations from axial symmetry and substructures are known to be important factors in strong lensing mass estimates (see e.g. Bartelmann, 1995; Bartelmann & Steinmetz, 1996; Meneghetti et al., 2003b; Oguri et al., 2005; Gavazzi, 2005). Second, the constraints on the inner slope of the density profiles seem to be compatible with a wide range of inner slopes (Ettori et al., 2002; Lewis et al., 2003; Arabadjis et al., 2002; Sand et al., 2003; Bartelmann & Meneghetti, 2004; Gavazzi, 2005).
Apart from the above-mentioned uncertainties affecting the X-ray measurements, strong lensing observations also have several potential weaknesses. First of all, arcs are relatively rare events. Frequently, all the constraints which can be set on the inner structure of clusters via strong lensing depend on a single or on a small number of arcs and arclets observed near the cluster core. Second, arcs are the result of highly non-linear effects. This implies that their occurrence and their morphological properties are very sensitive to ellipticity, asymmetries and substructures of the cluster matter distribution.
Reversing the problem, this means that, in order to reliably describe the strong lensing properties of galaxy clusters, all of these effects must be taken into account. Fitting the positions and the morphology of gravitational arcs to derive the underlying mass distributions of the lensing clusters, usually requires to build models with multiple mass components, each of which is characterised by its ellipticity and orientation (see e.g. Kneib et al., 1993; Comerford et al., 2005; Broadhurst et al., 2005). Even describing the cluster lens population in a statistical way requires to use realistic cluster models (Meneghetti et al., 2000, 2003b, 2003a; Oguri, 2002; Oguri et al., 2003; Dalal et al., 2005; Hennawi et al., 2005).
Despite the fact that the importance of ellipticity, asymmetries and substructures for strong lensing appears clearly in many previous studies, many questions still remain. For example, what is the typical scale of substructures which contribute significantly to the strong lensing ability of a cluster? Where are they located within the clusters? What is the relative importance of asymmetries compared to ellipticity? Moreover, how do substructures influence the appearance of giant arcs? All of these open problems are important for those studies aiming at constraining cosmological parameters from statistical lensing, or at determining the inner structure of galaxy clusters through gravitational arcs.
This paper aims at answering to these questions. To do so, we quantify the impact of ellipticity, asymmetries and substructures by creating differently smoothed models of the projected mass distributions of some numerical clusters. We gradually move from one smoothed model to another through a sequence of intermediate steps.
The plan of the paper is as follows. In Sect. 2, we discuss the characteristics of the numerically simulated clusters that we use in this study; in Sect. 3, we explain how ray-tracing simulations are carried out; Sect. 4 illustrates how we obtain smoothed versions of the numerical clusters; in Sect. 5, we suggest a method to quantify the amount of substructures, asymmetry and ellipticity of the cluster lenses, based on multipole expansions of their surface density fields; Sect. 6 is dedicated to the discussion of the results of our analysis. Finally, we summarise our conclusions in Sect.7.
2 Numerical models
The cluster sample used in this paper is made of five massive dark matter halos. One of them, labelled , was simulated with very high mass resolution, but contains only dark-matter. The others, the clusters , , and have lower mass resolution but are obtained from hydro-dynamical simulations which also include gas.
The halos we use here are massive objects with masses (), (), () and ( and ) at . We have chosen this redshift because it is close to where the strong lensing efficiency of clusters is the largest for sources at (Li et al., 2005).
The clusters were extracted from a cosmological simulation with a box-size of of a flat CDM model with , , , and (see Yoshida et al. 2001). Using the “Zoomed Initial Conditions” (ZIC) technique (Tormen et al., 1997), they were re-simulated with higher mass and force resolution by populating their Lagrangian volumes in the initial domain with more particles, appropriately adding small-scale power. The initial displacements are generated using a “glass” distribution (White, 1996) for the Lagrangian particles. The re-simulations were carried out with the Tree-SPH code GADGET-2 (Springel et al., 2001; Springel, 2005). For the low resolution clusters, the simulations started with a gravitational softening length fixed at comoving (Plummer-equivalent) and switch to a physical softening length of at .
The particle masses are and for the dark matter and gas particles, respectively. For the high-resolution cluster the particle mass is and the softening was set to half of the value used for the low resolution runs. Its virial region at contains more than nine million particles, which allow us to well resolve substructures on scales down to those of galaxies. Despite the lower mass resolution with respect to , the other low resolution clusters also contain several million particles within their virial radii.
To introduce gas into the high-resolution regions of the low-resolution clusters, each particle in a control run containing only dark matter was split into a gas and a dark matter particle. These were displaced by half the original mean inter-particle distance, so that the centre-of-mass and the momentum were conserved.
Selection of the initial region was done with an iterative process involving several low-resolution, dissipation-less re-simulations to optimise the simulated volume. The iterative cleaning process ensures that all these haloes are free of contaminating boundary effects up to at least 3 to 5 times the virial radius.
The simulations including gas particles follow only the non radiative evolution of the intra-cluster medium. More sophisticated versions of these clusters, where radiative cooling, heating by a UV background, and a treatment of the star formation and feedback processes were included exist and their lensing properties have been studied in detail by Puchwein et al. (2005).
The cluster is in principle a higher-resolution, dark-matter only version of the cluster , which was simulated with non-radiative gas physics. Nevertheless the two objects can only be compared statistically. Indeed, the introduction of the gas component as well as the increment of the mass resolution introduce small perturbations to the initial conditions, which lead to slightly different time evolutions of the simulated halos. Furthermore, also the presence of gas and its drag due to pressure lead to significant changes in the assembly of the halo. A detailed discussion of such differences can be found in Puchwein et al. (2005). For this reason, the lensing properties of and at are not directly comparable.
3 Lensing simulations
Ray-tracing simulations are carried out using the technique described in detail in several earlier papers (e.g. Bartelmann et al. 1998; Meneghetti et al. 2000).
We select a cube of Mpc comoving side length, centred on the halo centre and containing the high-density region of the cluster. The particles in this cube are used for producing a three-dimensional density field, by interpolating their position on a grid of cells using the Triangular Shaped Cloud method (Hockney & Eastwood, 1988). Then, we project the three-dimensional density field along the coordinate axes, obtaining three surface density maps , used as lens planes in the following lensing simulations.
The lensing simulations are performed by tracing a bundle of light rays through a regular grid, covering the central sixteenth of the lens plane. This choice is driven by the necessity to study in detail the central region of the clusters, where critical curves form, taking into account the contribution from the surrounding mass distribution to the deflection angle of each ray.
Deflection angles on the ray grid are computed using the method described in Meneghetti et al. (2000). We first define a grid of “test” rays, for each of which the deflection angle is calculated by directly summing the contributions from all cells on the surface density map ,
| (1) |
where is the area of one pixel on the surface density map and and are the positions on the lens plane of the “test” ray () and of the surface density element (). Following Wambsganss et al. (1998), we avoid the divergence when the distance between a light ray and the density grid-point is zero by shifting the “test” ray grid by half-cells in both directions with respect to the grid on which the surface density is given. We then determine the deflection angle of each of the light rays by bi-cubic interpolation between the four nearest test rays.
The position of each ray on the source plane is calculated by applying the lens equation. If and are the angular positions of source and image from an arbitrarily defined optical axis passing through the observer and perpendicular to the lens and source planes, this is written as
| (2) |
where and are the angular diameter distances between the lens and the source planes and between the observer and the source plane, respectively.
Then, a large number of sources is distributed on the source plane. We place this plane at redshift . Keeping all sources at the same redshift is an approximation justified for the purposes of the present case study, but the recent detections of arcs in high-redshift clusters (Zaritsky & Gonzalez, 2003; Gladders et al., 2003) indicate that more realistic simulations will have to account for a wide source redshift distribution.
The sources are elliptical with axis ratios randomly drawn from . Their equivalent diameter (the diameter of the circle enclosing the same area of the source) is . They are distributed on a region on the source plane corresponding to one quarter of the field of view where rays are traced. As in our earlier studies, we adopt an adaptive refinement technique when placing sources on their plane. We first start with a coarse distribution of sources and then increase the source number density towards the high-magnification regions of the source plane by adding sources on sub-grids whose resolution is increased towards the lens caustics. This increases the probability of producing long arcs and thus the numerical efficiency of the method. In order to compensate for this artificial source-density enhancement, we assign a statistical weight to each image for the following statistical analysis which is proportional to the area of the sub-grid cell on which the source was placed.
By collecting rays whose positions on the source plane lie within any single source, we reconstruct the images of background galaxies and measure their length and width. Our technique for image detection and classification was described in detail by Bartelmann & Weiss (1994) and used by Meneghetti et al. (2000, 2001, 2003a, 2003b); Torri et al. (2004) and Meneghetti et al. (2005). The modifications recently suggested by Puchwein et al. (2005) for increasing the accuracy of the measurements of the arc properties have been included in our code. The simulation process ends in a catalogue of images which is subsequently analysed.
4 Smoothed representations of the cluster
We aim here at separating the effects of substructures, ellipticity and asymmetries on the strong lensing efficiency of our numerical clusters. We work in two dimensions, starting from the projected two-dimensional mass distribution of each lens. Since the lens’ surface density profile plays a crucial role for strong lensing, we keep it fixed and vary only the shape of the density contours.
As a first step, we construct a fiducial model for the smooth mass distribution of the lens. This is done by measuring the ellipticity and the position angle of the surface density contours as function of radius in the projected mass map. The projected density is measured in circles of increasing radii . We determine the quadrupole moments of the density distribution in each aperture,
| (3) |
where denotes the position of the cluster centre and the integrals are extended to the area enclosed by the aperture. Both the ellipticity and the position angle of the iso-density contour corresponding to the chosen aperture radius are derived from the elements of the tensor :
| (4) | |||||
| (5) |
The ellipticity and position angle profiles are used in combination with the mean surface density profile of the lens for constructing a smoothed surface density map,
| (6) |
where the equivalent radius is given by
| (7) | |||||
and (for ).
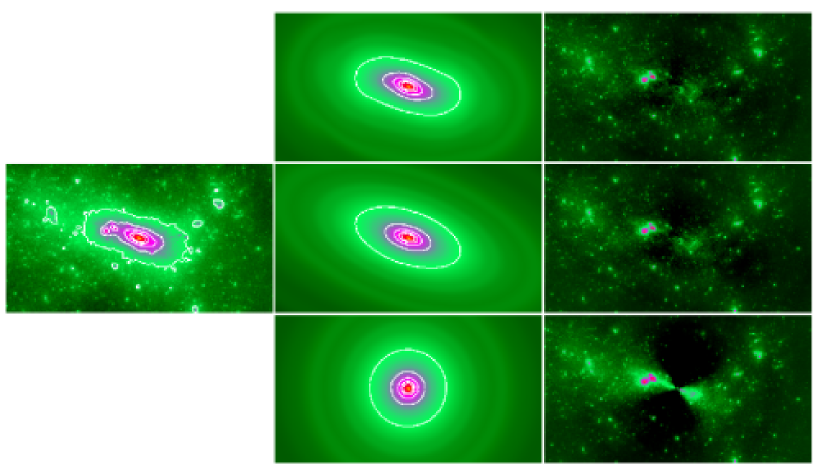
The resulting map conserves the mean surface density profile of the cluster and reproduces well the twist of its iso-density contours, i.e. the asymmetries of the projected mass distribution. This is shown in Fig. 1. The panel on the left column shows the original surface density map for one projection of the high-resolution cluster . Contour levels start at Mpc-2 and are spaced by Mpc-2. The top-middle panel shows the smoothed map obtained from Eq. (6). In the rest of the paper, we will call this smoothed model the “asymmetric” model. The same colour scale and spacing of the contour levels as in the first panel are used. In the smoothed map, the substructures on all scales are removed and redistributed in elliptical shells around the cluster. Comparing the strong lensing properties of the original and of the smoothed map, we can therefore quantify the net effect of substructures on the cluster strong lensing efficiency. By subtracting the smoothed from the original map, we obtain a residual map showing which substructures will not contribute to lensing after smoothing. We plot this residual map in the right panel in the upper row of Fig. 1.
Similarly, the effects of other cluster properties can be separated. For example, we can remove asymmetries and deviations from a purely elliptical projected mass distribution by disabling the twist of the iso-density contours in our smoothing procedure. For doing so, we fix the ellipticity and the position angle to a constant value, and . We choose and to be those measured in the smallest aperture containing the cluster critical curves. A smoothed map of the cluster is created as explained earlier. The results are shown in the middle panels of Fig. 1. A comparison of the lensing properties of this new “elliptical” model with those of the previously smoothed map allows us to quantify the effect of asymmetries, which are large-scale deviations from elliptical two-dimensional mass distributions.
Finally, even the cluster ellipticity can be removed, still preserving the same mean density profile. This is easily done by inserting in Eq. (6). The resulting smoothed map and the residuals obtained by subtracting it from the original projected mass map are shown in the bottom panels of Fig.1. If we compare the lensing efficiency of such an “axially symmetric” model to that of the previously defined elliptical model, we quantify the effect of ellipticity on the cluster strong lensing properties.
For each smoothing method, we simulate lensing of background galaxies not only for the extreme cases of the totally smoothed maps but also for partially smoothed mass distributions. Adding the residuals to the smoothed map, the original surface density map of the cluster is indeed re-obtained,
| (8) |
Substructures of different sizes can be gradually removed from the cluster mass distribution by filtering the residual map with some filter function of varying width before re-adding it to the totally smoothed map. This can be done, for example, by convolving the residual map with a Gaussian of width :
| (9) | |||||
| (10) |
The width defines the scale of the substructures which will be filtered out of the mass map. Surface density maps with intermediate levels of substructures are finally obtained by adding the filtered residuals to the smoothed map,
| (11) |
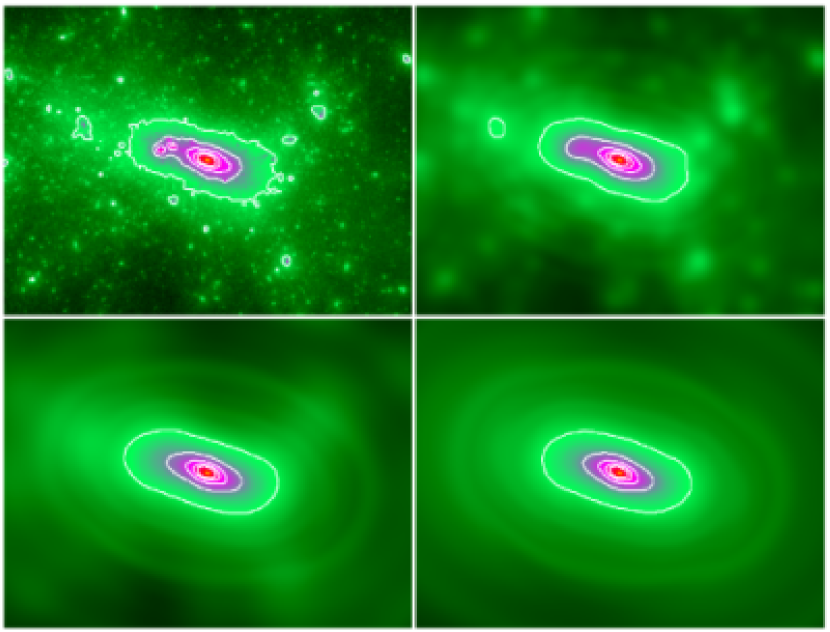
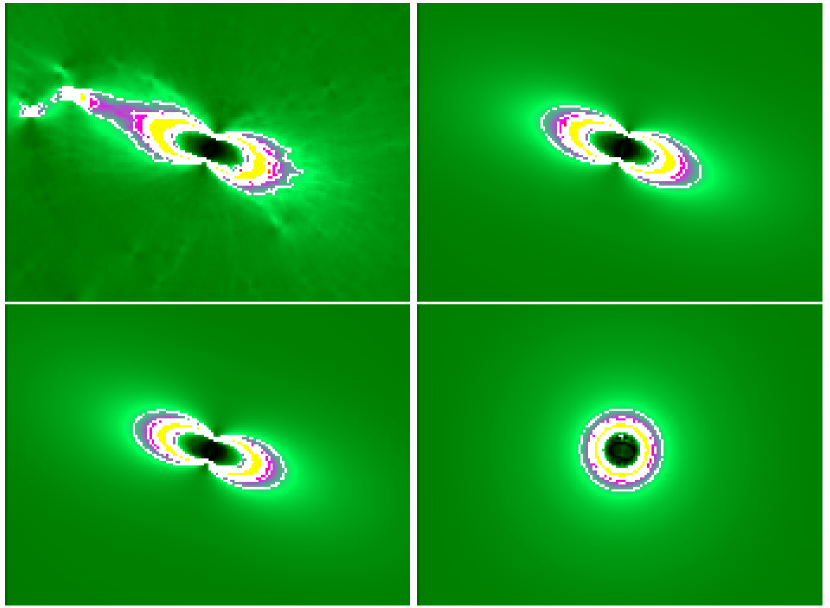
This procedure allows us to investigate what is the characteristic scale of substructures which are important for strong lensing. Moreover, comparing how the lensing properties of different clusters react to smoothing, we can quantify the impact of substructures in halos with different degrees of asymmetry and ellipticity. A sequence of smoothed versions of the same cluster model is shown in Fig 2. The smoothing length is and comoving kpc from the top left to the bottom right panel, respectively.
Another important issue is to understand where the substructures must be located in order to have a significant impact on the strong lensing properties of clusters. To address this problem, we remove from the clusters the substructures located outside apertures of decreasing equivalent radius . Again, this is done by modifying the residuals of the smoothed maps. We multiply the residual map with the function,
| (12) |
where kpc comoving and is the equivalent distance beyond which the substructures are suppressed. The Gaussian tail of the window function was applied to avoid sudden discontinuities in the surface density maps.
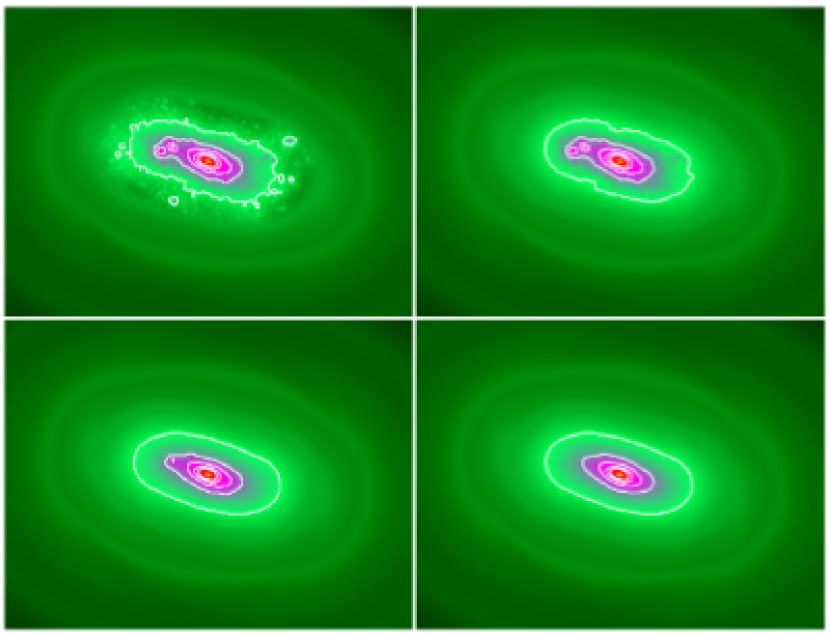
Results of the removal of cluster substructures at different radii are shown in Fig. 3. From the top left to the bottom right panel, the cut-off scales are and kpc comoving, respectively. The residual maps filtered with the window function (12) were re-added to the totally smoothed asymmetric maps for obtaining surface density distributions with the desired level of substructures within a given equivalent radius.
5 Quantifying the amount of substructures, asymmetry and ellipticity
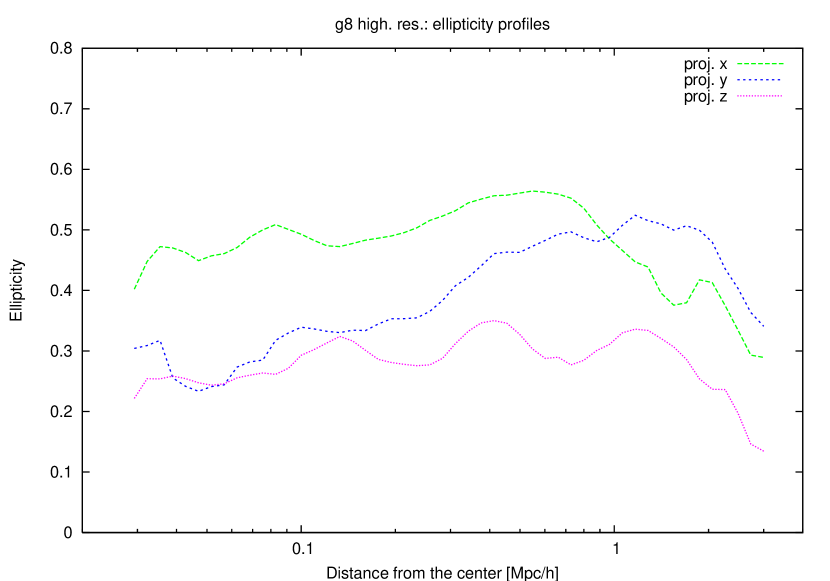
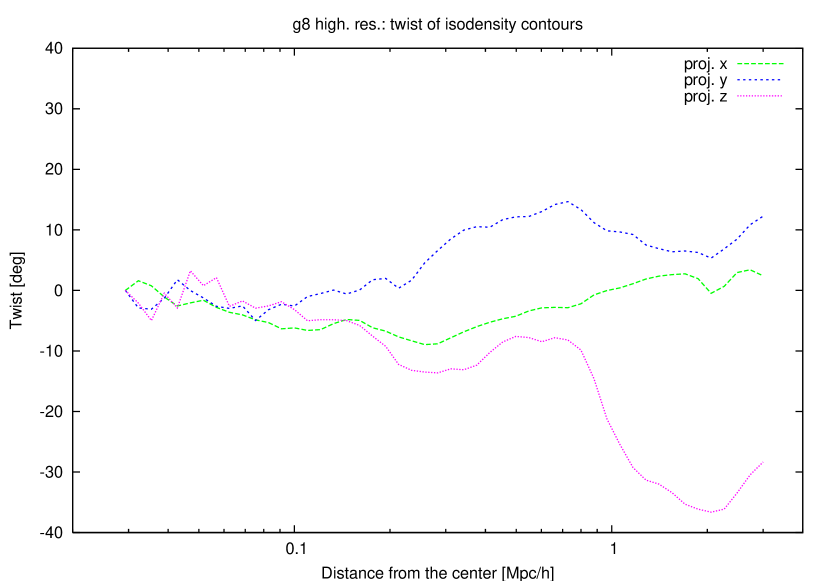
The variations of ellipticity and position angle of the iso-density contours are given by the functions and , which were defined in the previous section. These are shown for the three projections of cluster in Fig. 4. They illustrate that the projection along the -axis of this cluster, shown in Fig. 1, is the most elliptical at the relevant radii, with an ellipticity which grows from to within the inner Mpc. The iso-density contours have almost constant orientation in this projection. The projection along the -axis exhibits the largest variations of ellipticity in the central region of the cluster, with growing from to . It is also characterised by a large twist of the iso-density contours, whose orientations change by up to degrees. When projected along the -axis, the cluster appears more circular and with fairly constant ellipticity ranging between and . The twist of the iso-density contours is moderate within the inner Mpc.
We now quantify the amount of substructure within the numerical clusters by means of multipole expansions of their surface density maps (Meneghetti et al., 2003b).
Briefly, starting from the particle positions in the numerical simulations, we compute the surface density at discrete radii and position angles taken from and , respectively. For any , each discrete sample of data is expanded into a Fourier series in the position angle,
| (13) |
where the coefficients
| (14) |
can be computed using fast-Fourier techniques.
We define the power spectrum of the multipole expansion as . As discussed by Meneghetti et al. (2003b), the amount of substructure, asymmetry and ellipticity in the mass distributions of the numerically simulated cluster at any distance from the main clump can be quantified by defining an integrated power as the sum of the power spectra over all multipoles, from which the monopole is subtracted in order to remove the axially symmetric contribution,
| (15) |
This quantity measures the deviation from a circular distribution of the surface mass density at a given distance from the cluster centre.
In a fully analogous way, we can quantify the deviation from a purely elliptical surface mass density by subtracting from the quadrupole term :
| (16) |
Separating the effects of asymmetries and substructures by means of contributions to the multipoles is not an easy task. The two terms are mixed together in the multipole expansion. In this paper, asymmetries are assumed to be large-scale deviations from a purely elliptical mass distribution, which result in variations of ellipticity and position angle of the iso-density contours as functions of radius. Their contribution to the azimuthal multipole expansion is mostly contained in the low-l tail. On the other hand, for small even relatively small substructures subtend large angles with respect to the cluster centre. The dipole term itself contains a contribution from substructures. Assuming that substructures are localised lumps of matter whose angular extent is and then contribute to all multipoles of order larger than , we quantify the amount of substructures at radius in the cluster by means of the quantity
| (17) |
where the power corresponding to the dipole, has been subtracted from .
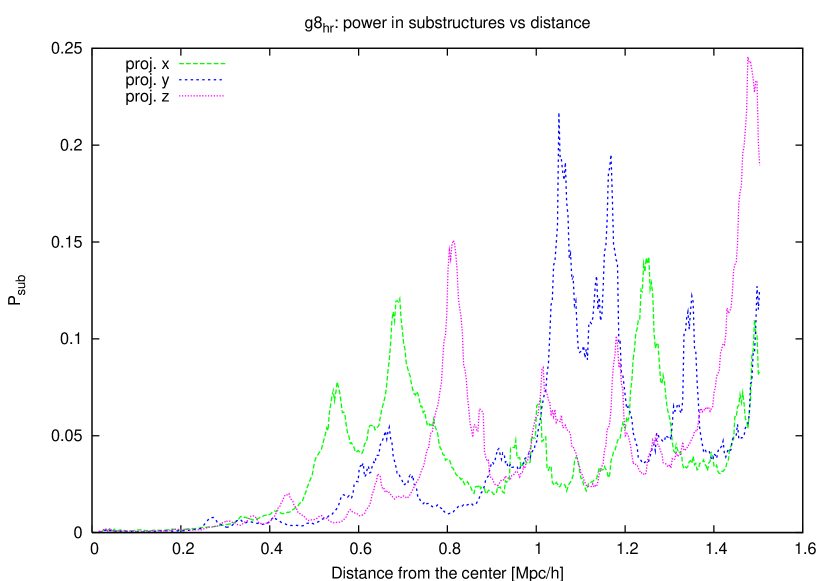
Fig.5 shows the radial profiles of for the three projections along the , and -axes of cluster . Peaks along the curves indicate the presence of substructures. The amplitude of the peaks is a growing function of the mass of the substructures. Clearly, in the projection along the -axis massive lumps of matter are located at distances of and kpc from the cluster centre. Substructures are abundant also at radii of and Mpc. This is visible in the left panel of Fig.1. Instead, the most dominant substructures in the projection along the -axis are located outside the region of radius Mpc. Only a relatively small peak is observed at kpc from the centre. Finally, when projected along the -axis, the cluster contains a large amount of substructures at the distance of kpc from the centre. Other peaks are located at radii Mpc.
6 Results
In this section, we describe the lensing properties of the numerical clusters in the sample we have analysed and quantify the impact of ellipticity, asymmetries and substructures on their ability to produce arcs.
6.1 Magnification and caustics
The lensing properties of the two-dimensional mass distributions generated using the previously explained methods can be easily determined using the standard ray-tracing technique described in Sect. 3.
The ability of galaxy clusters to produce strong lensing events is expected to reflect both the presence of substructures embedded into their halos and the degree of ellipticity and asymmetry of their mass distributions. Indeed, all of these factors contribute to increase the shear field of the clusters. This was shown for example by Torri et al. (2004) and later confirmed by Meneghetti et al. (2005) and Fedeli et al. (2005), who found that the passage of substructures through the cluster cores can enhance the lensing cross section for the formation of arcs with large length-to-width ratios by orders of magnitude. Meneghetti et al. (2003b) show that elliptical models with realistic density profiles produce a number of arcs larger by a factor of ten compared to axially-symmetric lenses with the same mass. Analogous results were obtained by Oguri et al. (2003), who compared the lensing efficiency of triaxial and spherically symmetric halos, and more recently by Hennawi et al. (2005).
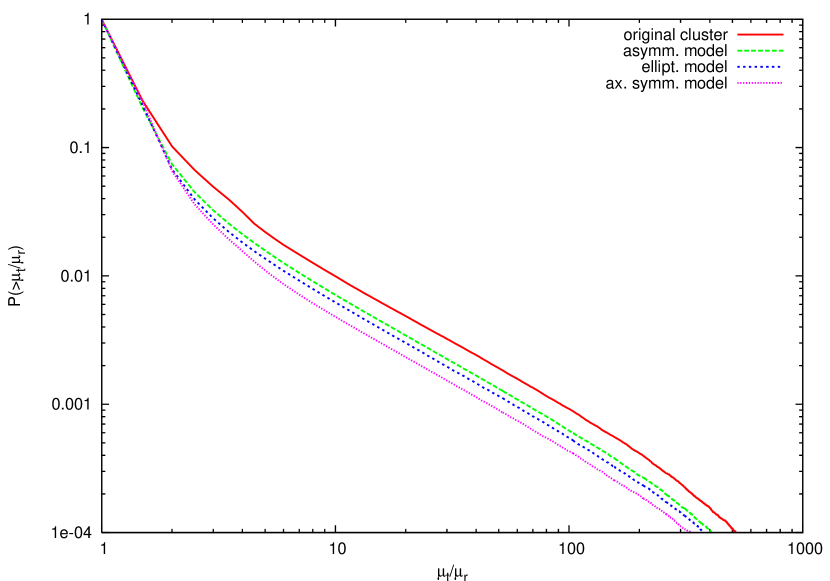
By smoothing the two-dimensional mass distribution of the clusters, both the levels of substructures and asymmetries are decreased. Thus, we expect their ability to produce highly distorted arcs to be somewhat reduced. This expectation is supported by the fact that the regions of the lens plane where the tangential-to-radial magnification ratio exceeds a given threshold shrink significantly when the smoothing is applied. This is shown in Fig. 6. The map of the tangential-to-radial magnification ratio of the original cluster (top right panel) is compared to those obtained by smoothing its surface density map using the asymmetric (top left panel), the elliptical (bottom left panel) and the axially symmetric (bottom right panel) background models. The cumulative distributions of the pixel values in these maps are displayed in Fig.7. The probability of having pixels where the tangential-to-radial magnification ratio exceeds the minimal value decreases at least by a factor of two, due to removal of substructures, asymmetries and ellipticity. This does not imply that the cross section for arcs with large length-to-width ratio decreases by the same amount, since the excess of pixels with large tangential-to-radial magnification ratio in the unsmoothed map is in part due to isolated lumps of matter whose angular scale is similar or smaller than the angular scale of the sources.
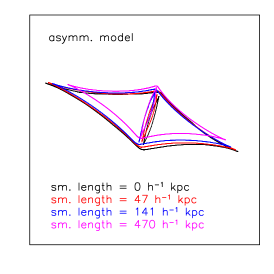
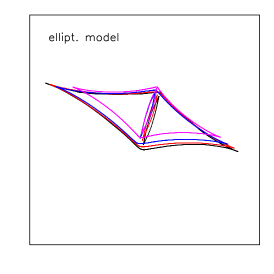
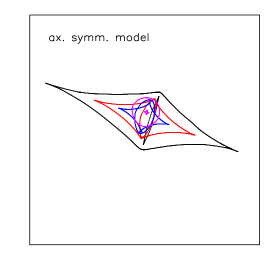
By definition, the lensing cross section, which measures a cluster’s ability to produce arcs, is an area encompassing the lens’ caustics. Thus, the more extended the caustics are, the larger is generally the lensing cross section. In Fig. 8 we show how the caustic shape changes as the smoothing length is varied. Results are shown for each of the smoothing schemes applied. As expected, the caustics shrink as the smoothing length increases. Comparable trends are found for the asymmetric and elliptical background models, for which the change of the caustic length is not dramatic. On the other hand, if the cluster surface density is gradually smoothed towards an axially symmetric distribution, the evolution of the lens’ caustics is much stronger.
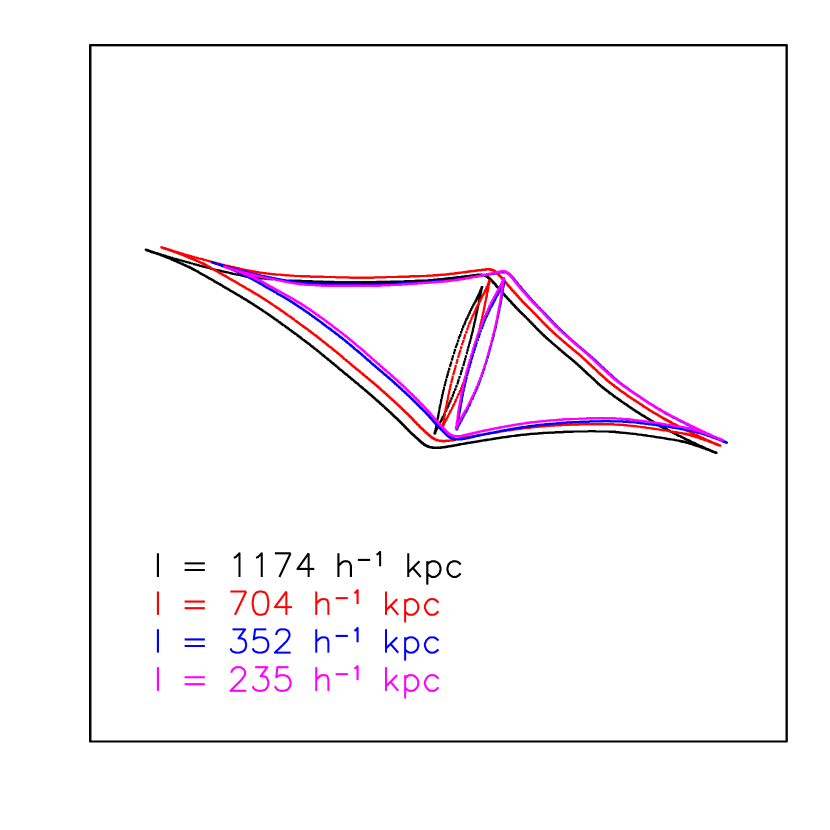
Similar reductions of the caustic sizes are found when suppressing the substructures outside a given radius. This is shown in Fig. 9. Clearly, substructures at distances of the order of Mpc already play a significant role for strong lensing. Although they are located far away from the cluster critical region, the external shear they produce is remarkable and determines an expansion of the lens’ caustics.
6.2 Lensing cross sections
Aiming at quantifying the differences between the strong-lensing efficiency of clusters with different amounts of ellipticity, asymmetries and substructures, we focus on the statistical distributions of the arc length-to-width ratios. Indeed, the distortion of the images of background galaxies lensed by foreground clusters is commonly expressed in terms of these ratios.
The efficiency of a galaxy cluster for producing arcs with a given property can be quantified by means of its lensing cross section. This is the area on the source plane where a source must be placed in order to be imaged as an arc with that property.
The lensing cross sections for large and thin arcs are computed as described in detail in several previous papers (Meneghetti et al., 2005, see e.g). We consider here the cross sections for arcs whose length-to-width ratio exceeds a threshold , and refer to these arcs as giant arcs.
6.2.1 A particular case: the cluster
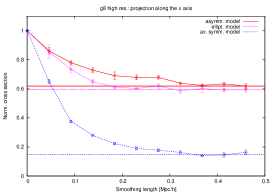
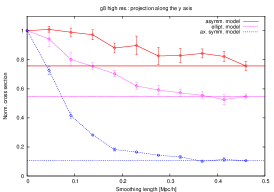
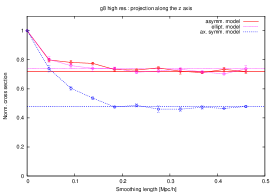
The impact of ellipticity, asymmetry and substructures on the lensing cross section for giant arcs obviously depends on the particular projected mass distribution of the lens. Large differences can be found even between different projections of the same cluster. As an example, we show in Fig. 10 the lensing cross sections for giant arcs as a function of the smoothing length for the three projections of cluster . Results are shown for all the smoothing methods described earlier. The cross sections have been normalised to that of the unsmoothed lens. The horizontal lines in each plot indicate the limiting values reached when the surface density maps are completely smoothed. Three different realizations of background source distributions were used to calculate the errorbars.
As expected, the lensing cross sections decrease as the smoothing scale increases. The decrement is generally rapid for small smoothing lengths, then becomes shallower.
The differences between the three projections are large. When smoothing with an elliptical background model, maximal variations of the cross section of the order of are found for the projections along the - and -axes. For these two projections, circularising the surface-mass distributions reduces the cross section by . However, while for the projection along the -axis smoothing using the asymmetric background model reduces the lensing cross section by , for the projection along the -axis the cross section becomes only smaller. The differences between these two projections can be explained as follows. First, as discussed earlier in the paper, when projected along the -axis, the cluster has important substructures close to its centre. This is evident in Fig. 5: substructures are significant at radii between kpc. On the other hand, when projected along the -axis the cluster exhibits significant substructures only at larger radii, Mpc. Since strong lensing occurs in the very inner region of the cluster, the impact of substructures close to the centre is larger than that of substructures farther away. Second, in the projection along the -axis, the twist of the iso-density contours and the variations of their ellipticity are significantly larger than for the projection along the -axis (see Fig.4). Therefore, while for the projection along the -axis the deviation from a purely elliptical mass distribution is mostly due to the effects of substructures, in the projection along the -axis it is due to both substructures () and asymmetries (). Asymmetries which are due to the presence of large-scale density fluctuations distort the isodensity contours which are elongated in some particular direction, varying their ellipticity and position angle. Such large-scale modes contribute to the shear field of the cluster, pushing the critical lines towards regions of lower surface density and increasing their size. Consequently, the strong lensing cross section also increases.
As shown in Sect. 5, when projected along the -axis, the cluster appears rounder. Consequently, a smooth axially symmetric representation of this lens which conserves its surface density profile has a lensing cross section for giant arcs which is only smaller than that of the original cluster. Smoothing using the asymmetric or the elliptical background models is equivalent and leads to a reduction of the lensing cross section by . The absence of significant differences between these two smoothing schemes indicates that asymmetries play little role in this projection, while the large substructure observed at kpc from the centre has a significant impact on the lensing properties of this lens, even being at relatively large distance from the region where strong lensing occurs.
The smoothing length for which the curves converge to the values for the completely smoothed maps tell us the characteristic scale of cluster substructures which is important for lensing. In those projections where localised substructures play an important role, i.e. in the projections along the - and the -axes, the relevant scales are smaller (kpc), while for the projection where asymmetries are more relevant they are larger (kpc). Converting these spatial scales into the corresponding mass scales in not an easy task, especially because we are dealing with substructures in two dimensions. Tentatively, we can assume that the substructures are spherical and their mean density corresponds to the virial overdensity . For , in the cosmological framework where our simulations are carried out, . Then, the above mentioned spatial scales correspond to masses between and .
The three cluster projections whose lensing properties were discussed above were carried out along the three orthogonal axes of the simulation box. In general, these axes do not coincide with the cluster’s principal axes because it is randomly oriented with respect to the simulation box. Thus, the roundest and the most elliptical cluster projections that we have studied are not necessarily the roundest and the most elliptical possible projections, respectively. In the case of , however, the principal axes do not differ substantially from those of the simulation box. The cluster turns out to be prolate with axis ratios and . When projected along the major principal axis, i.e. in its roundest projection, the ellipticity in the central region is slightly smaller than in the projection along the -axis, varying between and . When projected along the two other principal axes, the cluster has ellipticity and twist profiles very similar to those for the projections along the - and the -axes. For these reasons, the differences between the strong lensing cross sections of the purely elliptical and of the axially-symmetric smoothed models are modest in the roundest projection, even smaller than for the previously discussed projection along the -axis. Indeed, we find that the ellipticity accounts for only of the lensing cross section in this case. When projected along the other two principal axes, the impact of the ellipticity is similar to that for the projections along the - and -axes.
6.2.2 Mean lensing cross sections
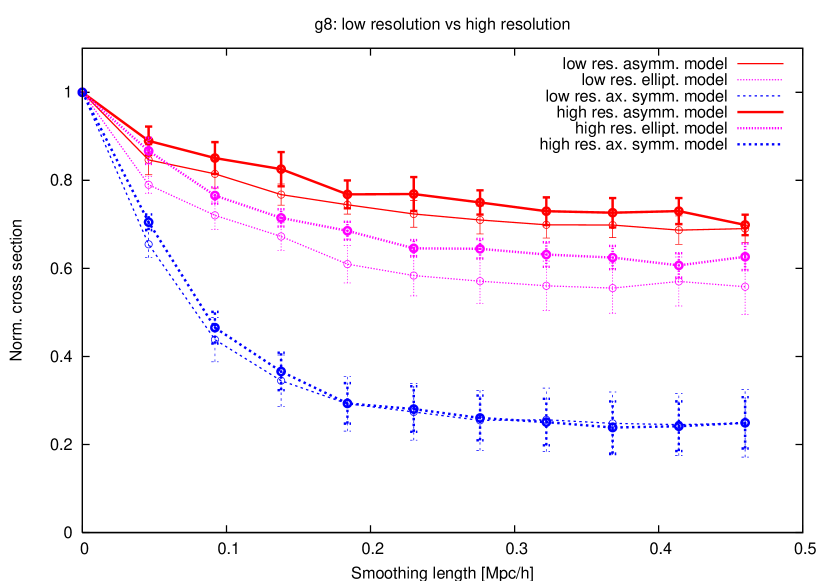
The example of cluster shows that, depending on the particular configuration of a lens, the impact of ellipticity, asymmetry and substructures can be substantially different in different clusters. Nevertheless, we can try to estimate what is the statistical impact of all these factors. For doing that, we repeat the analysis shown for the cluster on our sample of clusters simulated with lower mass resolution. Among them, we analyse the lensing properties of the low-resolution analogue of cluster . When we compare the sensitivity to smoothing of the low- and the high-resolution versions of the same cluster, we do not find significant differences between them. Fig. 11 shows how the lensing cross section for giant arcs changes as a function of the smoothing length for all three smoothing schemes applied. Each curve is the average over the three independent projections of the clusters. The thick and thin lines refer to the high- and low-resolution runs, respectively. Considering that, as discussed in Sect. 2, the two simulations have quite different mass distributions, the differences shown here, which are still within the error bars, have little significance. This suggests that our results are not affected by problems of mass resolution of the numerical simulations.
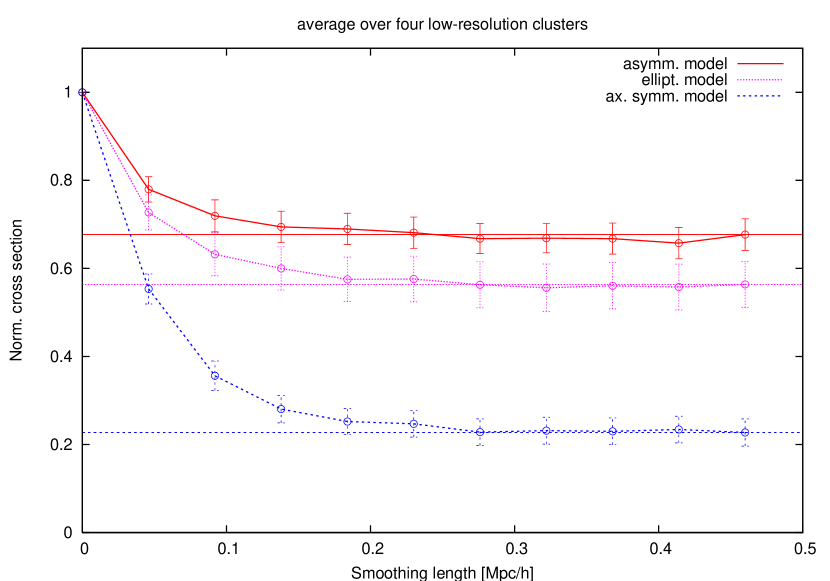
In Fig. 12 we show the variation of the lensing cross section vs. smoothing length averaged over all the low-resolution clusters which we have analysed. For each cluster, we use the three projections along the , and axes, i.e. 12 lens planes in total. The results are shown for all three smoothing schemes adopted. The curves show that on average removing the substructures from the clusters reduces their lensing cross section by about . Removing asymmetries, i.e. transforming the cluster mass distributions to purely elliptical, further reduces the lensing cross section for giant arcs by . If also ellipticity is removed, the mean lensing cross section becomes of that of the unsmoothed lenses. The typical scales for the substructures which mostly affect the lensing properties of their host halos are kpc (). Note that this does not mean that larger substructures do not affect the lensing cross sections: simply, they are less abundant. We verified that only one of the clusters in our sample () is undergoing a major merger with a massive substructure () at . Note also that the largest scale sub-halos contribute also to the asymmetry of the projected mass distributions. This means that smoothing further using the asymmetric background model does not remove these large substructures completely. When smoothing using the background elliptical and axially-symmetric models the smoothing length at which the lensing cross section approximates that of the completely smoothed lenses is slightly larger, because larger-scale contributions to the surface density fields must be removed.
6.2.3 Location of important substructures
We now investigate what is the typical location of substructures which are important for lensing. By ray-tracing through the mass distributions obtained after removing substructures from outside a given equivalent radius, as discussed at the end of Sect.4, we find that the strong lensing efficiency of clusters is sensitive to substructures located within a quite large region around the cluster centre. For demonstrating this, we show in Fig. 13 how the lensing cross section changes as a function of the minimal radius containing substructures. The cross sections are again normalised to those of the unsmoothed lenses.
In the projection along the -axis of cluster (short dashed line), we note that the lensing cross section decreases quickly when removing substructures outside an equivalent radius of Mpc. The lensing cross section for giant arcs is already reduced by when the minimal equivalent radius containing substructures is kpc. In fact, in this projection there are two large substructures at distances between and Mpc from the cluster centre, which seem to influence the strong lensing efficiency of this lens. Note that the critical lines in this projection of the cluster extend up to kpc from the cluster centre. In the other two projections of the same cluster (long dashed and dotted lines), where large substructures are located closer to the centre, a similar decrement of the lensing cross section is observed at much smaller equivalent radii, between and kpc.
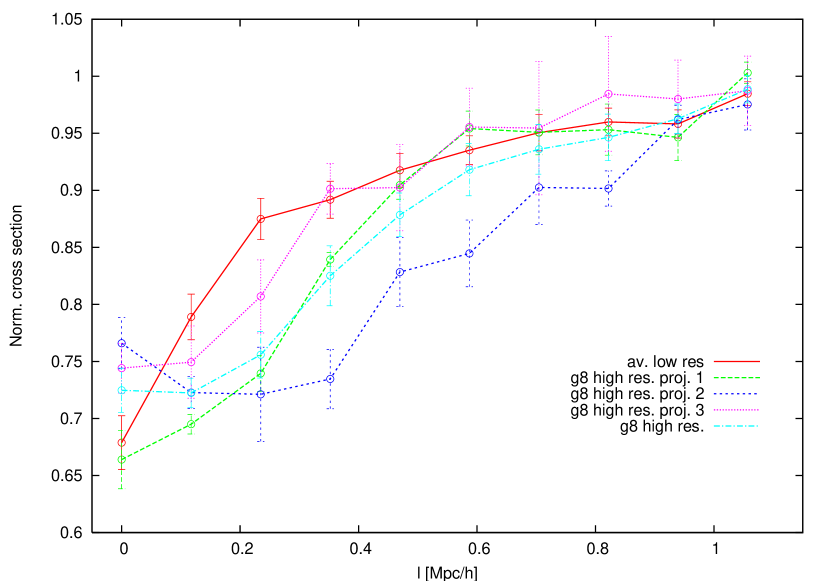
When averaging over the low-resolution cluster sample, we still find that the lensing cross sections start to decrease when substructures outside a region of equivalent radius Mpc are removed from the clusters. While the minimal radius containing substructures is further reduced, the cross sections continue to become smaller. The evolution is initially shallow. A reduction of is observed at a minimal equivalent radius kpc. If substructures are removed from an even smaller region around the centre of the clusters, the decrement of the lensing cross sections becomes faster. The critical regions of the lenses in our sample have maximal radii in the range kpc.
This shows that substructures close to the cluster centre are the most relevant for strong lensing, but substructures located far away from the cluster critical region for lensing also have a significant impact on the cluster lensing cross sections.
6.3 Arc shapes, locations and fluxes
Small changes in the positions of the caustics and therefore in the positions of the critical lines can have huge consequences on the appearance and location of gravitational arcs. In order to describe these effects we compare here the characteristics of the images of the same population of background sources lensed both with the unsmoothed projected mass distributions of the numerical clusters and with weakly smoothed versions of them. We smooth using the asymmetric model and using a smoothing length of kpc (), not significantly exceeding the scale of galaxies in clusters. The aim of this discussion is to show that even relatively small substructures may play a crucial role in determining the appearance of gravitational arcs.
Sources are first distributed around the caustics of the unsmoothed lens following the method discussed in Sect. 3. Then, the same sources are used when ray-tracing through the surface density maps from which substructures are removed. Each source conserves its position, luminosity, ellipticity and orientation, allowing to directly measure the effects that removing substructures and asymmetries has on several properties of the same arcs. For this experiment, we use an extended version of our ray-tracing code which includes several observational effects, like sky brightness and photon noise, allowing to mimic observations in several photometric bands. We assume that the sources have exponential luminosity profiles and shine with a luminosity in the -band . We simulate exposures of ksec with a telescope with diameter of m (VLT-like). The throughput of the telescope has been assumed to be . The surface brightness of the sky in the -band has been fixed at mag per square arcsec. In this ideal situation, no seeing is simulated. The effects of all these observational effects on the morphological properties of arcs will be discussed in a forthcoming paper.
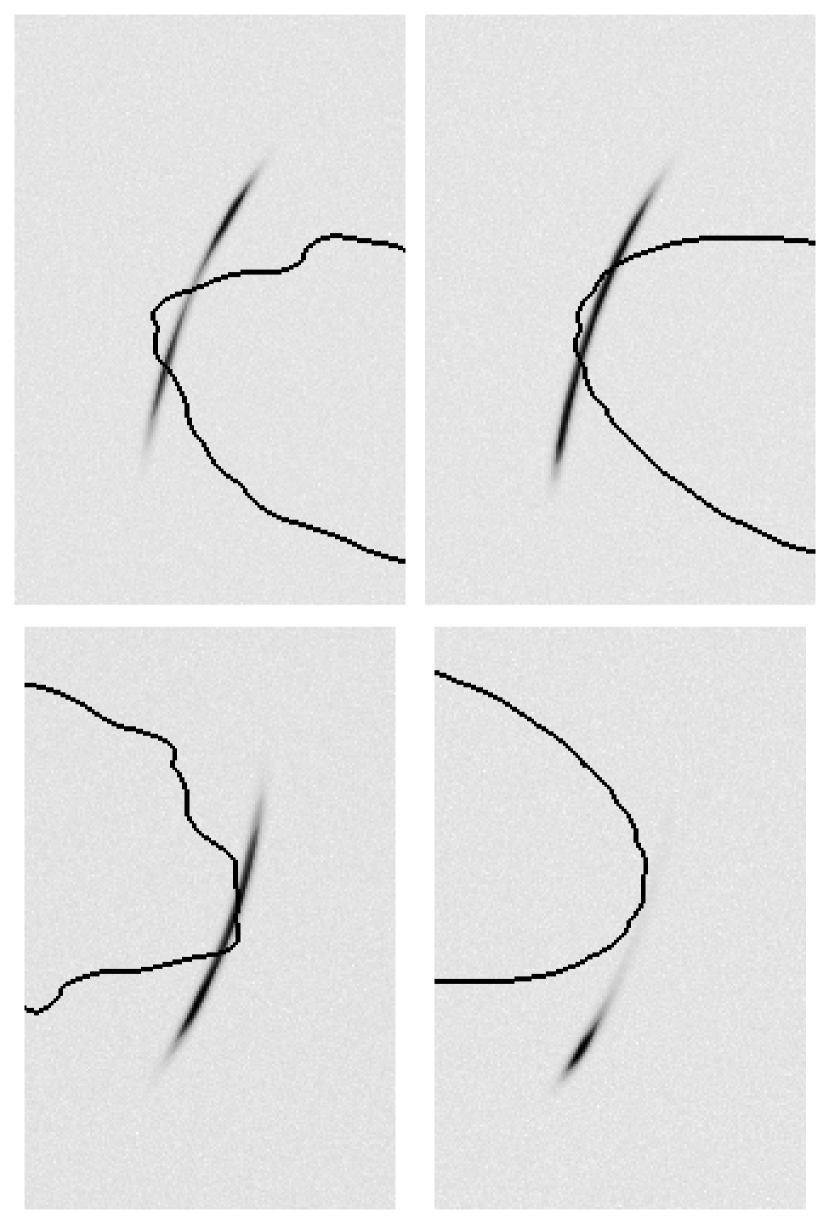
In earlier studies, Meneghetti et al. (2000) and Flores et al. (2000) showed that the impact of galaxy-sized cluster subhalos on the statistical properties of gravitational arcs with large length-to-width ratios is very modest. These results are confirmed in the present study. As shown in the previous section, the lensing cross sections for long and thin arcs decrease by when smoothing the cluster surface densities on scales kpc. On smaller scales the decrement is only of a few percent. However, the morphology of individual arcs is strongly affected in several cases. Arcs can become longer or shorter, thinner or thicker. In other cases, more dramatic morphological changes are found. For example, cluster galaxies locally perturb the cluster potential such as to break long arcs, while in other cases the opposite effect occurs. Two examples are shown in Fig.14. In the upper panels, the same source is imaged as two short arcs or as a single long arc when the unsmoothed (left panel) and the smoothed lens (right panel) are used, respectively. The lenses displayed in the top panels of Fig. 2 have been used for these simulations. In the bottom panels, a single long arc becomes a smaller arclet in absence of substructures. Super-imposed on each graph are the critical lines. They tend to wiggle around individual substructures in the left panels, while they are more regular in the right panels. Substructures slightly shift the high-magnification regions of a cluster relative to the background sources, inducing remarkable changes in the shape of their images and in their multiplicity. For the cluster projection used in this example, the image multiplicity is increased for of the sources producing arcs longer than , when smoothing is applied, indicating that long arcs break up. On the other hand, for of them the image multiplicity decreases, showing that the caustics shrink and sources move outside of them, Consequently the number of their images decreases.
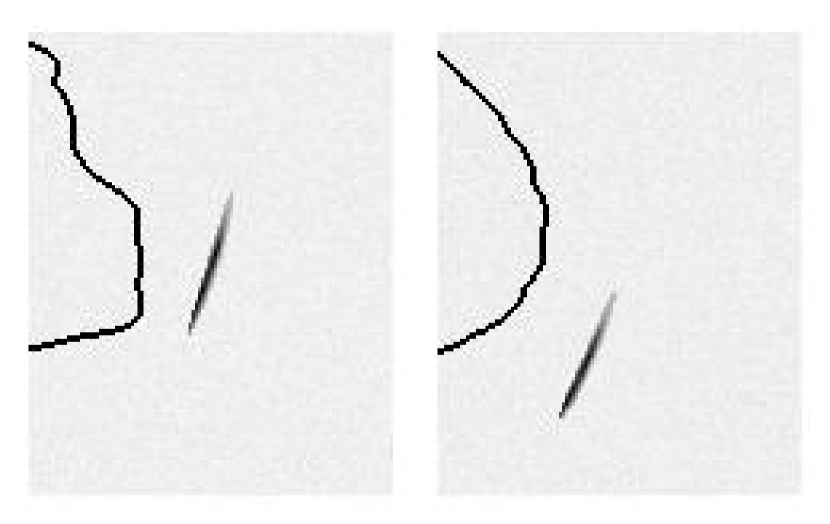
In several cases, substructures are also responsible for significant shifts of the positions of gravitational arcs. An example is shown in Fig. 15. The size of each frame is . The morphological properties of the arc in the two simulations are almost identical. The arc length is , the arc width is . The luminosity peak of the arc, which we use for measuring the shift, is moved towards the bottom left corner of the frame by , when substructures on scales smaller than kpc are smoothed away. Similar cases are frequent. For the lens used in this example, of the long arcs (length ) found in the simulation including substructures are shifted by more than after smoothing. About of them is shifted by more than . From this analysis, long arcs which split into smaller arclets are excluded.
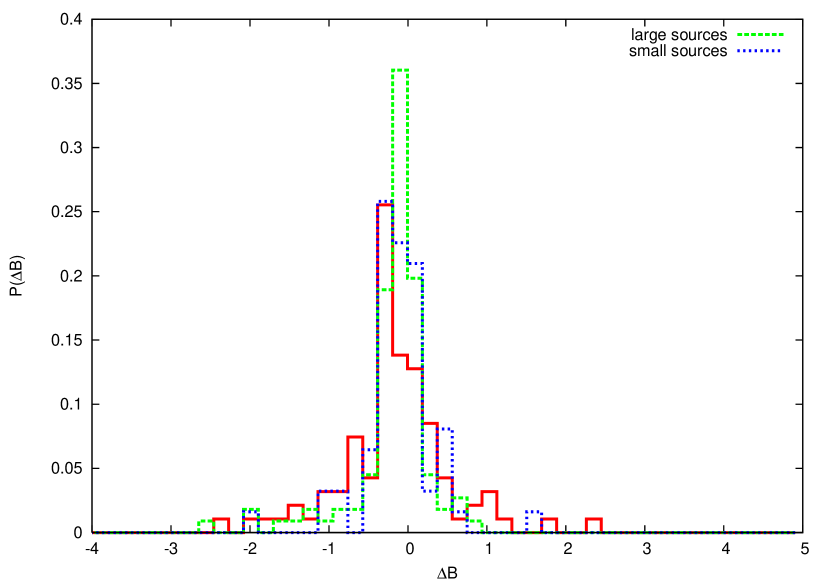
Finally, substructures affect the fluxes received from the lensed sources. The histogram in Fig. 16 (solid line) shows the probability distribution function of the differences between magnitudes of arcs with length measured in the simulations where the unsmoothed and smoothed lens projected mass maps were used as lens planes, respectively. The analysis is restricted to arcs whose length exceeds in the simulation containing all substructures. Some arcs are magnified, some others demagnified by the substructures. The maximal variations in luminosity correspond to . The distribution is slightly skewed towards the negative values, indicating that in absence of substructures arcs tend to be less luminous. In fact, substructures contribute to magnify the sources, as discussed in Sect. 6.1.
Sources of different size are expected to be differently susceptible to the substructures. The dashed and the dotted lines in Fig. 16 respectively show how the probability distribution function of changes when the source size is increased or decreased by a factor of two compared to the original source size used in the simulations. As expected, larger sources are less sensitive to perturbations by small substructures in the lenses.
Similar results were found for some other cluster models. For other lenses, the impact of the substructures on the properties of individual arcs is even stronger.
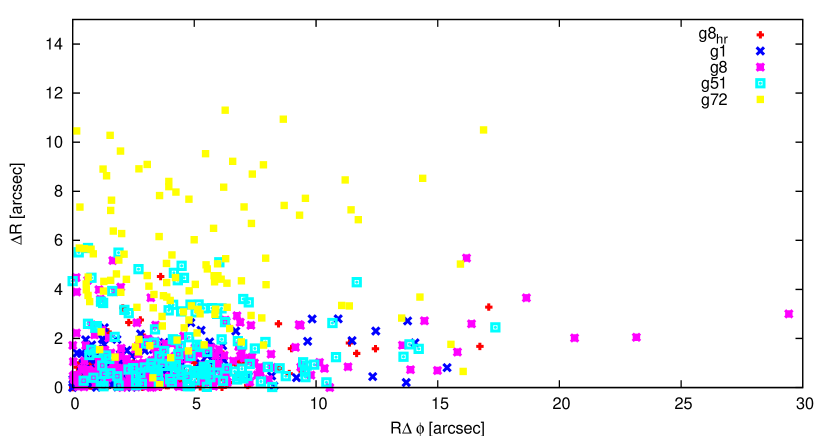
The observed arc shifts have tangential and radial components. Generally, the tangential shifts are larger than the radial shifts. However, when large substructures located close to the critical regions of clusters are smoothed away, significant radial shifts are possible, given that the relative size of the critical lines changes dramatically. In Fig. 17, the radial shifts of long arcs (length ) is plotted versus the tangential shifts. Different symbols are used to identify arcs produced by different numerical clusters. As anticipated, for the majority of the arcs produced by the clusters , , and the radial shifts are within few arcseconds, while tangential shifts of and more are frequent. On the other hand, the arcs produced by the cluster have significantly larger radial shifts. As mentioned above, is undergoing a major merger and a secondary lump of matter occurs near the cluster centre. The cluster critical lines, along which arcs form, are elongated towards it. When moderate smoothing is applied, the impact of the merging substructure is attenuated and the critical line shrinks substantially. Thus, the arcs move towards the centre of the cluster and their morphology and flux are also strongly affected.
Some results for all the cluster models we analysed are summarised in Tab.1. All of these effects might have an enormous impact in lensing analysis of clusters, in particular when modelling a lens by fitting gravitational arcs. These results show that any substructure on scales comparable to those of galaxies should be included in the model in order to avoid systematic errors. This problem will be addressed in detail in a following paper, in particular regarding the possible biases in strong lensing mass determinations. However, by making the wrong assumption of axial symmetry, we can approximately estimate the errors due to the radial shifts of the arcs. For axially symmetric lenses, the mean convergence within the critical line is . The mass within is then
| (18) |
where
| (19) |
is the critical surface mass density and is in physical units. We assume that the position of an arc traces the position of the critical line. Then, if an arc distance from the centre changes from to , the relative variation of the mass inferred from strong lensing is
| (20) |
The distribution of such , as derived from the radial shifts displayed in Fig.17, is shown in Fig. 18. Without suitably modelling the effects of substructures, the typical errors in mass determinations are within a factor of two, but larger errors are also possible. Since substructures generally contribute to enlarge the critical lines, a larger mass within the critical line would be required in order to have an arc at the observed distance from the cluster centre.

Note that even substructures far away from the cluster centre are important. For example, keeping the inner structure of the projection along the -axis of cluster unchanged, while removing the big substructures at distances Mpc, we find that more than of the long arcs are shifted by at least . Moreover, image multiplicity increases for and decreases for of the sources respectively.
| Cluster | proj. | inc. mult. | dec. mult. | shift | |
| [] | [] | [] | |||
| x | 21.2 | 9.8 | 26.6 | -2.3/+2.4 | |
| y | 19.7 | 3.9 | 11.1 | -1.7/+0.8 | |
| z | 23.7 | 10.1 | 15.5 | -2.5/+1.6 | |
| x | 47.0 | 1.0 | 24.0 | -1.9/+1.1 | |
| y | 26.1 | 0.0 | 20.0 | -1.7/+0.7 | |
| z | 24.5 | 0.0 | 29.5 | -2.5/+0.8 | |
| x | 24.0 | 4.0 | 27.0 | -1.7/+1.0 | |
| y | 35.4 | 9.5 | 51.1 | -2.1/+2.1 | |
| z | 31.2 | 6.1 | 28.2 | -2.5/+0.5 | |
| x | 33.1 | 6.2 | 44.7 | -2.3/+1.7 | |
| y | 35.6 | 5.1 | 65.7 | -2.5/+1.3 | |
| z | 39.1 | 6.2 | 54.3 | -1.5/+1.3 | |
| x | 36.0 | 4.0 | 79.4 | -2.5/+2.1 | |
| y | 62.5 | 0.0 | 57.1 | -2.4/+0.0 | |
| z | 22.5 | 0.0 | 70.9 | -2.4/+1.7 | |
| mean | 32.1 | 4.4 | 40.3 | -2.1/+1.3 |
If relatively small substructures can alter many of the properties of gravitational arcs, even asymmetries may be relevant. As noted earlier the projection along the -axis is the most asymmetric of . Comparing the properties of arcs lensed by the smoothed asymmetric and elliptical models of this lens, we find significant shifts in the location of about of the long arcs. For of the sources producing long arcs, the multiplicity is changed.
7 Conclusions
In this paper we have quantified the impact of several properties of realistic cluster lenses on their strong lensing ability. In particular, our goal was to separate the effects of substructures, asymmetries and ellipticity. For doing that, we analysed the lensing properties of one numerical cluster simulated with very high mass resolution. In addition, we studied four other clusters obtained from N-body simulation with a lower mass resolution.
Each cluster was projected along three independent directions. For each projection, we constructed three completely smoothed versions. Each of them conserves the mean surface density profile of the mass distribution of the cluster. However, the first reproduces the variations of the ellipticity and of the position angle of the isodensity contours as functions of the distance from the centre; the second has elliptical isodensity contours with fixed ellipticity and orientation; the third is an axially symmetric model.
The lensing properties of the numerical clusters, of their smoothed analogues and of several intermediate versions were investigated using standard ray-tracing techniques.
Our main results can be summarised as follows:
-
•
Substructures, asymmetries and ellipticity contribute to increase the ability of clusters to produce strong lensing events. Substructured, asymmetric and highly elliptical clusters produce more extended high magnification regions in the lens plane where long and thin arcs can form. Indeed, substructures, asymmetries and ellipticity determine the location and the shape of the lens caustics around which sources must be located in order to be strongly lensed by the clusters.
-
•
The impact of substructures, asymmetries and ellipticity on the lensing cross section for producing giant arcs is different for different lenses. The lensing properties of the most symmetric clusters appear to be particularly influenced by the substructures. On the contrary, substructures are less important in asymmetric lenses.
-
•
On average, we quantify that substructures account for of the total cluster cross section, asymmetries for and ellipticity for .
-
•
The substructures that typically contribute to lensing are on scales kpc. Assuming a virial overdensity of for , this corresponds to mass scales of the order of . Substructures on larger scales are not as frequent in our cluster sample, but, if present, they can boost significantly the lensing cross section (see e.g. Torri et al., 2004; Meneghetti et al., 2005).
-
•
Substructures play a more important role when they are located close to the cluster centre. However, the lensing cross section for giant arcs is sensitive to substructures within a wide region around the cluster core. In particular, our simulations show that the sensitivity to substructures far from the centre is particularly high in those clusters whose inner regions are unperturbed. In these cases, the loss of strong lensing efficiency due to removing the substructures from the clusters is correlated with substructures within a region of Mpc in radius; on the contrary, clusters containing substructures in the inner regions are “screened” against external perturbers.
-
•
Even small substructures (kpc, ) influence the appearance and the location of gravitational arcs. The perturbations to the projected gravitational potential of the cluster induced by the substructures alter the multiplicity of the images of individual sources. Moreover, they change the morphology and the flux of the images themselves. Finally, they can shift the position of arcs with significant length to width ratios by several arcseconds on the sky.
These results highlight several important aspects of strong lensing by clusters. First, any model for cluster lenses cannot neglect the effects of asymmetries, ellipticity and substructures. Clusters which may appear as relaxed and symmetric, for example in the X-rays, are potentially those which are most sensitive to the smallest substructures, located even at large distances from the inner cluster regions, critical for strong lensing. Even subhalos on the scales of galaxies can influence the strong lensing properties of their hosts and alter the shape and the fluxes of gravitational arcs. Therefore, if the lens modelling is not carried out at a very high level of detail, it may result in being totally incorrect.
Second, the high sensitivity of gravitational arcs to deviations from regular, smooth and symmetric mass distributions suggests that strong gravitational lensing is potentially a powerful tool to measure the level of substructures and asymmetries in clusters. Since, as we said, the sensitivity to substructures is higher in the case of more symmetric lenses, we conclude that dynamically active clusters, like those undergoing major merger events, should be quite insensitive to “corrugations” in the projected mass distribution but highly sensitive to asymmetries. Arcs could then be used to diagnose mergers in clusters. Conversely, substructures should become increasingly important for the arc morphology as clusters relax. Then the level of substructures in clusters should be quantified by measuring their effect on the arc morphology. This is particularly intriguing since measuring the fine structures of gravitational arcs has become feasible thanks to the high spatial resolution reached in observations from space.
Third, the strong impact of asymmetries and substructures on the lensing properties of clusters and the wide region in the cluster where these last can be located in order to produce a significant effect further support the picture that mergers might have a huge impact on the cluster optical depth for strong lensing, as suggested in several previous studies (Torri et al., 2004; Meneghetti et al., 2005; Fedeli et al., 2005).
Acknowledgements.
We are grateful to the anonymous referee for his helpful comments and suggestions. The -body simulations were performed at the “Centro Interuniversitario del Nord-Est per il Calcolo Elettronico” (CINECA, Bologna), with CPU time assigned under an INAF-CINECA grant. This work has been supported by the Vigoni programme of the German Academic Exchange Service (DAAD) and Conference of Italian University Rectors (CRUI). F.P. is supported by the German Science Foundation under grant number BA 1369/5-2.References
- Arabadjis et al. (2002) Arabadjis, J. S., Bautz, M. W., & Garmire, G. P. 2002, ApJ, 572, 66
- Bartelmann (1995) Bartelmann, M. 1995, A&A, 299, 11
- Bartelmann et al. (1998) Bartelmann, M., Huss, A., Colberg, J., Jenkins, A., & Pearce, F. 1998, A&A, 330, 1
- Bartelmann & Meneghetti (2004) Bartelmann, M. & Meneghetti, M. 2004, A&A, 418, 413
- Bartelmann & Steinmetz (1996) Bartelmann, M. & Steinmetz, M. 1996, MNRAS, 283, 431
- Bartelmann & Weiss (1994) Bartelmann, M. & Weiss, A. 1994, A&A, 287, 1
- Broadhurst et al. (2005) Broadhurst, T., Benítez, N., Coe, D., et al. 2005, ApJ, 621, 53
- Burkert (1995) Burkert, A. 1995, ApJ, 447, L25+
- Burkert & Silk (1997) Burkert, A. & Silk, J. 1997, ApJ, 488, L55+
- Chen et al. (2003) Chen, J., Kravtsov, A. V., & Keeton, C. R. 2003, ApJ, 592, 24
- Comerford et al. (2005) Comerford, J. M., Meneghetti, M., Bartelmann, M., & Schirmer, M. 2005, ArXiv Astrophysics e-prints
- Dalal et al. (2005) Dalal, N., Hennawi, J. F., & Bode, P. 2005, ApJ, 622, 99
- Dalcanton & Bernstein (2000) Dalcanton, J. J. & Bernstein, R. A. 2000, AJ, 120, 203
- Ettori et al. (2002) Ettori, S., De Grandi, S., & Molendi, S. 2002, A&A, 391, 841
- Fedeli et al. (2005) Fedeli, C., Meneghetti, M., Bartelmann, M., Dolag, K., & Moscardini, L. 2005, ArXiv Astrophysics e-prints
- Firmani et al. (2001) Firmani, C., D’Onghia, E., Chincarini, G., Hernández, X., & Avila-Reese, V. 2001, MNRAS, 321, 713
- Flores et al. (2000) Flores, R., Maller, A., & Primack, J. 2000, ApJ, 535, 555
- Flores & Primack (1994) Flores, R. & Primack, J. 1994, ApJ, 427, L1
- Gavazzi (2005) Gavazzi, R. 2005, A&A, 443, 793
- Gladders et al. (2003) Gladders, M., Hoekstra, H., Yee, H., Hall, P., & Barrientos, L. 2003, ApJ, 593, 48
- Hennawi et al. (2005) Hennawi, J. F., Dalal, N., Bode, P., & Ostriker, J. P. 2005, ArXiv Astrophysics e-prints
- Hockney & Eastwood (1988) Hockney, R. & Eastwood, J. 1988, Computer simulation using particles (Bristol: Hilger, 1988)
- Kneib et al. (1993) Kneib, J., Mellier, Y., Fort, B., & Mathez, G. 1993, A&A, 273, 367
- Lewis et al. (2003) Lewis, A. D., Buote, D. A., & Stocke, J. T. 2003, ApJ, 586, 135
- Li et al. (2005) Li, G.-L., Mao, S., Jing, Y. P., et al. 2005, ApJ, 635, 795
- McGaugh & de Blok (1998) McGaugh, S. S. & de Blok, W. J. G. 1998, ApJ, 499, 41
- Meneghetti et al. (2005) Meneghetti, M., Bartelmann, M., Dolag, K., et al. 2005, A&A, 442, 413
- Meneghetti et al. (2005) Meneghetti, M., Bartelmann, M., Jenkins, A., & Frenk, C. 2005, ArXiv Astrophysics e-prints
- Meneghetti et al. (2003a) Meneghetti, M., Bartelmann, M., & Moscardini, L. 2003a, MNRAS, 346, 67
- Meneghetti et al. (2003b) Meneghetti, M., Bartelmann, M., & Moscardini, L. 2003b, MNRAS, 340, 105
- Meneghetti et al. (2000) Meneghetti, M., Bolzonella, M., Bartelmann, M., Moscardini, L., & Tormen, G. 2000, MNRAS, 314, 338
- Meneghetti et al. (2001) Meneghetti, M., Yoshida, N., Bartelmann, M., et al. 2001, MNRAS,, 325, 435
- Moore (1994) Moore, B. 1994, Nature, 370, 629
- Oguri (2002) Oguri, M. 2002, ApJ, 573, 51
- Oguri et al. (2003) Oguri, M., Lee, J., & Suto, Y. 2003, ApJ, 599, 7
- Oguri et al. (2005) Oguri, M., Takada, M., Umetsu, K., & Broadhurst, T. 2005, ApJ, 632, 841
- Ota et al. (2004) Ota, N., Pointecouteau, E., Hattori, M., & Mitsuda, K. 2004, ApJ, 601, 120
- Puchwein et al. (2005) Puchwein, E., Bartelmann, M., Dolag, K., & Meneghetti, M. 2005, A&A, 442, 405
- Sand et al. (2003) Sand, D., Treu, T., Smith, G., & Ellis, R. 2003, ApJ submitted, preprint astro-ph/0309465
- Springel (2005) Springel, V. 2005, MNRAS, 364, 1105
- Springel et al. (2001) Springel, V., Yoshida, N., & White, S. 2001, New Astronomy, 6, 79
- Tormen et al. (1997) Tormen, G., Bouchet, F., & White, S. 1997, MNRAS, 286, 865
- Torri et al. (2004) Torri, E., Meneghetti, M., Bartelmann, M., et al. 2004, MNRAS, 349, 476
- Wambsganss et al. (1998) Wambsganss, J., Cen, R., & Ostriker, J. 1998, ApJ, 494, 29
- White (1996) White, S. D. M. 1996, in Cosmology and Large Scale Structure, ed. R. Schaeffer, J. Silk, M. Spiro, & J. Zinn-Justin, 349–+
- Yoshida et al. (2001) Yoshida, N., Sheth, R., & Diaferio, A. 2001, MNRAS, 328, 669
- Zaritsky & Gonzalez (2003) Zaritsky, D. & Gonzalez, A. 2003, ApJ, 584, 691