Fe emission and ionized excess absorption in the luminous quasar 3C 109 with XMM–Newton
Abstract
We report results from an XMM–Newton observation of the broad–line radio galaxy 3C 109 (z=0.3056). Previous ASCA data revealed the presence of a broad iron line from the accretion disc with which the XMM–Newton spectrum is fully consistent. However, although improving the ASCA constraints on the line parameters, the quality of the data is not high enough to distinguish between an untruncated accretion disc extending down to small radii close to the black hole and a scenario in which the innermost 20–30 gravitational radii are missing. For this reason, our results are model–dependent and the hard data can be modelled equally well by considering an absorption scenario in which a large column of neutral gas partially covers the X–ray continuum source. However, the absorber would have to comprise hundreds/thousands very compact clouds close to the X–ray source, which seems rather extreme a requirement. The 2–10 keV intrinsic luminosity of 3C 109 is of the order of 2–3erg s-1 regardless of the adopted model. A recent black hole mass estimate of implies that . If partial covering is excluded, the observed reflection fraction (of the order of unity), steep photon index (1.86), and Fe line equivalent width (about 100 eV) all suggest to exclude that the X–ray continuum is strongly beamed indicating that the large Eddington ratio is associated with a radiatively efficient accretion process and making it unlikely that the innermost accretion disc is replaced by a thick radiatively inefficient medium such as in advection–dominated accretion models. We also confirm previous findings on the detection of low energy absorption in excess of the Galactic value, where we find excellent agreement with previous results obtained in X–rays and at other wavelengths (optical and infrared). The better quality of the XMM–Newton data enables us to attribute the excess absorption to slightly ionized gas in the line of sight, located at the redshift of 3C 109. The most likely interpretation for the excess absorption is that the line–of–sight is grazing the obscuring torus of unified models, which is consistent with the inclination inferred from the Fe line profile (about 40∘) and with the hybrid radio–galaxy/quasar nature of 3C 109.
keywords:
galaxies: active – quasars: individual: 3C 109 – X-rays: galaxies – X-rays: individual: 3C 1091 Introduction
According to orientation–dependent unified models, radio–loud quasars and radio galaxies belong to the same parent population and their observed properties depend on our viewing angle with respect to the obscuring torus and jet axis (e.g. Orr & Browne 1982; Barthel 1989; Antonucci 1993). The dusty torus hides the active nucleus and broad–line region in radio galaxies, whereas these are viewed directly in quasars. The half opening angle of the torus is thus the critical angle (about , e.g. Barthel 1989) at which the transition between radio galaxies and quasars is thought to occur. However, given the observed increase of quasar fraction with distance and luminosity (Singal 1996; Willot et al. 2000), the opening angle is likely to increase with luminosity (e.g. the receding torus model, Lawrence 1991; Simpson 2003 for a review) allowing the broad–line region to be seen at the highest luminosities (but see e.g. Haas et al. 2004).
3C 109 is an example of a luminous active galactic nucleus (AGN) with observed properties placing it at the boundaries between broad–line radio galaxies (BLRGs) and quasars. In the optical 3C 109 appears as a faint galaxy at z=0.3056 (Spinrad et al. 1985) with an unresolved nucleus. Early optical studies revealed a large Balmer decrement and a red continuum (Yee & Oke 1978; Grandi & Osterbrock 1978). Rudy et al. (1984) found strong and non–variable optical polarisation (about 8 per cent) in both the optical continuum and H emission. Such a level of polarisation, if due to transmission through aligned dust grains, is consistent with a large intrinsic reddening of the order of E(B-V)=1.0–1.5, a result later consolidated through spectro–polarimetric observations by Goodrich & Cohen (1992) who derived a total continuum reddening of E(B-V) 1.2. Subsequent spectro–photometric observations in the infrared by Rudy, Puetter & Mazuk (1999) revealed an in situ reddening of E(B-V) to be added to the Galactic one of E(B-V) estimated through the COBE/IRAS infrared maps111As pointed out by Rudy, Puetter & Mazuk (1999) the COBE/IRAS estimate is much larger that the value E(B-V) derived from the H I measurements of Burstein & Heiles (1982) but should be more accurate since it is based on direct observation of dust. of Schlegel, Finkbeiner & Davis (1998).
3C 109 is also a bright source in the X–ray band with a 2–10 keV intrinsic luminosity of 2–5 erg s-1 (Allen & Fabian 1992; Allen et al 1997) making it one of the most X–ray luminous objects at . Absorption is seen in the X–rays in excess of that expected from Galactic material, confirming the optical and infrared studies. ROSAT PSPC (Allen & Fabian 1992) and ASCA (Allen et al 1997) data were used to infer a total X–ray column density of N cm-2, in good agreement with the optical reddening (N; Bohlin, Savage & Drage 1978). The ASCA data also revealed the presence of a broad iron (Fe) K emission line (Allen et al 1997). The line was consistent with being produced in the accretion disc but the emitting region was only poorly constrained with an upper limit on the inner disc radius of 140 gravitational radii. When interpreted as due to reflection from the accretion disc, the broad Fe line profile suggested an observer inclination (for a neutral 6.4 keV Fe line).
At radio wavelengths, 3C 109 is classified as a FR II lobe–dominated radio galaxy with steep spectrum (Laing, Riley & Longair 1983) and large luminosity ( W Hz-1; Bennet et al. 1986). The large–scale radio structure of 3C 109 consists of two symmetric lobes with hot spots and core emission. A faint and clearly one–sided jet is present at the parsec scale (Giovannini et al 1994). By measuring the jet/core flux ratio in VLA data Giovannini et al. (1994) could derive a value of for the angle between the radio axis and the line of sight. VLBI observations of the jet/counter–jet ratio however indicate a less tight constraint of . By combining the radio constraints on the orientation with that from the broad Fe K line (), 3C 109 seems to lie at the high–inclination end of the quasar class, which could also explain the observed excess absorption in terms of a line of sight passing through the edge of the obscuring torus.
The ASCA detection of the broad Fe line in 3C 109 represents the exception rather than the rule for radio–loud objects (e.g. Eracleous & Halpern 1998; Woźniak et al. 1998; Eracleous, Sambruna & Mushotzky 2000; Grandi et al. 2006). The weak disc reflection signatures in radio–loud sources possibly indicate that the X–ray continuum is beamed away from the reflector (e.g. Beloborodov 1999) or the presence of a truncated accretion disc geometry in which the inner regions of the standard radiatively efficient and geometrically thin disc are replaced by a thick and radiatively inefficient medium such as in an advection–dominated accretion flow (Narayan & Li 1995; see also Meier 1999; 2001 for the connection with jets). An alternative explanation is that the an untruncated disc is present, but highly ionized, thus producing weaker reflection signatures than expected in the neutral case (Ballantyne et al. 2002). As mentioned, the ASCA result on 3C 109 is consistent with both an untruncated disc and one in which the innermost 150 gravitational radii are missing thereby not providing a clear picture of the innermost accretion flow, while the relatively steep X–ray slope () was used to exclude a strong contribution from a beamed jet component. So far, XMM–Newton observations of BLRGs have produced inconclusive results (e.g. Gliozzi et al. 2004; Ballantyne et al. 2004; Lewis et al. 2005) with some exceptions such as e.g. the BLRG 4C 74.26 and the radio–loud quasar PG 1425+267 in which evidence for an untruncated disc has been recently reported by Ballantyne & Fabian (2005) and Miniutti & Fabian (2006), respectively.
Here we present results from a new 40 ks X–ray observation of 3C 109 with XMM–Newton. The higher sensitivity of the XMM–Newton CCD detectors with respect to any other X–ray mission allows us to study the Fe band with unprecedented detail in search for a confirmation of the ASCA detection of a broad Fe emission line. We also present results on the excess absorption seen at low energies with the aim of providing a self–consistent picture of the environment of 3C 109 in the X–ray, optical, and infrared bands.
2 The XMM–Newton observation
3C 109 was observed by XMM–Newton on 2005 February 3–4 during revolution 944. Source/background light curves and spectra for the EPIC detectors were extracted from circular regions centred on the source and close to it respectively. High background is present in the last few ks of the observation which are excluded from the analysis. Another period of relatively high background is instead included after verifying that it does not affect the spectra in any noticeable way. After filtering, the net exposure is 34 ks for the pn and 37 ks for both MOS cameras. The pn spectrum was grouped as to have a minimum of 50 counts per bin, while the MOS spectra were grouped to have 25 counts per bin.
It should be stressed that X–ray emission from the radio lobes has been detected with Chandra (Croston et al 2005). The XMM–Newton spatial resolution does not allow us to distinguish between core and lobe X–ray emission. However, Croston et al. (2005) could measure an upper limit of nJy for the 1 keV flux density due to the lobes in 3C 109, while the 1 keV flux density of the core is nJy (Hardcastle, Evans & Croston 2006). Given that the X–ray core is slightly brighter during the present XMM–newton observation than in the previous Chandra one (see Fig. 6 below), the lobe contribution to the XMM–Newton spectrum is likely limited to less than 0.3–0.4 per cent, making the spectrum analysed below completely dominated by the core emission.

In Fig. 1, we show the EPIC pn light curve in a soft (S: 0.2–2 keV, top panel) and in a hard (H: 2–10 keV, middle panel) energy band together with the resulting hardness ratio (H/S, bottom panel). The two light curves are consistent with being constant over the XMM–Newton exposure. A constant fit to the hardness ratio is also totally acceptable ( for 70 degrees of freedom) excluding any strong spectral variation during the observation. Since 3C 109 does not exhibit any sign of short–timescale flux or spectral variability, we concentrate on the time–averaged X–ray spectrum of the source.
3 The 2–10 keV spectrum and Fe K band
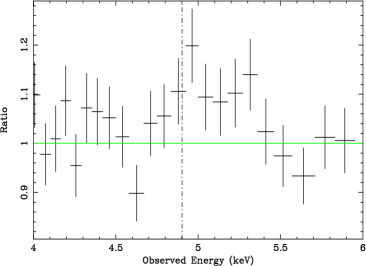
We start our analysis by considering the hard spectrum of 3C 109 in the 2–10 keV band (observed frame, i.e. 2.6–13.06 keV in the rest–frame, z=0.3056). We consider the EPIC–pn data only because of the higher sensitivity of the pn camera with respect to MOS in the Fe band. A simple absorbed power law model provides a good description of the hard spectrum for a power law photon index of . Neutral photoelectric absorption is also seen even above 2 keV and we measure a column density of cm-2. The actual value of the column density will be better constrained by including the soft data, and we defer any discussion to a further analysis below. The overall fit is acceptable with for 398 degrees of freedom (dof), but visual inspection of the residuals suggests the possible presence of emission features in the Fe K band. In Fig. 2 we show the data to model ratio in the Fe K band for the simple model above. The vertical line marks the energy of 6.4 keV (Fe K) in the source rest–frame.
3.1 Fe emission: simple models
To account for the residuals in Fig. 2, we add to the model a Gaussian emission line and find a significant improvement of for three more free parameters corresponding to a significance at the 99.9 per cent level according to the F–test for a final result of for 395 dof. However, as pointed out by Protassov et al. (2002), the estimate of the statistical significance of emission lines through the F–test is not highly accurate. We then performed Monte Carlo simulations according to the method proposed in Porquet et al. (2004) and our results confirm the significance of the Fe line detection at more than the 99.6 per cent confidence level. The best–fitting parameters indicate a line energy of keV with a rest–frame equivalent width EW eV with respect to the absorbed power law continuum. The line appears to be barely resolved and we measure a width eV.
However, Fig. 2 suggests the presence of a more structured line profile and the possible presence of two emission lines. The brightest is close to 6.4 keV, while the fainter is seen at higher energy. As a first phenomenological model, we consider a double–Gaussian parametrisation of the emission features. We obtain a slightly better fit than with a single Gaussian ( for 392 dof). One line is found at keV and has an equivalent width of 60 eV in the rest–frame. The second line is at keV and is fainter. Both lines are unresolved with an upper limit on their width of 200 eV and 300 eV respectively. The energy of the lines indicates the presence of a slightly ionized reflection component producing a 6.4 keV neutral K line and a fainter He–like one.
3.1.1 A relativistic Fe line
A second parametrisation is suggested by previous X–ray observations of 3C 109. An Fe emission line was first detected in the X–ray spectrum of 3C 109 with ASCA and result are reported by Allen et al (1997). When fitted with a single Gaussian emission line, the XMM–Newton best–fitting parameters (see above) are different but consistent within the 90 per cent errors with the ASCA results. In particular a much larger width ( eV) and equivalent width ( eV) were suggested by the ASCA spectrum. The Fe line detected by ASCA was broad and consistent with being emitted from the accretion disc. The Fe line emitting region was however poorly constrained and the inner disc radius was allowed to take any value from the innermost stable circular orbit (ISCO) around a non–rotating black hole up to (: the ISCO for a non–rotating black hole is ).
To directly compare the XMM–Newton data with the ASCA results on the Fe line, we replace the Gaussian emission line with a DISKLINE model (Fabian et al 1989) as in Allen et al (1997). We fix the line energy to 6.4 keV and the emissivity to the energy dissipation profile of a standard accretion disc (). The inner disc radius and observer inclination are free to vary while the outer disc radius is fixed to . We obtain a good fit with the same statistical quality as the one with a Gaussian line (model A in Table 1). The inner disc radius can take any value between the ISCO around a non–rotating black hole and , significantly improving the ASCA constraint, while the observer inclination is . If the line energy is instead fixed to be 6.7 keV, corresponding to He–like Fe emission, only a lower limit on the inclination can be obtained () and the inner disc radius is completely unconstrained (). Results are thus not conclusive on the presence of a relativistic Fe line in 3C 109. The data are consistent with a relativistic Fe line from a disc extending all the way down to the ISCO, but a truncated disc missing the innermost – gravitational radii cannot be excluded.
The Fe line EW is smaller than in the ASCA data (see Table 1, model A), but the line intensity is consistent with being constant within the errors. By considering the neutral (6.4 keV) Fe line model, we measure an intensity of ph cm-2 s-1 to be compared with the ASCA result of ph cm-2 s-1.

3.2 Including the X–ray reflection continuum
If the Fe line really originates in optically thick matter such as the accretion disc (or the torus if narrow), the line is associated with a reflection continuum that has to be included in the spectral model for self–consistency. The X–ray reflection continuum introduces curvature (and Fe edge) in the Fe band and could affect the line parameters. Moreover, when the reflection spectrum is ionized, Comptonization induces a broadening of the line which has to be taken into account. We then apply to the hard spectrum a self–consistent ionized reflection model in which the emission lines are computed together with the X–ray reflection continuum (Ross & Fabian 2005). The model parameters are the Fe abundance and source redshift (that we fix to the solar value and to the source redshift respectively), the ionization parameter of the reflector, the photon index of an incident power law continuum (which has a high–energy cutoff at 100 keV) and the normalisation.
3.2.1 Reflection from distant matter
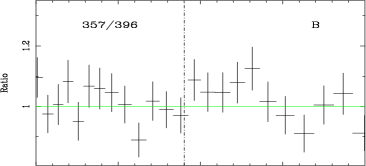
As a first step, we assume that the reflection spectrum and Fe features come from distant material so that the only Fe line broadening can be due to Comptonization if the reflector is highly ionized. We obtain a good fit to the 2–10 keV pn spectrum (model B in Table 1). The ionization parameter is constrained to be smaller than erg cm s-1. The best–fitting reflection spectrum comprises both a neutral 6.4 keV line and a fainter He–like one at 6.7 keV. The data to model ratio in the Fe band is shown in the top panel of Fig. 3. Residuals are left above 6.4 keV (rest–frame, vertical line) and we tried to account for them by adding a second more ionized reflector, but we did not find any improvement in the statistics. We measure a reflection fraction of , i.e. the reflector intercepts about half (or only slightly less) of the X–ray continuum in good agreement also with the measured Fe line equivalent width (see model A in Table 1).
3.2.2 Accretion disc reflection
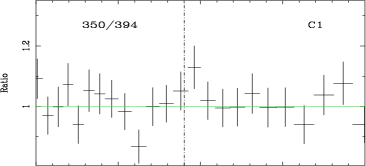
We then consider the same reflection model as above, but we apply a relativistic blurring kernel (obtained from the DISKLINE model) inducing the relativistic effects arising if emission comes from an accretion disc around a non–rotating black hole (model C1 in Table 1). As for model A, we fix the emissivity to its standard profile . We obtain an improvement of with respect to the unblurred reflection model B for two more free parameters which means that the relativistic blurring is significant at the 98 per cent level. The inner disc radius is constrained to be smaller than , while the observer inclination is measured to be , confirming the results obtained with the simpler power law plus DISKLINE model A when the line was assumed to be neutral. As for the ionization state, we measure a low ionization parameter erg cm s-1 which again points towards a neutral (or slightly ionized) accretion disc. We also tried to artificially increase the ionization of the reflector to reproduce the results obtained with model A when the line energy was fixed to 6.7 keV but we could not find any solution. Once again, the best–fitting solution points toward a significant contribution of the reflection component (with a reflection fraction of the order of unity) suggesting a typical Seyfert 1–like X–ray continuum.
3.2.3 Composite reflection (disc plus distant matter)
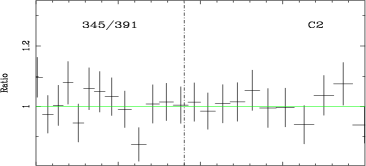
Visual inspection of the residuals shows that the 6.4 keV peak is not well modelled (second panel of Fig. 3). We then add to model C1 a narrow Gaussian emission line representing the narrow component of the Fe K line (model C2 in Table 1). A narrow Fe K line is in fact ubiquitous in the X–ray spectra of Active galaxies and is thought to be associated with some distant reflector such as the torus of unification schemes (e.g. Yaqoob & Padmanabhan 2004). The inclusion of the narrow emission line marginally improves the fit by for three more free parameters. The line parameters are reported in Table 1 and the data to model ratio is shown in the third panel of Fig. 3. The blurring reflector parameters (inner disc radius and inclination) are fitted to the data being however unaffected and indistinguishable from results obtained with model C1. If the narrow line is replaced by an unblurred reflection spectrum no further improvement is obtained.
3.3 Partial covering alternative to the relativistic Fe line
The 2–10 keV spectrum is best fitted (though marginally) by model C2 comprising an almost neutral reflection spectrum from the accretion disc plus a component from distant matter producing the narrow Fe line at 6.4 keV. As mentioned, if relativistic blurring is removed the statistical quality of the fit is only slightly worse and we are thus motivated to find alternative solutions. Here we briefly explore one further alternative to the relativistic line.
| MODEL | PARAMETERS | 2–10 keV | 0.4–10 keV | ||||||
|---|---|---|---|---|---|---|---|---|---|
| /dof | /dof | ||||||||
| A | EFe | rin | i | EWFe | – | ||||
| POW + DISKLINE | – | 353/395 | 1322/1364 | ||||||
| – | 351/395 | 1319/1364 | |||||||
| B | – | – | – | R | |||||
| POW + REF | – | – | – | 357/396 | 1317/1365 | ||||
| C1 | – | rin | i | R | |||||
| POW + DISCREF | – | 350/394 | 1297/1363 | ||||||
| C2 | EFe | EWFe | R | ||||||
| POW + DISCREF + GAUSS | 345/391 | 1291/1360 | |||||||
| D | EFe | EWFe | NH | fc | |||||
| PC ( POW + GAUSS ) | 348/393 | 1292/1362 | |||||||
All fits include photoelectric absorption (the WABS model). The resulting column density is not reported here. It is always of the order of – cm-2 and a detailed analysis of the absorption in 3C 109 is given below (see Section 5 and Table 2). In models A and D the Fe line energy EFe is given in keV in the source rest–frame, while the line width and equivalent width (EW) are given in eV (the EW is also corrected for the source redshift). In model B, C1, and C2 REF refers to the unblurred reflection model, and DISCREF to the relativistically blurred one. The ionization parameter of the reflection models () is given in units of erg cm s-1 and R is the reflection fraction (R=1 means that the reflector intercepts about half of the X–ray continuum). Given that our reflection model does not contain the reflection fraction as a free parameter, its value is estimated by comparison of the best–fitting reflection model with the PEXRAV model (neutral reflection), a procedure that is reasonably accurate here given that the ionization state of the reflector is low. In model C2 the parameters and are the same as in model C1 and are not reported. In model D, the column density of the partial coverer is given in units of cm-2.
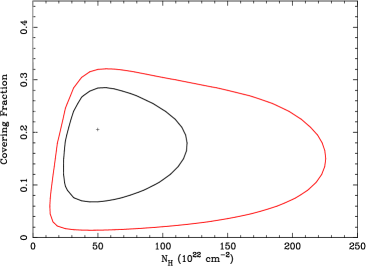
We consider the possibility that absorption by a large column of gas partially covering the source is responsible for the hard spectral shape, as tentatively observed in other radio–loud sources (e.g. Lewis et al. 2005). We also include a Gaussian emission line to account for possible Fe emission from the absorber itself (or other distant material). We obtain a good fit with a partial covering model (model D) which is statistically indistinguishable from our best–fitting model C2 (see Table 1). The data to model ratio for model D are shown in the bottom panel of Fig. 3. The partial covering parameters are however not very well constrained. The covering fraction is only an upper limit of 32 per cent and the column density can take any value from cm-2 to cm-2 (2 errors). The 68 and 90 per cent confidence level contours for covering fraction and column density are shown in Fig. 4. We also replaced the neutral partial coverer with an ionized one, but the requirement is for neutral matter with a 90 per cent upper limit on the ionization parameter of erg cm s-1.
3.4 Conclusions and estimate of the Eddington ratio
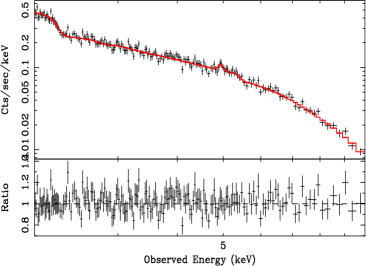
We conclude that the spectral shape in the hard band is well reproduced by either i) an almost neutral X–ray reflection spectrum from the accretion disc with a likely contribution from a distant reflector (model C2) or by ii) intervening absorption by a large column of gas ( cm-2) covering about 20 per cent of the X–ray continuum source plus a narrow Fe K line (model D). Both interpretations are allowed by the data and cannot be distinguished on a statistical basis. In Fig. 5 we show the 2–10 keV spectrum and data to model ratio when the spectrum is fitted with model C2.
By choosing C2 as best–fit model , we measure an observed 2–10 keV flux of erg cm-2 s-1. Correcting for absorption, we have a 2–10 keV flux of erg cm-2 s-1, corresponding to a 2–10 keV luminosity of erg s-1 in the source rest–frame. If partial covering is instead the right description of the hard spectrum, the intrinsic absorption corrected luminosity is erg s-1, depending on the assumed column density ( km s-1 Mpc-1, , ).
Given the recent mass estimate for the central black hole (, McLure et al 2006), and by assuming a 2–10 keV to bolometric luminosity conversion222The adopted bolometric correction of 30 for the 2–10 keV luminosity is a conservative one and is likely to underestimate the actual bolometric luminosity of 3C 109 by a factor 2–3, see e.g. Elvis, Risaliti & Zamorani 2002. Therefore the Eddington ratio discussed below has to be intended as a lower limit. of a factor 30 (Fabian & Iwasawa 1999 from the compilation of spectral energy distributions of Elvis et al. 1994), it appears that 3C 109 is characterised by a super–Eddington luminosity with . The black hole mass estimate is crucial for this result: McLure et al. (2005) used the H version of the virial–mass estimator (McLure & Dunlop 2004) which provides black hole mass estimates with a known scatter of 0.4 dex, meaning that the black hole mass of 3C 109 could be as large as . However, even by adopting this upper limit, the requirement is still for a source radiating at its Eddington luminosity.
The above discussion assumes that the X–ray luminosity is radiated isotropically and, given the FR II nature of 3C 109, this is far from obvious. It is indeed possible that part of the X–ray core emission is due to a beamed inner jet component, which would reduce the ratio. The jet component is generally associated with a flatter (1.5–1.7) X–ray slope than measured here (1.86). However, it should be stressed that some of the knots in the jets of FR II radio galaxies can have much steeper photon–indexes than generally seen ( though with large error bars, see e.g. Sambruna et al. 2006). Thus the steep photon index we measure cannot be taken as a secure indication that beamed emission is negligible. On the other hand, if reflection rather than partial covering is the rigth description of the hard X–ray data, the measured reflection fraction (of the order of unity) implies that the X–ray continuum is not strongly beamed away from the reflector, thus suggesting little inner jet contamination. We conclude that, though it is difficult to exclude that the inferred bolometric luminosity is over–estimated because of the presence of a beamed component, the possibility that 3c 109 is radiating a substantial fraction (close to unity) of its Eddington luminosity does remain plausible, which would also be consistent with the tentative detection of the broad Fe line from the accretion disc.
4 Broadband spectral analysis
We then consider the broadband spectrum of 3C 109. We use the full 0.4–10 keV band and consider joint fits to all EPIC cameras (pn and the two MOS). The data below 0.4 keV are ignored because of some residual inter–calibration problems at the softest energies. The extension of the 2–10 keV spectral models to the soft band is satisfactory (even before fitting the data) for all models. In the last column of Table 1 we report the results of the fits to the broadband spectrum with the same models used for the hard band. The parameters reported in Table 1 refer to the 2–10 keV fits but are basically unaffected by the inclusion of the low energy data except for the photon index of models A which steepens to .
Once again the data tend to prefer models C2 and D as the best–fitting solutions which are indistinguishable from a statistical point of view. We notice that models C1, C2, and D have a steeper spectral index than models A and B. This is the main reasons for the better fits provided by models C1, C2 and D. In fact if only the soft data below 2.5 keV are considered (where the reflection/partial covering contribution is negligible) a fit with an absorbed power law gives confirming that a steep photon index is preferred by the data as in models C1, C2, and D and suggesting that models A and B have to be considered as less likely as also indicated by the fitting statistics.
4.1 Long–term X–ray variability
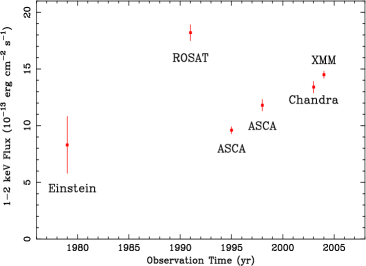
The broadband spectral analysis is in excellent agreement with the ASCA data presented in Allen et al. (1997) and enable us to compare the observed flux with previous X–ray observations. We consider the 1–2 keV flux only, since this energy band is common to all previous observations. We measure a flux of and, in Fig. 6, we show the historical X–ray flux light curve in that same energy band. All historical data are re–collected from Allen et al (1997) with the exception of a second 1998 ASCA observation (unpublished) and of the 2003 Chandra observation (Hardcastle, Evans & Croston 2006) that we include here for the first time. Long–term X–ray variability is clearly present with the largest amplitude variation occurring in a 4 years interval between the 1991 ROSAT and the 1995 ASCA observations (about a factor 2). Variability with the similar amplitude and timescale has also been reported in the near–infrared (Rudy et al. 1984) and variation of the order of 50 per cent are seen in the J, H, and K bands as well (Elvis et al. 1984).
5 Excess absorption
When model D is extended to the 0.4–10 keV band, we measure (besides the partial covering column density) a column density of N cm-2 which is derived by assuming that the absorber lies at zero redshift. An identical result is obtained by using model C2 instead.
The value of the Galactic column density in the line of sight towards 3C 109 is somewhat ambiguous. The nominal value obtained through H I measurements is cm-2 (Burstein & Heiles 1982). However, COBE/IRAS maps indicate a Galactic column as high as cm-2 (Schlegel, Finkbeiner & Davis 1998), in good agreement with X–ray studies of the nearby cluster Abell 478 suggesting a column of cm-2 (Sun et al. 2003; Pointecouteau 2004; Sanderson, Finoguenov & Mohr 2005). The same result is obtained by averaging the COBE/IRAS reddening over a 1 deg2 region centred on 3C 109 and, since this result is based on direct observations of the dust, we adopt this value as already done by Rudy, Puetter & Mazuk (1999) in their infrared study in which the total column density towards 3C 109 was estimated to be cm-2.
The column density we measure in the broadband fits ( cm-2) strongly suggests that excess absorption is present, confirming previous analysis of ROSAT PSPC and ASCA data (Allen & Fabian 1992; Allen et al 1997). Assuming, as we did so far, that the absorber lies at zero redshift, a column density of cm-2 was inferred from previous ASCA spectral analysis, while ROSAT data indicates a total column density of cm-2. The XMM–Newton data confirm the presence of excess absorption in the line of sight with a (zero redshift) column density somewhat lower than the ASCA result and consistent with the ROSAT spectrum.
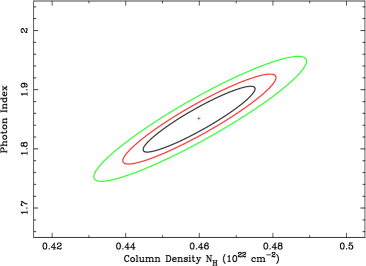
Since we are here interested in determining the properties of an absorber with column density of a few times cm-2 and given that such a column does not affect significantly the spectrum above 3 keV, in the following we consider the 0.4–2.5 keV band only. In this way, we are not affected by the spectral complexities in the hard band (partial covering and/or reflection) and we are certain of measuring the intrinsic spectral slope, whose value clearly affects the absorption properties. In Fig. 7 we show the confidence level contours for the power law photon index and total column density (model I in Table 2). The contours confirm that the total column density seen in the X–ray spectrum of 3C 109 is well in excess of all estimates for the Galactic value.
5.1 Excess absorption local to 3C 109 ?
| MODEL | PARAMETERS | /dof | |||||
|---|---|---|---|---|---|---|---|
| I | NH | – | – | – | |||
| WABS * POW | – | – | – | 613/632 | |||
| II | NH | N | – | ||||
| WABS * ZWABS * POW | – | 612/631 | |||||
| – | 613/631 | ||||||
| III | NH | N | |||||
| WABS * ABSORI * POW | 600/630 | ||||||
| 599/630 | |||||||
| IV | NH | N | |||||
| WABS * XSTAR * POW | 588/630 | ||||||
All column densities are given in units of cm-2. The ionization parameter () is given in units of erg cm s-1.
Part of the excess absorption could be due to material surrounding the active nucleus and therefore at the redshift of 3C 109. We first add a second neutral absorber with redshift free to vary between zero and the source redshift (0.3065). Given the uncertainties in the Galactic absorption, we make a conservative choice and we assume the highest estimated value for the Galactic column density in the line of sight ( cm-2). We obtain a good fit but the redshift of the second absorber is only a 90 per cent upper limit () ruling out the presence of a neutral absorber at the redshift of the source. The same result is obtained if the Galactic column density is free to vary and the second absorption component is imposed to arise at z=0.3056 (see Table 2, model II). In this case, it is the column density of the absorber at z=0.3056 that is only an upper limit ( cm-2).
5.2 A “tepid absorber” solution
The presence of excess absorption with column densities of the order of few times cm-2 (or more) is often detected in the X–ray spectra of Active Galactic Nuclei. Given the luminosities of the central engine, the absorbing gas is almost always ionized and gives rise to typical signatures in the soft X–ray band. The soft X–ray spectrum of 3C 109 does not present any clear indication that a warm absorber is present. However, if the ionization parameter of the absorbing gas is low (but different from zero) subtle differences are expected with a neutral absorber without strong signatures in the soft band.
To test the hypothesis that the excess absorption in 3C 109 is slightly ionized, we use the simple ABSORI model in XSPEC (Done et al. 1992). As in model II, we first fix the column density of the (neutral) zero–redshift absorber to the Galactic estimate and let the ionized absorber redshift be a free parameter between 0 and 0.3056 (model III in Table 2). We find a significant improvement with for one more free parameters with respect to model II (a significance of more than 99.95 per cent). The absorber is only slightly ionized with erg cm s-1 and the 90 per cent lower limit on the redshift of the ionized absorber is indicating an in situ origin. With the ionized solution, we measure a column density of cm-2 in excess of the Galactic. We then remove the degeneracy between ionization parameter and redshift by fixing the redshift of the ionized absorber to z=0.3056 and let the Galactic column density free to vary. We find a similar fit as the one above with cm-2 and cm-2, while the ionized absorber has a ionization parameter of erg cm s-1.
As a final test, we consider a more refined absorption model using the XSTAR code (Kallman & Bautista 2001). We find an excellent fit to the 0.4–2.5 keV data with a significant improvement on any previous spectral model (see Table 2, model IV). Our best–fitting model is obtained by fixing the ionized absorber redshift only, while the Galactic and in situ column densities and the absorber ionization parameter are free to vary. We measure a zero–redshift, neutral column of cm-2, while the ionized absorber has a column density of cm-2 with a ionization parameter of erg cm s-1.
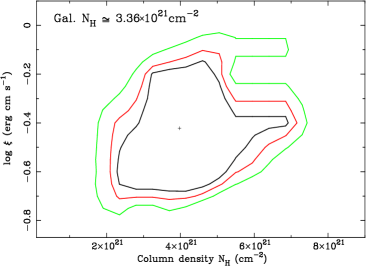
In Fig. 8 we show the confidence contours for the ( of the) ionization parameter and the column density of the ionized absorber from our best–fitting model IV. The absorber is only very slightly ionized, but the ionization parameter is well defined. Our best–fit model (IV) thus comprises a neutral zero–redshift plus ionized absorption at the redshift of 3C 109 for a total column density of cm-2 which is in excellent agreement with the total obscuration inferred through infrared studies (and implying a column density of cm-2).
By applying our best–fit absorption model (IV) to the broadband model C2 (see Table 1) we obtain a final fit to the broadband 0.4–10 keV spectrum of 3C 109 with for 1358 dof. The same statistical quality is obtained by considering model D instead. No significant change is seen in the best–fit parameters reported in Table 1 and 2.
6 Discussion
We have presented results from a new 40 ks XMM–Newton observation of the BLRG/QSO 3C 109 (z=0.3056), one of the most X–ray luminous sources within redshift 0.5. The intrinsic X–ray luminosity of the source is found to be – erg s-1 (depending on the adopted model) and compares well with previous X–ray estimates, though the source is shown to be variable by a factor 2 at least on a few years timescale. The X–ray continuum is well represented by a relatively steep power law with . Such a steep photon index is generally taken as an indication that a beamed component (often characterised by a flatter 1.5–1.7 photon index) contributes only marginally to the X–ray spectrum. However, this is not always the case, and an inner jet component cannot be ruled out on the basis of a steep X–ray slope only. The beamed component contribution to the X–ray spectrum is particularly relevant because by combining the high X–ray luminosity with the black hole mass estimate (), 3C 109 appears to be characterised by which can be significantly reduced only by assuming that the X–ray spectrum is strongly contaminated by a beamed inner jet component.
Fe emission is seen in the 6.3–7 keV rest–frame band. A narrow core at 6.4 keV is detected unambiguously, while additional curvature in the Fe K band can be modelled either in terms of reflection from the accretion disc or by invoking a partial covering scenario. If the disc reflection interpretation is correct, the disc surface is only slightly ionized and the emitting region must extend down to at least 26 gravitational radii from the black hole. Such a solution allows one to place the inner disc radius as close as the innermost stable circular orbit around a Schwarzschild black hole (6 gravitational radii) but is also consistent with a truncated disc scenario in which the innermost 20–30 gravitational radii are missing, possibly replaced by thick and radiatively inefficient matter. The observer inclination is well constrained () and is consistent with 3C 109 being a BLRG/QSO borderline object, as indicated also by optical, infrared and radio studies. We measure a reflection fraction of the order of unity which is completely consistent with an overall 100 eV equivalent width of the Fe line (narrow core plus disc line). The detection of substantial X–ray reflection from the accretion disc suggests that the X–ray continuum is not significantly beamed away from the reflector and supports the estimated obtained by assuming isotropic X–ray emission. If instead partial covering is the right description of the spectral curvature in the Fe K band, about 20–30 per cent of the X–ray continuum source is covered by a large column ( cm-2) of neutral gas ( erg cm s-1), and the intrinsic X–ray luminosity still requires (but again in the hypothesis of negligible inner jet contribution).
In the soft band, the X–ray continuum is clearly absorbed by a column density in excess of the Galactic one, confirming previous findings both in the X–rays and at optical and infrared wavelengths (Allen & Fabian 1992; Goodrich & Cohen 1992; Allen et al. 1997; Rudy Puetter & Mazuk 1999). We obtain a total column density of the order of – cm-2 which has to be considered as the sum of a zero–redshift neutral absorber and an in situ one at the redshift of 3C 109. The best–fitting solution to the pn and MOS soft data strongly suggests that the in situ absorber is slightly ionized ( erg cm s-1) with a non–zero ionization parameter preferred at more than the 99.9 confidence level. Our final result is that the zero–redshift neutral absorber contributes with a column density of cm-2 to be added to a further cm-2 from the ionized absorber at the redshift of 3C 109. The total column density compares remarkably well with the value of cm-2 inferred from optical and infrared studies (Rudy, Puetter & Mazuk 1999). Given the high luminosity of 3C 109, the low ionization of the absorber places it far from the central source (e.g. at the torus scale, suggesting that our line–of–sight is grazing the torus). This is also consistent with the observed large Balmer/Pashen decrement (Goodrich & Cohen 1992; Rudy Puetter & Mazuk 1999) in the broad–line region (BLR) making it likely that the in situ absorber is further away than the BLR with respect to the central engine. The obvious interpretation is that our line of sight is grazing the molecular torus, in good agreement with zeroth–order unification models (and with the inclination inferred from the broad Fe line).
The excellent agreement between the X–ray and the optical/infrared column density estimates implies that, if partial covering is indeed the right description of the hard spectrum, the additional column of neutral gas ( cm-2) cannot contribute to the optical/infrared absorption and must i) be dust–free (i.e. it lies within the dust sublimation radius), and ii) not obscure the broad lines (i.e. it lies within the broad–line–region). This places the partial coverer close to the X–ray source and within the innermost pc. By combining this location with the source luminosity and the upper limit on the ionization parameter of the absorber we estimate a density of the order of cm-3 for the gas responsible for the partial covering. Given the relatively low covering fraction (20–30 per cent) and the large observed column density ( cm-2) the absorbing matter is most likely distributed in compact clouds cm in size. Given the black hole mass estimate, the cloud size is of the order of gravitational radii and to provide effective partial covering, the clouds must have a size comparable to that the main X–ray emitting region. However, according to standard accretion models, X–rays mostly come from the innermost 50 gravitational radii or so and thus, in order to provide a 20–30 per cent covering fraction, the absorber must comprise hundreds of clouds in the line of sight (therefore probably thousands of clouds if isotropically distributed), which seems quite extreme a requirement.
We conclude that, even if not unambiguous from a spectral point of view, the disc reflection (and broad Fe line) interpretation of the hard spectrum of 3C 109 is less contrived than the partial covering one and is also consistent with the high mass accretion rate implied by the inferred . If partial covering is ruled out, the contribution of the X–ray reflection spectrum to the total flux implies a reflection fraction of the order of unity suggesting the a putative inner jet component does not contribute significantly in the X–ray band and further supporting the idea that 3C 109 is radiating close to its Eddington luminosity due to accretion processes alone. The X–ray data do not rule out a truncated accretion disc in which the innermost 20–30 gravitational radii are missing or replaced by a radiatively inefficient flow, but this scenario is also at odds with the high estimated Eddington ratio. If the innermost regions of the accretion disc are instead present but highly ionized, little Fe line is produced there, reconciling the hard spectral shape with the huge X–ray luminosity and the high mass accretion rate without the need to invoke a rather unusual partial covering scenario.
Acknowledgements
Based on observations obtained with XMM-Newton, an ESA science mission with instruments and contributions directly funded by ESA Member States and NASA. GM thanks Ross McLure for useful discussions on the black hole mass estimate in 3C 109 and Elena Belsole for discussions on the extend X–ray emission. GM thanks the PPARC for support. DRB is supported by the University of Arizona Theoretical Astrophysics Program Prize Postdoctoral Fellowship. This work was supported in part by the U.S. Department of Energy under contract number DE-AC02-76SF00515. ACF thanks the Royal Society for support. RRR thanks the College of the Holy Cross for support.
References
- Allen & Fabian (1992) Allen S.W., Fabian A.C., 1992, MNRAS, 258, 29
- Allen et al (1997) Allen S.W., Fabian A.C., Idesawa E., Inoue H., Kii T., Otani C., 1997, MNRAS, 286, 765
- Antonucci (1993) Antonucci R., 1993, ARA&A, 31, 473
- Ballantyne, Ross & Fabian (2002) Ballantyne D.R., Ross R.R., Fabian A.C., 2002, MNRAS, 332, L45
- Ballantyne, Fabian & Iwasawa (2004) Ballantyne D.R., Fabian A.C., Iwasawa K., 2004, MNRAS, 354, 839
- Ballantyne & Fabian (2005) Ballantyne D.R., Fabian A.C., 2005, ApJ, 622, L97
- Barthel (1989) Barthel P.D., 1989, ApJ, 336, 606
- Beloborodov (1999) Beloborodov A.M., 1999, ApJ, 510, L123
- Bennett et al. (1986) Bennet C.L., Lawrence C.R., Burke B.F., Hewitt J.N., Mahoney J., 1986, ApJS, 61, 1
- Bohlin, Savage & Drake (1978) Bohlin R.C., Savage B.D., Drake J.F., 1978, ApJ, 224, 132
- Burstein & Heiles (1982) Burstein D., Heiles C., 1982, AJ, 87, 1165
- Croston et al. (2005) Croston J.H., Hardcastle M.J., Harris D.E., Belsole E., Birkinshaw M., Worral D.M., 2005, ApJ, 626, 733
- Done et al. (1992) Done C., Mulchaey J.S., Mushotzky R.F., Arnaud K.A., 1992, ApJ, 395, 275
- Elvis et al. (1984) Elvis M., Willner S.P., Fabbiano G., Carleton N.P., 1984, ApJ, 280, 574
- Elvis et al. (1994) Elvis M. et al., 1994, ApJS, 95, 1
- Elvis, Risaliti & Zamorani (2002) Elvis M., Risaliti G., Zamorani G., 2002, ApJ, 565, L75
- Eracleous & Halpern (1998) Eracleous M., Halpern J.P., 1998, ApJ, 505, 577
- Eracleous, Sambruna & Mushotzky (2000) Eracleous M., Sambruna R., Mushotzky R.F., 2000, ApJ, 537, 654
- Fabian et al. (1989) Fabian A.C., Rees M.J., Stella L., White N.E., 1989, MNRAS, 238, 729
- Fabian & Iwasawa (1999) Fabian, A. C., Iwasawa, K. 1999, MNRAS, 303, L34
- Giovannini et al. (1994) Giovannini G., Feretti L., Venturi T., Lara L., Maracaide J., Rioja M., Spangler S.R., Wehrle A.E., 1994, ApJ, 435, 116
- Gliozzi et al. (2004) Gliozzi M., Sambruna R.M., Brandt W.N., Mushotzky R.F., Reacleous M., 2004, A&A, 413, 139
- Goodrich & Cohen (1992) Goodrich R.W., Cohen M.H., 1992, ApJ, 391, 623
- Grandi & Osterbrock (1978) Grandi S.A., Osterbrock D.E., 1978, ApJ, 220, 783
- Grandi, Malaguti & Fiocchi (2006) Grandi P., Malaguti G., Fiocchi M., 2006, ApJ in press (preprint astro-ph/0511784)
- Haas et al. (2004) Haas M. et al., 2004, A&A, 424, 531
- Hardcastle, Evans & Croston (2004) Hardcastle M.J., Evans D.A., Croston J.H., 2006, submitted to MNRAS (preprint astro-ph/0603090)
- Kallman & Bautista (2001) Kallman T.R., Bautista M.A., ApJS, 133, 221
- Laing, Riley & Longair (1983) Laing R.A., Riley J.M., Longair M.S., 1983, MNRAS, 204, 151
- Lawrence (1991) Lawrence A., 1991, MNRAS, 252, 586
- Lewis et al. (2005) Lewis K.T., Eracleous M., Gliozzi M., Sambruna R.M., Mushotzky R.F., 2005, ApJ, 622, 816
- Malizia et al. (2003) Malizia A., Bassani L., Stephen J.B., di Cocco G., Fiore F., Dean A.J., 2003, ApJ, 589, L17
- Meier D.L. (1999) Meier D.L., 1999, ApJ, 522, 753
- Meier D.L. (2001) Meier D.L., 2001, ApJ, 548, L9
- McLure et al (2006) McLure R.J., Jarvis M.J., Targett T.A., Dunlop J.S., Best P.N., submitted to MNRAS (preprint astro-ph/0510121)
- McLure & Dunlop (2004) McLure R.J., Dunlop J.S., 2004, MNRAS, 352, 1390
- Miniutti & Fabian (2006) Miniutti G., Fabian A.C., 2006, MNRAS, 366, 115
- Nandra & Pounds (1994) Nandra K., Pounds K., 1994, MNRAS, 268, 405
- Narayan & Yi (1995) Narayan R., Yi I., 1995, ApJ, 444, 231
- Orr & Browne (1982) Orr M.J.L¿, Browne I.W.A., 1982, MNRAS, 200, 1067
- Pointecouteau (2004) Pointecouteau E., Arnaud M., Kaastra J., de Plaa J., 2004, A&A, 423, 33
- Porquet et al. (2004) Porquet D., Reeves J.N., Uttley P., Turner T.J., 2004, MNRAS, 427, 101
- Protassov et al. (2002) Protassov R., van Dyk D.A., Connors A., Kashyap V.L., Siemiginowska A., 2002, ApJ, 571, 545
- Ross & Fabian (2005) Ross R.R., Fabian A.C., 2005, MNRAS, 358, 211
- Rudy et al. (1984) Rudy R.J., Schmidt G.D., Stockman H.S., Tokunaga A.T., 1984, ApJ, 278, 530
- Rudy, Puetter & Mazuk (1999) Rudy R.J., Puetter R.C., Mazuk S., 1999, AJ, 118, 666
- Sambruna et al. (2006) Sambruna R.M., Gliozzi M., Donato D., Maraschi L., Tavecchio F., Cheung C.C., Urry C.M., Wardle J.F.C., 2006, ApJ, 641, 717
- Sanderson, Finoguenov & Mohr (2005) Sanderson A.J.R., Finoguenov A., Mohr J.J., 2005, ApJ, 630, 191
- Schlegel, Finkbeiner, Davis (1998) Schlegel D.J., Finkbeiner D.P., Davis M., 1998, ApJ, 500, 525
- Simpson (2003) Simpson C., 2003, New. Astron. Rev., 47, 211
- Singal (1996) Singal A.K., 1996, MNRAS, 278, 1069
- Spinrad et al. (1985) Spinrad H., Marr J., Aguilar L., Djorgovski S., 1985, PASP, 97, 932
- Sun et al. (2003) Sun M., Jones C., Murray S.S., Allen S.W., Fabian A.C., Edge A.C., 2003, ApJ, 587, 619
- Willot et al. (2000) Willot C.J., Rawlings S., Blundell K.M., Lacy M., 2000, MNRAS, 316, 449
- Woźniak et al. (1998) Woźniak O.R., Zdziarski A.A., Smith D., Madjeski G.M., Johnson W.M., 1998, MNRAS, 299, 449
- Yaqoob & Padmanabhan (2004) Yaqoob T., Padmanabhan U., 2004, ApJ, 604, 63
- Yee & Oke (1978) Yee H.C.K., Oke J.B., 1978, ApJ, 226, 753