An equatorial wind from the massive young stellar object S140 IRS 1
Abstract
The discovery of the second equatorial ionized stellar wind from a massive young stellar object is reported. High resolution radio continuum maps of S140 IRS 1 reveal a highly elongated source that is perpendicular to the larger scale bipolar molecular outflow. This picture is confirmed by location of a small scale monopolar near-IR reflection nebula at the base of the blueshifted lobe. A second epoch of observations over a five year baseline show little ordered outward proper motion of clumps as would have been expected for a jet. A third epoch, taken only 50 days after the second, did show significant changes in the radio morphology. These radio properties can all be understood in the context of an equatorial wind driven by radiation pressure from the central star and inner disc acting on the gas in the surface layers of the disc as proposed by Drew et al. (1998). This equatorial wind system is briefly compared with the one in S106IR, and contrasted with other massive young stellar objects that drive ionized jets.
1 Introduction
Mass-loss appears to be an integral part of the star formation process. It is likely to play a major role in setting the final mass of the star by reversing the infall and therefore in determination of the IMF. Luminous (104 L☉) young stellar objects (YSOs) not only drive the well-known large-scale bipolar molecular outflows (e.g. Lada 1985; Beuther et al. 2002), but also have small-scale ionized stellar winds. These are weak ( few mJy) and compact ( 1″) radio sources (e.g. Tofani et al. 1995). They are distinguished from ultra-compact H II regions (UCHIIs) observationally by their radio spectral index that is usually close to that expected for a stellar wind of +0.6 (Simon et al. 1983; Wright & Barlow 1975) compared to +2 for optically thick H II regions. More conclusively, stellar wind sources have broad (few 100 kms-1), optically thick, near-IR H I emission lines (Persson et al. 1984; Bunn et al. 1995), whilst these lines in UCHIIs are optically thin and a few 10s kms-1 broad (e.g. Lumsden & Hoare 1996). Theoretically of course, the origin of the stellar wind material is from the star and/or disc itself, whilst the later UCHII region phase begins when significant surrounding molecular cloud gas has been ionized. Objects classified as hyper-compact H II regions have intermediate properties and may represent a transition phase (see review by Hoare et al. 2006).
The ability to resolve the radio emission from the stellar wind sources means that insights can be gained into the geometry of the mass-loss. It is of particular interest to discover the relationship, if any, between the ionized wind close to the star, and the much larger scale bipolar molecular outflows that are invariably associated with massive YSOs. In low-mass YSOs, the bipolar molecular outflows are often accompanied by highly collimated stellar jets. These optical/IR jets ends in bow shocks that appear to be responsible for driving the molecular outflows in many cases (Chernin & Masson 1995), although not necessarily all (Lee et al. 2001). One may expect highly collimated MHD driven jets to be less common in more massive stars since magnetic fields are generally believed to play less of a role compared to radiation pressure throughout their lives.
Indeed, evidence for such highly collimated jets from high-mass YSOs has been much harder to come by (e.g. Poetzel et al. 1992). Searches in the optical will obviously be hindered by the heavy extinction close to the very embedded massive young stars, although searches for shocked emission further out along the outflows have also shown no signs of bow shock type emission (Alvarez & Hoare 2005). Similarly, near-IR observations of shocked molecular hydrogen do not often reveal the jet and/or cavity structures seen in low-mass YSOs (Davis et al. 1998), although see Davis et al. (2004). Radio investigations do not suffer from extinction at all and the best example of a jet from a massive YSO is the spectacular radio jet from GGD27, the exciting source that drives the HH80-81 outflow. This parsec-scale precessing radio jet which end in bow shocks was found by Martí et al. (1993). Follow-up multi-epoch studies by Martí et al. (1998) reveal proper motions of clumps in the jet, which correspond to tangential velocities of at least 500 kms-1. Such velocities are similar to the FWZI of near-IR emission lines in other massive YSOs, but unfortunately the exciting source of GGD27 cannot be seen directly at near-IR wavelengths and no wind lines have yet been seen (Aspin 1994).
Another radio jet is that in Cep A2 (Rodríguez et al. 1994) where proper motion studies yield tangential velocities of 600 kms-1 (Curiel et al. 2006). It is perpendicular to a rotating disc seen in sub-millimetre line and continuum emission (Patel et al. 2005) Some aspects of its radio morphology do not fit the jet picture well (Hoare & Garrington 1995) and is not well aligned with the major CO outflow axis in the region, although it is reasonably well aligned with an outflow in HCO+ (Gómez et al. 1999). Other possible radio jets from massive YSOs are GL 2591 (Campbell 1984; Trinidad et al. 2003), W3 IRS5 d2 (Claussen et al. 1994; Wilson et al. 2003), W75N VLA1 (Torrelles et al. 1997), and IRAS 20126+4104 (Hofner et al. 1999; Trinidad et al. 2005). These radio jets are similar to the radio jets that have been resolved in low-mass YSOs in several cases (Anglada 1996). It is then natural to suppose that the radio jets in massive YSOs originate in more a scaled-up version of the MHD driven and collimated flows invoked for low-mass objects.
However, by no means all massive YSOs possess radio jets. Observations of S106IR, the exciting source of the famous bipolar H II region S106, by Hoare et al. (1994) in fact showed the exact opposite geometry. The elongation revealed by the MERLIN observations of this source was aligned not with the outflow direction, but precisely perpendicular to it, i.e. the radio morphology was disc-like rather than jet-like. Of course, S106IR is somewhat of a unique object in that it is already powering a well-developed H II region, which in itself is unusual in having fast bipolar motions (Solf & Carsenty 1982). Hence, there is a need to resolve the ionized winds of other massive YSOs to see if such equatorial mass-loss is common or not.
Another possible equatorial wind source is GL 490. Campbell et al. (1986) resolved the 15 GHz emission from this source. It was clearly elongated perpendicular to the CO outflow and was aligned with the disc seen in later millimetre interferometric observations (Mundy & Adelman 1988; Schreyer et al. 2006), small scale reflection nebulosity (Alvarez et al. 2004a) and spectropolarimetric data (Oudmaijer et al. 2005). Peculiarly, this structure was not seen in deep 8 GHz VLA observations by Gibb & Hoare (in preparation). It is known that the radio emission from massive YSOs is mildly variable in flux (e.g. Hughes 1988) and so morphological changes have to be expected as well.
Here radio maps are presented of the second confirmed incidence of equatorial mass-loss from a massive YSO, namely S 140 IRS 1. This object is much more typical of the class of massive YSOs in that it does not yet power an H II region like S106IR. It is the most luminous of a cluster of objects seen at mid-IR (Beichman et al. 1979; Kraemer et al. 2001) and near-IR wavelengths (Evans et al. 1989; Yao et al. 1998). IRS 1 drives a strong bipolar CO outflow whose axis is in the SE-NW direction (Hayashi et al. 1987; Minchin et al. 1993), the cavity of which can be seen in the blueshifted SE lobe in C18O J=3-2 observations by Minchin et al. (1995). High spatial resolution near-IR speckle observations reveal a monopolar reflection nebula to the SE of the exciting source at the base of the blueshifted outflow cavity (Hoare et al. 1996; Schertl et al. 2000; Alvarez et al. 2004a).
The brightest of the IR sources in the embedded S140 cluster were also found to be weak radio emitters by Beichman, Becklin & Wynn-Williams (1979) and further radio sources were seen by Evans et al. (1989). High resolution radio observations were made by Schwartz (1989) which revealed that IRS 1 was elongated in SW-NE direction for the first time. At 5 GHz the core was about 1″ long with weaker emission extending a further couple of arcseconds to the SW. Schwartz (1989) interpreted this morphology as a core-jet structure. He extended this picture further by interpreting another diffuse patch of radio emission 8″ to the SW as a radio HH object. However, Schwartz himself articulates the potential flaw in this picture since this would mean that the jet is perpendicular to the outflow and thus contradicting all known models of jet production. He raised the possibility that the radio emission could originate in the ionized surface of a disc. The observations presented here finally confirm this disc-like morphology and interpretation. Tofani et al. (1995) presented a high resolution 8 GHz VLA map of S140 IRS 1 which again shows the elongated structure, this time with a significant curving of the NE end around towards the N and possibly NW direction. The data in this paper also recover this morphological detail.
2 Observations
S140 IRS 1 was first observed with a full 24 hour track with the full MERLIN array of six telescopes on 7 and 8 June 1995. The continuum frequency was 5 GHz with a bandwidth of 15 GHz in each polarization. The maximum baseline was 218 km giving a potential resolution of 50 mas. Frequent observations were made of the phase calibrator 2221+625 (B1950 name) 0.7° away. The observations were amplitude calibrated against OQ208 whose flux density was found to be 2.40 Jy in relation to 3C 286 whose flux density was assumed to be 7.38 Jy. Amplitude and phase corrections derived from mapping the phase calibrator were interpolated and applied to S140 IRS 1. The target was then mapped and CLEANed to produce the final images. In the first epoch observations the phase centre was at =22h 17m 41.5s and =+63°03′47.5″(B1950) to place it in the middle of the cluster of radio sources seen by Schwartz (1989).
The second epoch observations took place on 3 March 2000 with exactly the same setup and phase calibrator as before, but with the phase centre now at S140 IRS 1 itself. The amplitude calibrator 0552+398 (B1950) was found to have a flux of 5.92 Jy. These observations were repeated seven weeks later on 21 and 22 April 2000. The amplitude calibration of these observations appeared to be affected by rain during the observation of 3C286 and so the flux of 0552+398 was assumed to be the same as in the March 2000 observations. Maps were made with a variety of reference antennae and time ranges to assess the effect of the weather on the maps, but there was no significant difference. The noise level in all the maps was about 60 mJy per beam.
3 Results
3.1 First Epoch
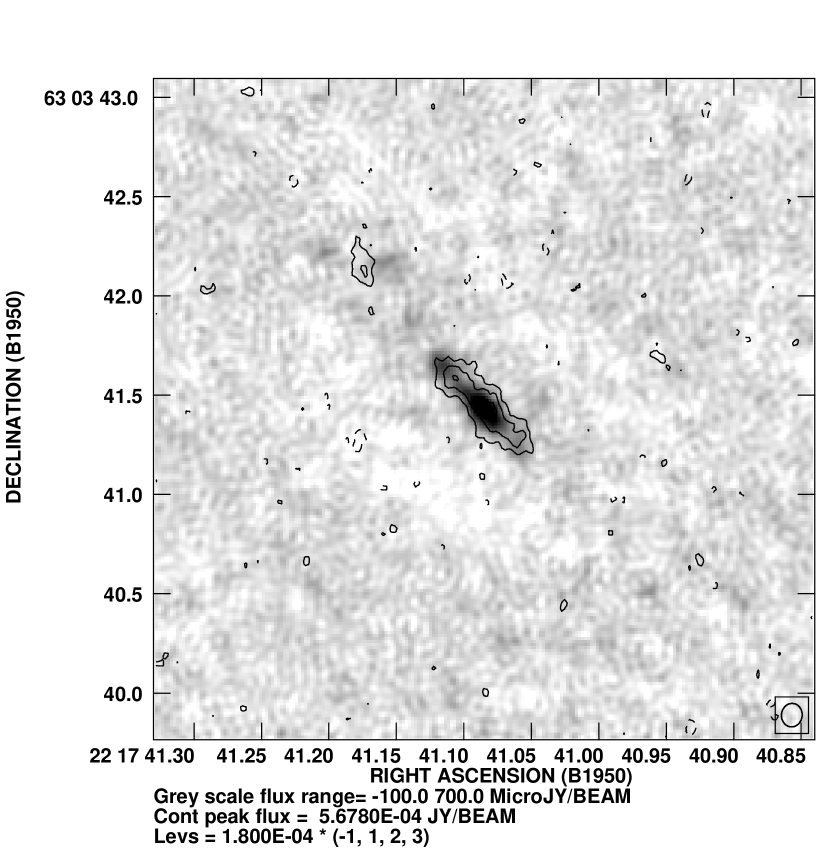
The 5 GHz MERLIN map from the first observation in June 1995 is shown in Figure 1. A 5M Gaussian taper has been applied to the data before making this map, the source being somewhat over-resolved at the full 50 mas resolution. The noise level in the map is 54 Jy per beam. This is about 50 per cent higher than the theoretically expected value, but that is to be expected since the bright H II region S 140 itself is in the primary beam. The peak flux of 0.89 mJy per beam corresponds to a peak brightness temperature of 3800 K which is similar to that found for the Herbig Be star MWC 297 (Drew et al. 1997), but lower than that for the other equatorial wind system S106IR (Hoare et al. 1994). The integrated flux is 3.60.3 mJy. A highly elongated structure is clearly seen at a position angle (PA) of about 44°. It is barely resolved in the minor axis and has a deconvolved axial ratio of about 7:1. The parameters derived from a Gaussian fit to the source in the first epoch are given in Table 1.
| Date | RA | Dec | FWHM | PA | Flux |
|---|---|---|---|---|---|
| 22h17m | +63°03′ | (″) | (°) | (mJy) | |
| 7/4/1995 | 41088000014 | 414560010 | 0.4750.0310.1240.008 | 43.71.5 | 3.60.3 |
| 3/3/2000 | 41085000021 | 414490015 | 0.5210.0470.1490.014 | 43.12.3 | 3.40.5 |
| 21/4/2000 | 41077300009 | 413930007 | 0.4830.0170.1240.004 | 43.71.5 | 3.60.3 |

The size and position angle agree well with the observations of Schwartz (1989) and Tofani et al. (1995), but the structure is now clearly seen at this high resolution. It is not a smooth structure but appears to contain clumps, most notably the one that is 030 NE of the peak. However, at this high interferometric resolution such clumping can appear artificially enhanced. Further over-resolved clumps appear to curve away to the NE and N; the most prominent being at a position of 22h17m41155 and +63°03′4218. These appear to follow the curving northerly structure seen in the 8 GHz VLA map by Tofani et al. (1995) and it is not surprising that this more diffuse structure is over-resolved in the MERLIN map.
The total 5 GHz flux is significantly higher than the 2.20.4 mJy quoted by Schwartz (1989) for the core observed in 1987. There is no sign of the ’jet’ that Schwartz saw to the SW with another 2.70.4 mJy, but it is quite a diffuse structure in the VLA map and so is likely to be resolved out here. Tofani et al. found an integrated flux of 7.90.7 mJy at 8.4 GHz. The spectral index of the core from Schwartz (1989) is 0.940.23, which predicts a total 5 GHz flux of 4.80.6 mJy. This is somewhat higher than seen here, but one would expect some of the flux seen by the VLA to be resolved out. Hence, it is possible that there has been some mild flux variability in S140 IRS 1 similar to that seen in other massive YSOs like Cep A2 (Hughes 1988). However, it is difficult to draw firm flux variability conclusions from interferometric observations taken at different frequencies with different arrays.
3.2 Multi-Epoch Observations

To attempt to further clarify the nature of the wind emission in S140 IRS 1, second epoch observations were carried out over a 5 year baseline sufficient to look for proper motions in gas that is moving with velocities of order 100 kms-1. The second epoch MERLIN image is shown in Figure 2 and it is overlaid on a greyscale version of the first epoch image from Figure 1 in Figure 3. A 4M Gaussian taper has been applied when making this image to deliver a similar size beam to that of the first epoch. It can be seen from Figure 3 that the overall size and structure of the source has remained the same and Table 1 shows that the total flux has stayed constant. However, there is now a much more even distribution of the flux throughout the elongated core with the bright central core present in the first epoch now less prominent. The overlay shows that there has been no significant proper motion of the core with a 3 upper limit of 0049. At a distance of 800 pc this corresponds to an upper limit in velocity of 39 km s-1 over the 5 year baseline.
There has been significant movement of the patch of emission at 22h17m41155, +63°03′4218, which appears to have moved almost due east by 015002. If this represents physical motion of a clump in the gas then this corresponds to a tangential velocity of 12016km s-1. Even though the measured velocity is comparable to the velocities inferred from near-IR emission line profiles for massive YSO winds the direction of motion is not that of a clump of gas moving radially outwards and is not at all like the jet motions seen in other objects. It is more consistent with a straightening or opening out of the curved structure seen in the first epoch and in Tofani et al.’s November 1992 VLA image. Since this likely to be the bright part of a larger, over-resolved structure then it is also possible that the distribution of material has remained the same but the illumination by ionizing radiation has change between the epochs to highlight a different patch (see below).

Figure 4 shows the MERLIN map just 50 days after that in Figure 2. Here the changes in morphology of the source are much more dramatic. Several checks were made to see if the periods of rain during the observations were affecting the resulting source morphology, but they did not. Small changes in morphology can occur due to different uv coverage of the same source, but all the observations were very similar full tracks. In the third epoch the emission is concentrated in a compact region to the SW of the original core position, although again the integrated flux has stayed remarkably constant (Table 1). Emission in the NE part of the elongated core is now almost absent. The patch of emission which showed significant proper motion over the previous 5 years is unchanged over this much shorter interval. This is as expected and bolsters the significance of the other changes in morphology.
4 Discussion
So, what is the nature of the radio emission from S140 IRS 1? The highly elongated, clumpy and curving structure is highly reminiscent of the jet from the luminous YSO GGD27. However, as noted by Schwartz who first put forward the jet interpretation, there is a major problem with this in that such a jet would be perpendicular to the large scale bipolar molecular outflow in the region, which appears to be powered by IRS 1. The true nature of the radio source is revealed through high resolution observations in the near-IR. Figure 5 shows a greyscale of the MERLIN map from Figure 1 overlaid with contours of near-IR K-band (2.2) emission from a reconstructed speckle image obtained by Alvarez et al. (2004a). The unresolved near-IR point source as been arbitrarily aligned with the peak of the radio emission given the lack of accurate near-IR astrometry. The position of the 2MASS counterpart of IRS 1. is located 0.2″ E and 0.8″ S of the peak MERLIN position. Given that the extended nebular emission dominates over the point source in the K-band (Alvarez et al. 2004a) this is consistent with the adopted alignment within the errors of 2MASS, the different resolutions, techniques and optical to radio frame correspondence.
The diffuse near-IR light forms a monopolar nebula to the SE of the star, which is interpreted as a reflection nebula arising in the outflow lobe that is tilted towards us. Note that the blueshifted CO outflow lobe is the one to the SE. The scattered nature of this nebula has been confirmed by a deeper and higher resolution speckle polarimetric image taken by Schertl et al. (2000). This reflection nebula aligns well with the larger scale molecular outflow as is confirmed by a high resolution interferometric CO map obtained by Gibb, Hoare & Shepherd (in preparation), which clearly shows IRS 1 to be at the centre.
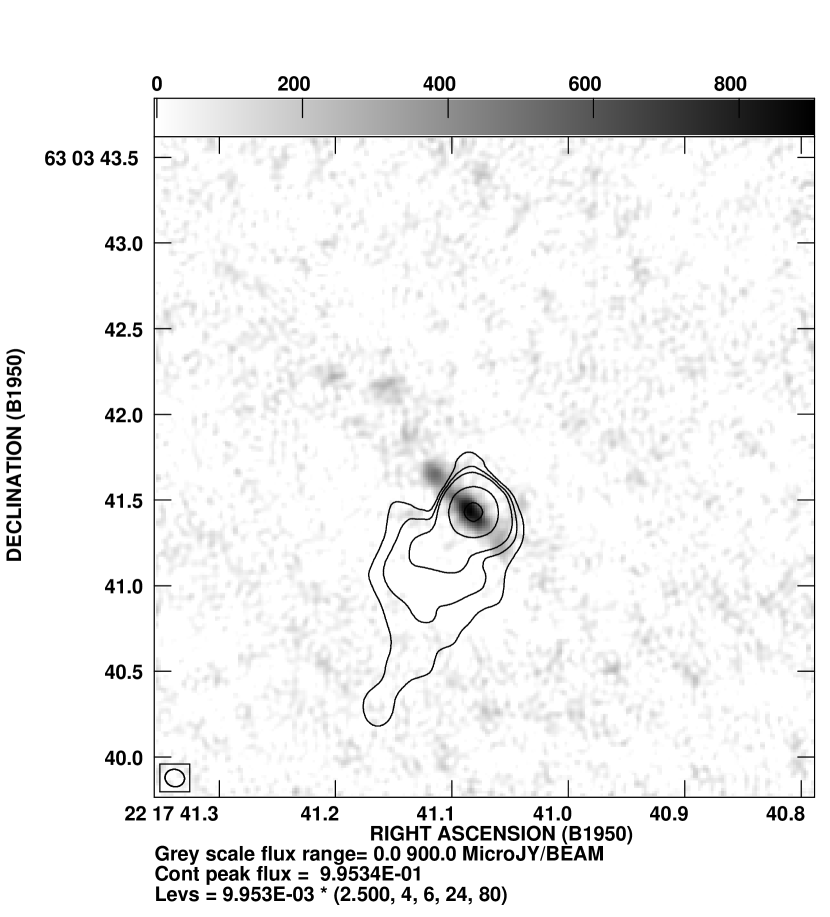
It is now clear that the radio emission from S140 IRS 1 arises in a disc-like structure perpendicular to the bipolar outflow rather than in a jet. Hence, it becomes the second definite case of an equatorial ionized wind system to be discovered in a luminous YSO after S106IR. A promising model for such an equatorial wind has been developed by Drew et al.(1998). Here the radiation pressure from the star and accretion disc can lift and accelerate material from the surface of the disc and blow it away in a predominately lateral direction. The velocities obtained for the gas where the majority of the emission is expected are of the order of a few hundred kms-1 in agreement with the widths of the near-IR emission lines in massive YSOs.
The large changes in morphology, but not flux over the short time interval between the second and third epoch MERLIN observations cannot be explained by any motion of clumps in the wind since the implied velocities would be much too fast. These rapid changes are consistent with a picture in which small changes in illumination by the ionizing source produce changes in the winds structure. Such shadowing effects are greatly enhanced in the foreshortened site lines of a central star viewed from the surface of an accretion disc. Furthermore, it is known that radiation-driven winds are inherently unstable (Owocki et al. 1988), which can produce sudden large changes in the illumination and driving force. Hence, such rapid changes in structure could be expected from a radiation-driven disc-fed wind model.
It is unlikely that the radio emission arises simply from the photoionized surface of the disc. The kinematics would then be dominated by disc rotation, but the near-IR emission line profiles do not appear to be easily explained by a simple accretion disc explanation, e.g. there is no sign of double-peaked profiles (Drew et al. 1993; Bunn et al. 1995). Even the first attempt to model the near-IR line profiles from the radiatively driven disc wind model of Drew et al. (1998) predicts double-peaked rather than the observed single-peaked profiles implying too high a rotational component of the motion relative to radial motion (Sim et al. 2005). In any thin disc explanation the extreme axial ratio of MERLIN observations would imply a system very close to edge-on, i.e. . At face value this would be at odds with the monopolar reflection nebula seen in the near-IR since this requires an intermediate inclination angle so that light scattered from the redshifted lobe is blocked by the inclined disc or torus (Alvarez et al. 2004b). However, the sparse nature of the MERLIN array may well resolve out diffuse emission on the minor axis. The much more fully sampled VLA map of Tofani et al. (1995) has an axial ratio of about 2:1 and hence is more consistent with the near-IR picture.
In the context of the equatorial wind scenario, the extended ’jet’ feature to the SW of the main S140 IRS 1 source seen by Schwartz (1989) needs to be re-assessed. Its nature is unclear in this scenario, but it is does appear to get much more significant at lower frequencies. The much flatter spectrum implies optically thin emission or even a shocked origin. Perhaps the equatorial wind or UV radiation field is illuminating an extended disc or torus, but it is not clear why this would occur only on one side of the object. A similarly perplexing unexplained feature is present at low frequencies in the massive YSO Cep A2 (Hoare & Garrington 1995). As for the radio source that Schwartz interprets as a ’bullet’ some 7″ to the SW of IRS 1, its position angle from IRS 1 is actually 37° and hence some way off being aligned with the elongated radio source. It also coincides with what appear to be shocked structures in the speckle image of Weigelt et al. (2002) that are not necessarily assoicated with IRS 1 at all.
A high resolution 43 GHz VLA continuum map of S140 IRS 1 shows the same elongated morphology, but at a greater position angle (Hoare 2002; Gibb & Hoare 2006 in preparation). It also has a slight twist giving it a point symmetric appearance which is often interpreted as rotation or precession. The emission from these higher frequencies will originate from deeper within the wind closer to the star. The sense of implied rotation, being counter-clockwise, is also consistent with a similar origin for the feature that curves off to the north in Fig 1 and Tofani et al.’s 8 GHz image. More speculatively it can be seen that the brighter part of the near-IR reflection nebula is on the southern side. This would be consistent with an outflow cavity illuminated by a disc inclined further in the counter-clockwise direction like in the well-studied Chameleon Infrared Nebula (Gledhill et al. 1996). There is evidence of such rotational motions in other massive YSOs. A possible change in position angle over time is seen for the jet in Cep A2 (Curiel et al. 2006). For this object it is interesting to note that the larger scale pattern of optical and near-IR bow shocks in the Cep A East outflow are also consistent with a clockwise rotation of the jet over time. They show a sequence of decreasing length (age) at PAs of 77°, 66° and 54° (Corcoran et al. 1993; Hiriart et al. 2004), although this must have occurred over much longer timescales.
One possible counter to the equatorial wind picture painted for S140 IRS 1 above is the discovery by Weigelt et al. (2002) of three bow shock structures seen to the NNE of IRS 1 that also appear to be driven by IRS 1 or a source close to it. They discuss various possibilities to explain this and conclude that a binary scenario with two mis-aligned flows is most likely. Preibisch & Smith (2002) take this further claiming that the radio source in IRS 1 is the driving source for these structures and therefore returning to a jet interpretation. The inferred rotation of the jet driving the three structures is the opposite to that inferred here for the radio source. Since the bow shocks are much weaker than the outflow indicators in the SE-NW direction they are most likely driven by a less luminous source in the vicinity of IRS 1. Thus the association of the radio source with the dominate luminosity source and outflow reasserts the disc-like interpretation.
5 Conclusions
Multi-epoch high resolution radio continuum mapping of S140 IRS 1 have shown it to be the second known example of an equatorial ionized wind from a massive YSO. The highly elongated 5 GHz emission is perpendicular to both the large scale bipolar molecular flow and the small scale monopolar near-IR reflection nebula at the base of the blueshifted lobe. Proper motion studies reveal no jet-like motions of clumps in the wind. Instead there is an apparent flattening of the curved structure on the NE side over 5 year baselines. On 50 day timescales there are also significant changes in the distribution of the radio emission whilst the total flux remains constant. The radio properties of S140 IRS 1 can be understood in terms of of the radiatively driven disc wind model put forward by Drew et al. (1998). There are some indications that the position angle of the disc is changing with time.
The question of why this source and S106IR have equatorial ionized winds whilst other massive YSOs such as GGD 27, Cep A2, G35.2N and IRAS 16547-4247 have ionized jets is not known. These objects all have many observational characteristics in common, including their luminosity. One thing that does set the jet sources apart is that they are more embedded and are not seen directly in the near-IR at all. Indeed, the central source of IRAS 16547-4247 is not even visible in the Spitzer GLIMPSE survey images. This could indicate an evolutionary trend in the younger, more embedded sources have jets, and the equatorial disc wind sets in later as the envelope is dispersed. In theoretical terms this could be interpreted as the magnetic fields required to produce highly collimated jets decaying with time and radiation pressure taking over. However, the line-of-sight extinction and near- to mid-IR colours are highly viewing angle dependent (Yorke & Bodenheimer 1999; Yorke & Sonnhalter 2002; Whitney et al. 2003) and cannot be taken as a good indication of age. Alternatively, the wind morphology and mass-loss mechanism could be set by the initial conditions such as angular momentum and magnetic fields.
To distinguish between the different scenarios to explain the dichotomy in wind morphology will require a much larger sample of massive YSOs to be resolved in their radio continuum. This is a task for the EVLA and e-MERLIN arrays. It would also be advantageous to acquire complementary velocity resolved IR H I line profiles. These yield information on the acceleration of the gas close to the source. Unfortunately, most of the jet sources are too deeply embedded to use the traditional Brackett series lines and longer wavelength probes will likely have to be deployed. Combined with multi-dimensional modelling of both the line and continuum data these data should then allow the physics behind the ionized mass-loss in massive YSOs to be unlocked.
References
- (1)
- (2) Alvarez, C., Hoare, M. G., Glindemann, A., & Richichi, A. 2004a, A&A, 427, 505
- (3) Alvarez, C., Hoare, M. G., & Lucas, P. 2004b, A&A, 419, 203
- (4) Alvarez, C., & Hoare, M. G. 2005, A&A, 440, 569
- (5) Aspin, C. 1994, A&A, 281, L29
- (6) Beichman, C. A., Becklin, E. E., & Wynn-Williams, C. G. 1979, ApJ, 232, L47
- (7) Beuther, H., Schilke, P., Sridharan, T. K., Menten, K. M., Walmsley, C. M., & Wyrowski, F. 2002, A&A, 383, 892
- (8) Bunn, J. C., Hoare, M. G., & Drew, J. E. 1995, MNRAS, 272, 364
- (9) Campbell, B. 1984, ApJ, 287, 334
- (10) Campbell, B., Persson, S. E., & McGregor, P. J. 1986, ApJ, 305, 336
- (11) Chernin, L. M., & Masson, C. R. 1995, ApJ, 455, 182
- (12) Claussen, M. J., Gaume, R. A., Johnston, K. J., & Wilson, T. L. 1994, ApJ, 424, L41
- (13) Corcoran, D., Ray, T. P., & Mundt, R. 1993, A&A, 279, 206
- (14) Curiel, S., et al. 2006, ApJ, 638, 878
- (15) Davis, C. J., Moriarty-Schieven, G., Eislöffel, J., Hoare, M. G., & Ray, T. P. 1998, AJ, 115, 1118
- (16) Davis, C. J., Varricatt, W. P., Todd, S. P., & Ramsay Howat, S. K. 2004, A&A, 425, 981
- (17) Drew, J. E., Bunn, J. C., & Hoare, M. G. 1993, MNRAS, 265, 12
- (18) Drew, J. E., Busfield, G., Hoare, M. G., Murdoch, K. A., Nixon, C. A., & Oudmaijer, R. D. 1997, MNRAS, 286, 538
- (19) Drew, J. E., Proga, D., & Stone, J. M. 1998, MNRAS, 296, L6
- (20) Evans, N. J., II, Mundy, L. G., Kutner, M. L., & Depoy, D. L. 1989, ApJ, 346, 220
- (21) Gledhill, T. M., Chrysostomou, A., & Hough, J. H. 1996, MNRAS, 282, 1418
- (22) Hayashi, M., Hasegawa, T., Omodaka, T., Hayashi, S. S., & Miyawaki, R. 1987, ApJ, 312, 327
- (23) Hiriart, D., Salas, L., & Cruz-González, I. 2004, AJ, 128, 2917
- (24) Hoare, M. G., Drew, J. E., Muxlow, T. B., & Davis, R. J. 1994, ApJ, 421, L51
- (25) Hoare, M. G., & Garrington, S. T. 1995, ApJ, 449, 874
- (26) Hoare, M. G., & Muxlow, T. B. 1996, in ASP Conf. Ser. 93, Radio Emission from the Stars and the Sun, ed. A. R. Taylor & J. M. Paredes (San Francisco: ASP), 47
- (27) Hoare, M. G., Glindemann, A., & Richichi, A. 1996, in ESO Conf. Procs., The Role of Dust in the Formation of Stars, ed. H. U. Käufl & R. Siebenmorgen (Berlin: Springer Verlag) 35
- (28) Hoare, M. G. 2002, in ASP Conf. Ser. 267, Hot Star Workshop III: The Earliest Stages of Massive Star Birth, ed. P. A. Crowther (San Fransico: ASP) 137
- (29) Hoare, M. G., Kurtz, S. E., Lizano, S., Keto, E., & Hofner, P. 2006, in Protostars and Planets V, ed. B. Reipurth, D. Jewitt, & K. Keil, (Tuscon: University of Arizona Press) in press
- (30) Höflich, P., & Wehrse, R. 1987, A&A, 185, 107
- (31) Hofner, P., Cesaroni, R., Rodríguez, L. F., & Martí J. 1999, A&A, 345, L43
- (32) Hughes, V. A. 1988, ApJ, 333, 788
- (33) Gómez, J. F., Sargent, A. I., Torrelles, J. M., Ho, P. T. P., Rodríguez, L. F., Cantó, J., & Garay, G. 1999, ApJ, 514, 287
- (34) Kraemer, K. E., Jackson, J. M., Deutsch, L. K., Kassis, M., Hora, J. L., Fazio, G. G., Hoffmann, W. F., & Dayal, A. 2001, ApJ, 561, 282
- (35) Lada, C. J. 1985, ARA&A, 23, 267
- (36) Lee, C.-F., Stone, J. M., Ostriker, E. C., & Mundy, L. G. 2001, ApJ, 557, 429
- (37) Lumsden, S. L., & Hoare, M. G. 1996, ApJ, 464, 272
- (38) Martí, J., Rodríguez, L. F., & Reipurth, B. 1993, ApJ, 416, 208.
- (39) Martí, J., Rodríguez, L. F., & Reipurth, B, 1998, ApJ, 502, 337
- (40) Minchin, N. R., White, G. J., & Padman, R. 1993, A&A, 277, 595
- (41) Minchin, N. R., White, G. J., & Ward-Thompson, D. 1995, A&A, 298, 894
- (42) Mundy, L. G., & Adelman, G. A. 1988, ApJ, 329, 907
- (43) Oudmaijer, R. D., Drew, J. E., Vink, J. S. 2005, MNRAS, 364, 725
- (44) Owocki, S. P., Castor, J. I., & Rybicki, G. B. 1988, ApJ, 335, 914
- (45) Patel, N. A. et al. 2005, Nature, 437, 109
- (46) Persson, S. E., Geballe, T. R., McGregor, P. J., Edwards, S., & Lonsdale, C. J. 1984, ApJ, 286, 289
- (47) Poetzel, R., Mundt, R., & Ray, T. P. 1992, A&A, 262, 229
- (48) Preibisch, T., & Smith, M. D., 2002, A&A, 383, 540
- (49) Rodríguez, L. F., Garay, G., Curiel, S., Ramírez, S., Torrelles, J. M., & Gómez, Velázquez, A. 1994, ApJ, 430, L65
- (50) Rodríguez, L. F., Garay, G., Brooks, K. J., & Mardones, D. 2005, ApJ, 626, 953
- (51) Schertl, D., Balega, Y., Hannemann, T., Hofmann, K.-H., Preibisch, Th., & Weigelt, G. 2000, A&A, 361, L29
- (52) Schreyer, K., Semenov, D. Henning, Th., Forbrich J. 2006, ApJ, 637 L129
- (53) Schwartz, P. R. 1989, ApJ, 338, L25
- (54) Sim, S. A., Drew, J. E., & Long, K. S. 2005, MNRAS, 363, 615
- (55) Simon, M., Felli, M., Cassar, L., Fischer, J., & Massi, M. 1983, ApJ, 266, 623
- (56) Solf, J., & Carsenty, U. 1982, A&A, 113, 142
- (57) Tofani, G., Felli, M., Taylor, G.B., & Hunter, T.R. 1995, A&AS, 112, 299
- (58) Torrelles, J. M., Goméz, J. F., Rodríguez, L. F., Ho, P. T. P., Curiel, S., & Vazquez, R. 1997, ApJ, 489, 744
- (59) Trinidad, M. A., et al. 2005, AJ, 130, 2206
- (60) Trinidad, M. A., et al. 2003, ApJ, 589, 386
- (61) Weigelt, G., Balega, Y. Y., Preibisch, T., Schertl, D., & Smith, M. D. 2002, A&A, 381, 905
- (62) Wilson, T. L., Boboltz, D. A., Gaume, R. A., & Megeath, S. T. 2003, ApJ, 597, 434
- (63) Whitney, B. A., Wood, K., Bjorkman, J. E., & Wolff, M. J. 2003, ApJ, 591, 1049
- (64) Wright A. E., & Barlow M. J. 1975, MNRAS, 170, 41
- (65) Yao, Y., Ishii, M., Nagata, T., Ogawa, Y., Sato, S., Watanabe, M., & Yamashita, T. 1998, ApJ, 500, 320
- (66) Yorke, H. W., & Bodenheimer, P. 1999, ApJ, 525, 330
- (67) Yorke, H. W., & Sonnhalter, C. 2002, ApJ, 569, 846
- (68)