Feedback-Driven Evolution of the Far-Infrared Spectral Energy Distributions of Luminous and Ultraluminous Infrared Galaxies
Abstract
We calculate infrared spectral energy distributions (SEDs) from simulations of major galaxy mergers and study the effect of AGN and starburst driven feedback on the evolution of the SED as a function of time. We use a self-consistent three-dimensional radiative equilibrium code to calculate the emergent SEDs and to make images. To facilitate a simple description of our findings, we describe our results in reference to an approximate analytic solution for the far-IR SED. We focus mainly on the luminous infrared galaxy (LIRG) and ultraluminous infrared galaxy (ULIRG) phases of evolution. We contrast the SEDs of simulations performed with AGN feedback to simulations performed with starburst driven wind feedback. We find that the feedback processes critically determine the evolution of the SED. Changing the source of illumination (whether stellar or AGN) has virtually no impact on the reprocessed far-infrared SED. We find that AGN feedback is particularly effective at dispersing gas and rapidly injecting energy into the ISM. The observational signature of such powerful feedback is a warm SED. In general, simulations performed with starburst driven winds have colder spectra and reprocess more of their emission into the infrared, resulting in higher infrared to bolometric luminosities compared to (otherwise equivalent) simulations performed with AGN feedback. We depict our results in IRAS bands, as well as in Spitzer’s MIPS bands, and in Herschel’s PACS bands.
1 Introduction
Since the IRAS satellite detected the unexpectedly high amounts of infrared emission generated by large numbers of dusty, infrared-bright galaxies now commonly dubbed as LIRGs and ULIRGs (luminous infrared galaxies, LIRGs, and ultraluminous infrared galaxies, ULIRGs, ) (Soifer et al. 1984, 1987), there has been ongoing debate about the nature of the infrared emission from these systems. These galaxies are often heavily obscured in the optical and radiate most of their energy at mid and far-infrared wavelengths. As such, much of our observational understanding of these dusty galaxies has derived from analyses of their infrared spectral energy distributions (SEDs).
A number of approaches have been adopted to study the infrared SEDs of LIRGs and ULIRGs. One common prescription has been to use infrared photometric templates (de Grijp et al. 1985, Xu et al. 2001, Egami et al. 2004, Lutz et al. 2005, Verma et al. 2005). A key component of these templates is the now commonly used warm-cold IRAS classification developed by de Grijp et al. (1985), wherein sources with warm () colors have been used to identify AGN. It was not immediately clear from these templates what physical cause is responsible for this classification or how to interpret these templates within the context of self-consistent radiative transfer solutions. The infrared emission for static density distributions has been calculated self-consistently (Efstathiou & Rowan-Robinson 1995, Silva et al. 1998) assuming that axisymmetric structures approximately represent the structure of galaxies. More recently, approximate semi-analytical models of the evolution of galaxies, in particular the starburst component, have been included, and axisymmetric radiative transfer calculations (Granato et al. 2000, Efstathiou et al. 2000) and templates derived from such solutions (Farrah et al. 2002, Farrah et al. 2003) have been presented.
However, observations paint a compelling picture of these galaxies having a complex dynamical history, mediated by mergers and periods of strong gas inflow and outflow (Soifer et al. 2000, Goldader et al. 2002, Downes & Solomon 1998, Scoville et al. 1998, Soifer et al. 1999, Scoville et al. 2000, Surace et al. 2000, Surace & Sanders 1999, Rupke et al. 2005a). This scenario is supported by simulations demonstrating that tidal interactions during a major merger cause gas inflows by gravitational torques (e.g. Barnes & Hernquist 1991, 1996), leading to nuclear starbursts (e.g. Mihos & Hernquist 1994, 1996). The early observations of the relics of mergers prompted Sanders et al. (1988) to suggest a phenomenological model - where ULIRGs would eventually become optically visible quasars once their obscuring layers of dust were shed by supernova explosions, stellar winds, and radiation pressure. By and large, the common wisdom regarding the warm-cold classification seems to derive from the idea that the strength of the intrinsic radiation field from the AGN is responsible for the higher frequency emission (Farrah et al. 2005, Verma et al. 2005), and that other sources of radiation, like that from a starburst, cannot be.
What is lacking so far is a self-consistent radiative transfer calculation of the infrared emission of merging galaxies that recognizes the wealth of observations that catalog their dynamically active history. Recent merger simulations incorporating feedback from central black holes have captured in detail their highly dynamical evolution (Springel et al. 2005a,b) and the relation between mergers and quasar populations in optical and x-ray observations (Hopkins et al. 2006b,c). Moreover, simulations like these have been successful at reproducing massive galaxies at high redshifts (Nagamine et al. 2005a,b; Finlator et al. 2006; Night et al. 2006). Recently, Cox et al. (2006b) have performed a number of simulations with starburst driven wind feedback to analyze the effects of this process during mergers. These simulations along with the simulations performed with AGN feedback allow us to calculate the effects of AGN and starburst feedback on the time evolution of the infrared SED.
Our approach here in calculating the infrared SED improves on previous work in two important respects: 1) we use information from simulations that follow the dynamical evolution of merging galaxies without using semi-analytic prescriptions as in prior work, and 2) we have solved for the dust thermal emission self-consistently by using a 3-d radiative equilibrium code. Our calculations here are the , i.e., wherein the dust temperature is calculated on the basis of radiative equilibrium, calculations of the infrared emission of dusty galaxies which utilize dynamical information from SPH merger simulations. To facilitate a simple and intuitive description of our results, we use an analytic solution for the far-IR SED (Chakrabarti & McKee 2005, henceforth CM05) to approximately describe how the shapes of the emergent SEDs depend on the intrinsic source parameters, namely the luminosity to gas mass ratio () and the surface gas density (). Our goal in this preliminary study is to broadly explore the large-scale differences between AGN and starburst driven feedback on the SED. We focus our discussion here on the differences in the colors for these two kinds of feedback. We also depict our results in the Spitzer Space Telescope’s MIPS and Herschel Space Observatory’s PACS bands. We do not attempt to give a prescription to determine the stage of evolution during the merger from the infrared colors. We investigate this problem, i.e., reverse engineering the stage of evolution from multiwavelength colors, in a future paper, where we calculate the entire spectrum, from X-rays to the infrared, for a large set of merger simulations.
In §2, we review the methodology of the merger simulations and describe how to translate the Smooth Particle Hydrodynamics (SPH) information to the spatial grid that we use to do the radiative transfer calculations. We use a new prescription for the cold gas, which is motivated by turbulent, rather than purely thermal support for molecular clouds. In §3, we review our methodology for the radiative transfer calculations and the dust model we have adopted. §4 is dedicated to an enumeration of our results. In §5, we present some qualitative arguments to describe the effect of feedback on the gas distribution in the galaxy. We also point out the current limitations of our treatment owing to the finite resolution of the simulations, and preliminary analysis of radiative transfer effects. §6 gives our main conclusions.
2 Merger Simulations
We employ a new version of the parallel TreeSPH code GADGET-2 (Springel 2005), which uses an entropy-conserving formulation of smoothed particle hydrodynamics (Springel & Hernquist 2002), and includes a sub-resolution, multiphase model of the dense interstellar medium (ISM) to describe star formation (Springel & Hernquist 2003, henceforth SH03). The multiphase gas is pressurized by feedback from supernovae, allowing us to stably evolve even pure gas disks (see, e.g. Robertson et al. 2004). Black holes are represented by “sink” particles that accrete gas, with an accretion rate estimated using a Bondi-Hoyle-Lyttleton parameterization, with an upper limit equal to the Eddington rate (Springel et al. 2005b). The bolometric luminosity of the black hole is then , where is the radiative efficiency. We further allow a small fraction () of to couple dynamically to the gas as thermal energy. This fraction is a free parameter, determined in Di Matteo et al. (2005) by matching the - relation. We do not attempt to resolve the gas distribution immediately around the black hole, but instead assume that the time-averaged accretion can be estimated from the gas on the scale of our spatial resolution, which is a few tens of parsecs in the best cases.
We generate two stable, isolated disk galaxies, each with an extended dark matter halo having a Hernquist (1990) profile and an exponential disk. Our simulation is one of the series described in detail in Cox et al. (2006a), with virial velocity , a fiducial choice with a rotation curve and mass similar to the Milky Way. We begin our simulation with 40 % (by mass) gas disks, which may correspond to local ULIRGs. The galaxies are then set to collide in a relative inclination of 60 degrees with zero orbital energy and a pericenter separation of . We study here the evolution of the galaxy in the main outflow phase, close to the final merger of the two black holes. The starburst simulations we analyze are in all respects identical to the simulation performed with AGN feedback (which we denote “AGN”) except that the feedback owes solely to starburst driven winds. These simulations are described in Cox et al. (2006b). In these simulations, starburst driven feedback is prescribed in terms of two independent parameters, , the wind velocity, and the mass loading efficiency of the wind (SH03). We consider here three starburst simulations which cover a range of parameters: SB1 () has a very low mass loading efficiency, SB9 (), which has moderate mass loading efficiency, and SB10 (), which has high mass loading efficiency and is nearly so high that further increase would cause too much gas would be expelled to produce a significant burst (as shown in Figure 10 of Cox et al. [2006b] - which depicts the two-dimensional parameter space; specifically, it demaracates the region of parameter space, where too much gas is removed for there to be a significant burst, for any range of wind velocity). We are motivated to focus our discussion on as the fiducial wind velocity, as the median wind velocities observed in a large sample of LIRGs and ULIRGs by Rupke (et al. 2005a) found similar median velocities. It is important to note that for our analysis here, we consider either simulations with only AGN feedback (the “AGN” simulation) or simulations with only starburst driven feedback (the SB series).
2.1 Specification of the Interstellar Medium
Owing to the limited resolution of current numerical simulations, the interstellar medium (ISM) must be tracked in a volume-averaged manner. In particular, the simulations discussed here adopt the multiphase model of SH03, in which individual SPH particles represent a region of the ISM that contains cold clouds embedded in a diffuse hot medium. Because the SPH calculation uses only the volume-averaged pressure, temperature, and density to evolve the hydrodynamics, this model does not provide specific information regarding the cold clumps. Since these cold clumps harbor the dust that produces the infrared emission, we must adopt a model which determines their number, density, and size, and location. (Our approach is similar to that employed by Narayanan et al. [2006] in their study of the evolution of the molecular gas in mergers.)
As the first step to specify the properties of the cold, dense gas, we assume that each SPH particle contains one dense molecular cloud at its center. Because we know the temperature and density of the volume-average SPH particle, assuming a temperature (say, , as was assumed in SH03) for this cold cloud and that it exists in pressure equilibrium with the hot phase we readily attain its density. However, observations of molecular clouds indicate that their pressure is dominated by turbulent motions, rather than thermal energy, and thus neglecting this feature yields very dense clouds, with small volume filling factors. In the work presented here, we take the turbulent pressure to be times that of the thermal pressure. (We took this ratio to be 100 in the simulations presented here - we have also varied this ratio by a factor of several on either side to find no qualitative differences). With this assumption, the density is much lower than without the turbulent support and its volume filling factor is greatly increased.
This prescription for turbulent support is consistent with observations and models of GMCs. In a recent review on GMCs, Blitz et al. (2006) note that the size-line width relation observed in our galaxy (Solomon et al. 1987) owes to the turbulent nature of the gas inside GMCs and agrees roughly with measurements of extragalactic GMCs. In a detailed study of the starburst galaxy M64, Rosolowsky & Blitz (2005) find that the GMCs are virialized (), but that there are some key differences in the line-width size relation from that found by Solomon et al.. (1987) for the Milky Way. The average linewidth they observe ( by averaging the 25 entries for their resolved clouds in their Table 3) gives a similar ratio of turbulent to thermal pressure for gas. Solomon et al.’s (1997) study of the GMCs in ULIRGs found larger linewidths still, but this is clearly an upper bound since the individual clouds are not resolved, and large scale motions, rather than internal motions will have contributed to the measurements of the line widths. Our adopted ratio of turbulent to thermal pressure is close to that for the interpretative “mist model” for GMCs proposed by Solomon et al. (1987). Therefore, although the details of the variations in the size-line width relations in extragalactic GMCs are not yet observationally clear, it is well-established that they are virialized and supersonically turbulent. As such, the inclusion of turbulent pressure in modeling the sizes of the cold clumps is observationally well justified. Our specification for the ISM is also in agreement with recent theoretical work - Krumholz & McKee (2005) derived a simple prediction for the star formation rate that agrees with the Kennicutt-Schmidt law for a diverse range of galaxies, from spiral galaxies to ULIRGs, by requiring that star formation occurs in virialized molecular clouds that are supersonically turbulent.
3 Methodology: Radiative Transfer
We use a self-consistent three-dimensional Monte Carlo radiative equilibrium code (Whitney et al. 2003), generalized to include distributed sources of radiation, to calculate the emergent SEDs and images from the merger simulations as a function of evolutionary state. The details of this generalization and its effects on the SED are discussed in a separate paper (Chakrabarti & Whitney 2007, in preparation). We review some the main points here briefly. This code incorporates the Monte Carlo radiative equilibrium routine developed by Bjorkman & Wood (2001) to solve for the equilibrium temperature of the dust grains. Individual photons are tracked directly in the Monte Carlo scheme. When a photon is absorbed by a grid cell, it may raise the temperature of that grid cell so that it emits infrared radiation; the emissivity of this grid cell depends on the temperature. The Bjorkman & Wood (2001) algorithm corrects the temperature in a grid cell by sampling the new photon frequency from the difference of two emissivity functions - that from the previous temperature and that computed with the new temperature. While this is not an explicitly iterative scheme, a sufficiently large number of photons must be absorbed by the grid cells so that they eventually relax to an equlibrium temperature. Since the density within a grid cell is constant, one can easily integrate the optical depth through the grid to account for the attenuation of the photons. This code is capable of treating scattering as well, which is particularly relevant for the shorter wavelengths. Since we focus on the far-IR here, and the scattering efficiency varies as , we have neglected scattering in these calculations. In a forthcoming paper on panchromatic SEDs (which span the range from optical to millimeter wavelengths) of submillimeter galaxies (Chakrabarti et al 2006b), we include scattering along with the absorption and re-emission processes to calculate the emergent SEDs. Whitney et al. (2003) carried out convergence studies to compare their results to a set of benchmark calculations developed for spherically symmetric codes. Chakrabarti & Whitney (2007, in prep) have carried out both photon and grid resolution convergence studies to verify that photon numbers of order yield converged results from mm to near-IR wavelengths for the three-dimensional grids we have used here; the grid resolution was varied by almost an order of magnitude to find reasonably converged results. For fine grid structures, it is necessary to increase the photon number proportionately to ensure that each grid cell receives enough photons to reach an equlibrium temperature (i.e., the photon and grid resolution studies are not independent). Off-nuclear sources of radiation are allocated photons in proportion to the fraction of bolometric luminosity they contribute. The radiative equilibrium temperature calculation needs to be referenced to the total bolometric luminosity of all of the sources of radiation. For large three-dimensional grids, it is crucial to allocate tens of millions of photons for the grid cells to reach an equilibrium temperature; otherwise, the emissivity of the dust may be artificially lowered. This code incorporates a “peeling-off” algorithm (Yusef-Zadeh, Morris & White 1984; Wood & Reynolds 1999) to calculate the images, which are then convolved with broadband filter functions.
The merger simulations, as discussed previously, directly track the mean SPH gas density. We take the breakdown in the cold gas phase to represent the dust spatial distribution, i.e., we assume that the dust and gas are coupled. We have used a logarithmic grid, with . The grid resolution is set to resolve the average size of the cold gas clumps, particularly on scales of the Rosseland photosphere, as we discuss below. The Rosseland photosphere can be understood as the effective surface at the peak frequency of the SED. The outer radius is set to 10 kpc, as densities beyond several kpc are very low () and as such do not contribute to the emitted far-IR spectrum.
We model the intrinsic AGN continuum spectrum following Marconi et al. (2004), which is based on optical through hard X-ray observations (Elvis et al. 1994, George et al. 1998, Perola et al. 2002, Telfer et al. 2002, Ueda et al. 2003, Vignali et al. 2003), with a reflection component generated by the PEXRAV model (Magdziarz & Zdziarski 1995). Since we focus on the reprocessed far-IR SED here, the details of the intrinsic AGN spectrum as well as the intrinsic starburst spectrum are, for our purposes, not of much consequence. As discussed in CM05, if the source of radiation is obscured, as is the case here, the reprocessed spectrum is approximately independent of the intrinsic stellar (or AGN) spectrum. The stars composing the starburst in our calculations have an effective stellar temperature of 15,000 K - this is a fair approximation given that young stellar populations are expected to dominate the luminosity in the starburst (Bruzual & Charlot 1993). While we track photons from all of the stellar particles in the simulation which are distributed throughout the grid, the starburst in the simulations, which produces most of the luminosity from the stars, is generally compact - of order a couple of hundred pc. (At late times, the starburst is somewhat more diffuse). The compact sizes of the starbursts we find in the simulations are consistent with observations - high spatial resolution observations of the nearest ULIRGs by Soifer et al. (2000) shows that most of the mid-IR emission originates on scales of pc. If the mid-IR emission is powered by a starburst, this suggests that the starburst is compact, and on scales of pc. We have numerically verified that little change () results in the far-IR SED even when the stellar temperature (spectrum) is changed by a factor of three. To understand the near-IR and polycyclic aromatic hydrocarbon (PAH) spectrum, it is necessary to carry out stellar population synthesis modeling, as these parts of the emitted spectrum do depend on the intrinsic radiation field.
As is now well known, very small grains are subject to temperature fluctuations, so that they may not be in equilibrium with the thermal radiation field, if the amount of energy striking the grain is larger than its specific heat capacity (Purcell 1976). This leads to a probability distribution function for the temperature (rather than one temperature) for grains of size less than (Guhathakurta & Draine 1989, Siebenmorgen et al. 1992, Manske & Henning 1998). PAH heating has been treated in a way similar to the heating of very small dust grains (Manske & Henning 1998). Observationally, we do find strong PAH emission for , particularly in LIRGs (Rigopoulou et al. 1999, Brandl et al. 2004, Spoon et al. 2004, Yan et al. 2005), but little discernible PAH emission at longer wavelengths. Moreover, given that PAH emission is essentially a quantum process, i.e., it owes to the absorption of single photons and their subsequent effect, PAH emission arises only from very small grains. Such small grains and the details of their temperature fluctuations are unlikely to affect the far-IR spectrum. Therefore, in this paper, we use a simplified representation of PAH emission instead of calculating it self-consistently - if there is a UV photon of sufficient magnitude to excite PAH emission, then we add on an observed PAH template (adopted from Brandl et al. 2004) to the SED. We investigate in detail the near-IR spectrum and PAH emission in a future paper, and consider the effects of scattering of photons off dust grains, the AGN spectrum, using stellar synthesis models to compute the stellar spectra.
We use the Weingartner & Draine (2001) (henceforth WD01) dust opacity model. The mass fraction of dust is equal to for solar abundances (WD01). The long wavelength () part of WD01’s grain model has the same slope () as the Draine & Lee (1984) dust model. WD01’s models have been shown to reproduce the observed extinction curves for the Milky Way, as well as regions of low metallicity, such as the LMC and the SMC. The opacity normalization per gram of dust, ,is equal to for , where is the dust-to-gas ratio relative to solar, which we take to be unity. Dunne & Eales (2001) and Klaas et al. (2001) found that the dust-to-gas ratio for a large sample of ULIRGs is comparable to Milky Way values, when they fit two-temperature blackbodies to the far-IR SEDs. Previous work, based on fitting single temperature blackbodies had found slightly lower dust-to-gas ratios (Dunne et al. 2000) by a factor of two. The basic reason for this is that using a single temperature for the dust forces the fit to shallower opacity slopes () to match the long wavelength part of the SED. Because the derived dust mass for modified blackbody models is proportional , this results in somewhat lower dust masses (Chakrabarti & McKee, in preparation).
CM05 developed the relations between the source parameters, and (proportional to the column), and the SED variables, and that govern the shape of the SED for a spherically symmetric geometry. The SED variable is the ratio of the outer radius (beyond which the density drops sharply) to an effective Rosseland photosphere (); is the temperature at the effective Rosseland photosphere. Dust envelopes characterized by high values have higher photospheric temperatures and peak at shorter wavelengths; low envelopes are more extended (larger ), the SEDs of which do not fall as sharply, shortwards of the peak wavelength, as high sources. Both of these effects increase the “warmness” of the SEDs, by shifting the peak to shorter wavelengths (increasing ) and by lowering the effective attenuation of high frequency photons (decreasing ). In Figure 5, we depict the infrared luminosity (from integrating the SED from to ), the bolometric luminosity, and (taking the mass interior to 10 kpc) values for the cases we discuss here. For typical and values during the simulation, this gives a Rosseland photosphere of order 100 pc, somewhat larger than the hydrodynamic resolution scale of the simulations employed here. This is an approximate estimate of the Rosseland photosphere, since CM05’s formalism did not consider the effects of clumping, distributed sources, or nonspherical geometry.
4 Results: SEDs & Images of Simulations with Starburst and AGN Feedback
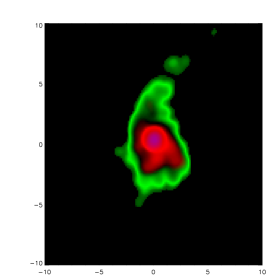
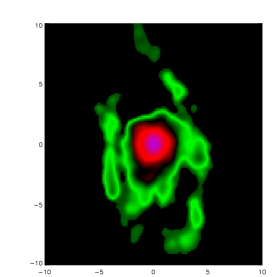
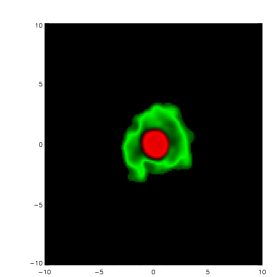
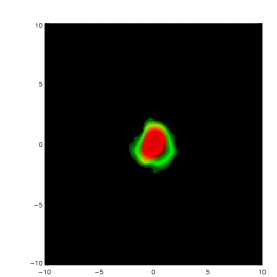
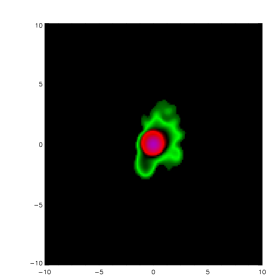
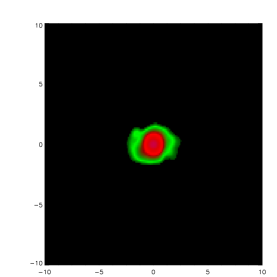
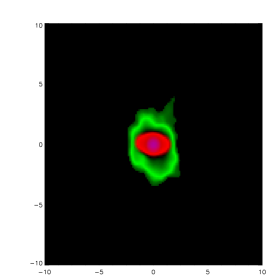
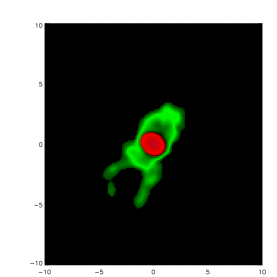
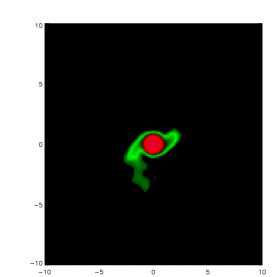
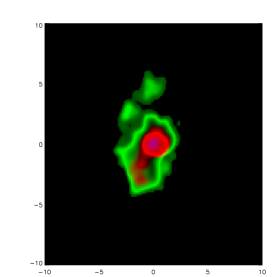
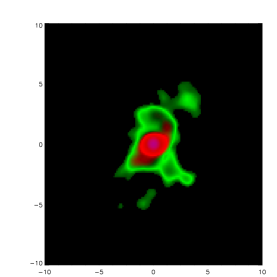
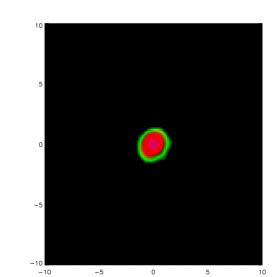
We now discuss and contrast our results for the simulation with AGN feedback and the simulations with starburst feedback, for times close to the main outflow phase. The images in the MIPS bands of the Spitzer Space Telescope (at ) are shown in Figures 1-4 for three times during the simulation - , which correspond to times before the main outflow phase, during the outflow phase, and close to the end of the outflow phase respectively. The time is given in terms of , with . The green traces the MIPS emission, the red the , and the purple the . We have adopted a distance of 77 Mpc in all of these figures and an effective angular resolution of . As such, these figures should be interpreted as visual aids and not realistic synthetic images. Figure 1a shows the image of the obscured AGN phase. Figure 1b shows the image at a time 40 after Figure 1a, when the outflow has pierced through the obscuring envelope and cleared out lines of sight. Figure 1c shows the images another 125 later, when the outflow has cleared out most of the lines of sight. For comparison, the observable quasar lightcurves of this and other similar simulations are shown in detail in Hopkins et al. (2005a,2006a) and trace a similar evolution with time and outflow phase from a heavily obscured to optically visible quasar. Figures 2, 3, and 4 depict the simulations with starburst driven feedback. Figure 5 shows the detailed time evolution of the ratio of the infrared to bolometric luminosity, along with the total infrared luminosity, and the time variation of the gas surface density. Figure 5a shows the time dependence of the ratio of the infrared luminosity (from ) to the total bolometric luminosity. The simulations performed with starburst feedback generally have higher since the optical extinctions are higher and cause more of the emission to be reprocessed into the infrared. An important point to note from Figures 5b and 5c is that the simulation with AGN feedback (solid line) has lower columns () (Figure 5c) and higher luminosities (Figure 5b) compared to the SB series. In particular, the AGN simulation loses mass quickly during its luminous phases (), while starburst feedback disperses gas more gradually (Figure 5c). As there is often much debate as to how much the black hole contributes to the total bolometric luminosity, we also depict in Figure 6 the ratio of the luminosity of the black hole relative to the total bolometric luminosity. As this plot shows, the black hole dominates the contribution to the bolometric luminosity only for a short period of time during the active phase; this trend is generally observed across a large number of simulations.
The images in Figures 1-4 show that the contribution function or characteristic emission radius varies with wavelength. CM05 calculated the contribution function for a spherically symmetric, homogeneous envelope and showed that the longer wavelengths emanate from the outer cool parts of the envelope, while the shorter wavelengths come from deeper inside the envelope, modulated by the competing effects of optical depth and the temperature gradient. Figures 1-4 illustrate this point - the emission, shown in purple, comes from the inner regions () while the emission comes primarily from the outer parts of the dust envelope. The images also show the disruptive effects of the outflow on the large scale structure of the galaxy (scales of order and larger than a kpc). The spatial distribution of the long wavelength emission in the band, which traces the large scale structure, changes considerably. However, owing to our current lack of resolution, the details of the shorter wavelength MIPS band (, shown in purple), which comes from deeper in the dust envelope, is not traced as well. The “AGN” simulation has a higher bolometric luminosity than the SB series - so the images in all the MIPS bands are correspondingly brighter.
The SEDs of the simulation with AGN feedback and the simulations starburst driven feedback (the SB series) are shown in Figures 7. We have added on a observed PAH template when the conditions described in §3 are satisfied. It is important to note that this is not a self-consistent treatment of PAH effects, and can at best be considered as a lower bound on the actual PAH emission. It does indicate however, that PAH emission is most likely to be found in LIRGs rather than ULIRGs since the extremely high levels of dust emission in ULIRGs do not allow for the PAH spectral features to be visible above the continuum. The key point to note from Figure 6 is that the SEDs of “AGN” are broader in the most luminous phase (t=1.1205 Gyr, the solid line) and do not fall as sharply on the Wien end as the SB series - this may be explained in terms of the relative difference in gas surface density, which for the “AGN” simulations is also coincident with the increase in . Another point to take note of from these figures is that there is a significant decrease in luminosity (of a factor of 10) from and for the AGN run, with a similar trend for the SB series.
Figure 8 shows the evolution of the colors as a function of time. SEDs are classified as “warm” for . The AGN simulation is generally warmer than the simulations with starburst feedback, and particularly so in the most luminous phase () (for a qualitative discussion of this, see §5). The warm SED correlates with the strong outflow phase, which suggests that feedback effects are responsible for the increase in the high frequency emission. Figure 8 also shows that there is a general trend for the SEDs to become warmer as the mass loading efficiency of the starburst winds increases - this trend also suggests that the warm-ness of the spectrum owes to feedback. At late times, all the simulations lose cold gas mass, either owing to gas dispersal by the outflow or to new star formation - this eventually leads to the colors becoming colder since there is not as much gas left to heat up to high temperatures. One important point to take note of here is that even if the source is unresolved, i.e., even if we could not construct images of the source at all wavelengths (i.e., those where the spatial resolution of the instrument does not allow us to) to see the variation of the surface brightness, the variations in give a direct clue as to the dynamical evolution of the system. The magnitude of the colors will depend also on the clumpiness internal to SPH particles, which cannot be treated here owing to the finite resolution of the simulations. The exact phase of evolution when the SEDs will become cold will depend on the mass of the galaxies - as more available gas will fuel the warm phase for a longer time. Since we consider a small subset of simulations here, we do not attempt to quantify the relative amount of time that is spent in the warm phase. We address these questions statistically in a future paper by analyzing a large number of simulations.
In Figure 9a, we show the observed colors in the MIPS band for local galaxies, and in the observed frame for galaxies at in Figure 9b. For observed frame colors of systems, “warm” corresponds to - in the rest frame, these bands are now probe a slightly different region of the spectrum. We also depict the cold-warm trend in the PACS bands of Herschel in Figures 10. In for systems at , “warm” would correspond to and for systems at , , in the observed frame. Future observations by these missions may help to discover energetically active AGN by searching for “warm” systems in these bands.
5 Discussion
We can understand the differences in the emergent SED for AGN and starburst driven feedback simulations in a simple way by considering the relative energy injection per time (the power) for these two kinds of feedback mechanisms. The energy injection by supernovae is given by: where and are and respectively. Taking , where (e.g., SH03), and taking the supernovae energy to couple with efficiency of order unity (), we see that . The black hole energy couples with efficiency which is of order 0.1 (Springel et al 2005). The amount of energy then that couples to the ISM from the black hole is given by: , where where , the fraction of the stars formed in the starburst is of order 0.1 (Marconi & Hunt 2003). With the above values, evaluates to order 0.1. If the coupling efficiency for supernovae is less than unity, as has been considered by Recchi & Matteucci (2002), it would be even more difficult to reconcile starburst driven feedback with a warm far-IR SED. The key difference in how this energy affects the medium owes to the timescales over which this energy is injected. The timescale for supernovae feedback from the starburst is roughly several hundred Myr, while the timescale for the black hole is the Salpeter time, less than 40 Myr. In essence then, the black hole delivers more power to the ISM, and has a sharper effect on the surrounding medium since energy is delivered rapidly enough to prevent effective cooling. This is graphically shown in Figure 11.
Our model of wind feedback is approximate - the parameters that we have taken to describe starburst feedback, i.e., the wind velocity and the mass loading efficiency may well depend on the microphysics of the ISM so as to be a function of both time and spatial position. However, it is worth emphasizing that the parameters that we use to prescribe the feedback are broadly consistent with observations. In a comprehensive recent survey of winds in LIRGs and ULIRGs, Rupke et al. (2005a,b) find that wind velocities are generally of order and the mass loading efficiency is of order 0.1. The mass loading efficiency is often taken to be unity in numerical simulations (Kauffmann & Charlot 1998, Aguirre et al. 2001a,b). We have varied the mass loading efficiency (from 0.005-0.5) to find significant changes result - in terms of the mass loading efficiency, these observations indicate that the SB9 and SB10 models may be the most realistic amongst the ones studied here from the SB series.
One of the main points in our presentation is that feedback effects (either from starburst winds or AGN) may well be responsible for warm SEDs. This point is evinced by the the increase in the warm-ness of the spectrum that we observe as we increase the amount of feedback (through increasing the mass loading efficiency). The effective mass loading efficiency for AGN feedback is considerably higher than for starburst feedback and is discussed in detail in Cox et al. (2006b). Moreover, the trends that we see as a function of time are intuitive - the spectrum goes from cold to warm as the outflows begin and the column of obscuring dust and gas is lowered. We have observed these trends in other simulations as well. These two points, taken together, suggest that feedback effects are responsible for the production of warm SEDs.
We have focused here on changes in the SED that are tied to dynamical effects which are tracked well by the merger simulations, i.e., the density structure on scales larger than the SPH smoothing length. Small scale structures, such as clumpiness of the ISM on scales of order tens of pc or smaller are not currently directly tracked in the simulations. It is possible that higher resolution simulations will find quantitatively different results, if they are able to better resolve the clumpiness on small scales. However, since clumpy structures are generally coincident with the outflow phase, as studied in other detailed numerical simulations of outflows (Stone et al. 1995), it is unlikely that the trends as a function of time will be different. In other words, resolving the clumpiness of small scale structures may lead to even higher frequency emission close to the outflow phase, since the optical depth of a clumpy medium is lower than that of an equivalent homogeneous medium (Natta & Panagia 1984). However, the details of the effects of clumping on the spectrum are not yet clear - although the optical depth of a clumpy medium is lower, this may be (partially) offset by the denser clumps trapping radiation more effectively. It is difficult to see how clumpiness of the ISM could alter the trends as a function of time without resorting to some ad-hoc (rather than dynamically motivated) changes in the small scale structure of the gas. However, since we have not tracked the small-scale structures - we cannot present a definitive analysis of the effects of clumping on the spectrum here. Therefore, while we find that warm SEDs are correlated with the outflow phase, we cannot rule out other processes producing warm spectra.
Finally, the trends that we observe in the simulations agree with observations. There is a general tendency for higher luminosity systems to be powered by AGN (Lutz et al. 1998, Tran et al. 2001, Charmandaris et al. 2002). However, the notion that AGN generate warm SEDs because the intrinsic hardness of the radiation field produces hot dust does not seem warranted. Temperatures of order 100 K (and higher) are often inferred in protostellar regions, which are powered by single stars or a stellar cluster (see e.g. Sridharan et al. 2002, Mueller et al. 2002, de Buizer et al. 2005, among recent references on massive protostellar regions) and have significant amounts of high frequency emission. Although the work by Rupke et al. (2005a,b) suggests that mass loading efficiency of order 0.1 is expected for local LIRGs and ULIRGs, Erb et al. (2006) deduce mass loading efficiencies larger than unity, which if valid, could in principle be enough for starbursts to produce warm SEDs, but which may suppress star formation below the ULIRG threshold.
We also note here that Hopkins et al. (2005b,2006a) analyzed a large number of simulations to find similar trends in the quasar light curves, with sharper features for the more massive systems. It will be useful to discern the phase of evolution from multiwavelength colors for quantitative interpretation of observations within the context of a dynamical model. In a future paper, we give a prescription for estimating the phase of evolution by analyzing the multiwavelength spectra (from X-rays to infrared) of a large suite of simulations designed to be representative of the local ULIRG population. We also extend this analysis to more gas rich and massive systems which may be representative of high redshift systems to quantify the statistics of sub-mm galaxies and bright X-ray and infrared sources (Chakrabarti et al 2006b).
6 Conclusion
We have used a three-dimensional self-consistent radiative equilibrium code to compare the SEDs of simulations performed with only starburst feedback with simulations that include only the effects of AGN feedback. The main points are:
1) We find that feedback, either from the AGN or starburst driven winds, is very likely the dynamical agent that is responsible for changing the shape of the far-IR SED, in particular, the colors. We also depict this trend in Spitzer’s MIPS bands and in Herschel’s PACS bands.
2) We find that, simulations performed with AGN feedback have SEDs that are warmer, particularly in their most luminous phases, relative to equivalent starburst driven simulations. The basic reason for this general difference is that the sharp energy injection from AGN over short timescales disperses gas efficiently resulting in lower columns of dust during the peak of luminosity.
3) The fraction of infrared to bolometric luminosity is generally higher for starburst driven simulations. For all other things being equal, starburst driven simulations have lower total bolometric luminosities compared to simulations with AGN feedback.
4) The presence of AGN or any source of illumination cannot be inferred from the far-IR SED alone if the source of illumination is heavily obscured such that the far-IR arises predominantly from the reprocessed emission of thermally heated dust grains. The sources of illumination (namely the AGN and the compact starburst) in the merger simulations are generally sufficiently obscured in the ULIRG phase of evolution such that this condition is met. This suggests that the warm, cold classification of the SEDs of LIRGs and ULIRGs is independent of the source of illumination.
5) Simulations performed with AGN feedback generally have lower (lower columns) and higher than otherwise equivalent simulations with starburst driven feedback, and as such have more flux on the Wien part of the spectrum.
We thank Christopher McKee for many helpful discussions, particularly on the interstellar medium, which have motivated our prescription for the ISM. We thank Jennifer Hoffman and especially Barbara Whitney for many helpful discussions on Monte Carlo radiative transfer, in particular on the treatment of multiple sources. We also thank Erik Rosolowsky for informative discussions on the structure of extragalactic GMCs. We also thank an anonymous referee for a careful reading of the manuscript and helpful suggestions. The research of SC has been supported by a NSF postdoctoral fellowship. The calculations have been performed on the Institute for Theory and Computation cluster.


References
- (1) Aguirre, A., et al. 2001, ApJ, 560, 599
- (2) Aguirre, A., et al. 2001, ApJ, 561, 521
- (3) Barnes, J.E. & Hernquist, L. 1991, ApJ, 370, L65
- (4) Barnes, J.E. & Hernquist, L. 1996, ApJ, 471, 115
- (5) Blitz, L., Fukui, Y., et al., 2006, to appear in Protostars & Planets V., astro-ph/0602600
- (6) Brandl, B.R., et al., 2004, ApJS, 154, 188
- (7) Bruzual, G.A., & Charlot, S., 1993, ApJ, 405, 538
- (8) Chakrabarti, S. & McKee, C.F., 2005, ApJ, 631,792 [CM05]
- (9) Chakrabarti, S., & McKee, C.F., in preparation
- (10) Chakrabarti, S., & Whitney, B.A., in preparation
- (11) Chakrabarti,S., et al. 2006b, submitted to ApJ, astro-ph/0610860
- (12) Charmandaris, V., et al. 2002, A&A, 391, 429
- (13) Cox, T.J., et al. 2006a, ApJ, 643, 692
- (14) Cox, T.J., et al. 2006b, in prep
- (15) De Buizer, J.M., Osorio, M., & Calvet, N., 2005, ApJ, 635, 452
- (16) De Grijp et al. 1985, Nature, 314, 240
- (17) Di Matteo, T., Springel, V., & Hernquist, L., 2005, Nature, 433, 604
- (18) Downes, D. & Solomon, P.M. 1998, ApJ, 507, 615
- (19) Draine, B.T. & Lee, H.M., 1984, ApJ, 285, 89
- (20) Dunne, L., Eales., S. et al., 2000, MNRAS, 315, 115
- (21) Dunne, L., & Eales, S.A., 2001, MNRAS, 327, 697
- (22) Efstathiou, G., & Rowan-Robinson, M., 1995, MNRAS, 273, 649
- (23) Efstathiou, G. et al. 2000, MNRAS, 313, 734
- (24) Egami, E. et al. 2004, ApJS, 154, 130
- (25) Elvis, M., et al., 1994, ApJS, 95,1
- (26) Erb, D.K., Shapley, A.E., et al., 2006, astro-ph/0602473
- (27) Farrah, D. et al. 2002, MNRAS, 335, 1163
- (28) Farrah, D. et al. 2003, MNRAS, 343, 585
- (29) Farrah, D. et al. 2005, ApJ, 626, 70
- (30) Finlator, K. et al. 2006, ApJ, 639, 672F
- (31) George, I.M., Turner, T.J., et al. 1998, ApJS, 114, 73
- (32) Goldader, J.D., Meurer, G., Heckman, T.M, et al. 2002, ApJ, 568, 651
- (33) Granato et al. 2000, ApJ, 542, 710
- (34) Guhathakurta, P., & Draine, B.T., 1989, ApJ, 345, 230
- (35) Hernquist, L, 1990, ApJ, 356, 359
- (36) Hopkins, P., et al. 2005a, ApJL, 625, L71
- (37) Hopkins, P., et al. 2005b, ApJ, 630, 716
- (38) Hopkins, P., et al. 2006a, ApJS, 163, 1
- (39) Hopkins, P., et al. 2006b, ApJS, 163, 50
- (40) Hopkins, P., et al. 2006c, ApJ, submitted, astro-ph/0602290
- (41) Kauffmann, G., & Charlot, S., 1998, MNRAS, 297, 23
- (42) Klaas, U., Haas, M., et al., 2001, A&A, 379, 823
- (43) Krumholz, M.R., & McKee, C.F., 2005, ApJ, 630, 250
- (44) Lutz, D., Spoon, H.W.W., et al., 1998, ApJ, 505, 103
- (45) Lutz, D. et al. 2005, ApJ, 632, 13
- (46) Magdziarz, P., & Zdziarski, A.A., 1995, MNRAS, 273, 837
- (47) Manske, V., & Henning, Th., 1998, A&A, 337, 85
- (48) Marconi, A., & Hunt, L., 2003, ApJ, 589, L21
- (49) Marconi, A., Risaliti, G., et al. 2004, MNRAS, 351, 169
- (50) Mihos, J.C. & Hernquist, L. 1994, ApJ, 431, L9
- (51) Mihos, J.C. & Hernquist, L. 1996, ApJ, 464, 641
- (52) Mueller, K.E., Shirley, Y.L., et al. 2002, ApJS, 143, 469
- (53) Nagamine, K. et al. 2005a, ApJ, 618, 23
- (54) Nagamine, K. et al. 2005b, ApJ, 627, 608
- (55) Narayanan, D. et al. 2006, ApJ, 642L, 107N
- (56) Natta, A., & Panagia, N., 1984, ApJ, 287, 228
- (57) Night, C. et al. 2006, MNRAS, 366, 705
- (58) Perola, G.C., et al., 2002, A&A, 389, 802
- (59) Purcell, E.M., 1976, ApJ, 206, 685
- (60) Recchi, S. & Matteucci, F., 2002, A&A 384, 799
- (61) Rigopoulou, D., Spoon, H.W.W., et al. 1999, AJ, 118, 2625
- (62) Robertson, B., et al., 2004, ApJ, 606, 32
- (63) Rosolowsky, E., & Blitz, L, 2005, ApJ, 623, 826
- (64) Rupke, D.S., Veilleux, S., & Sanders, D.B., 2005a, ApJ, 632, 751
- (65) Rupke, D.S., Veilleux, S., & Sanders, D.B., 2005b, ApJS, 160, 115
- (66) Sanders, D.B., Soifer, B.T., Elias, J.H., Neugebauer, G., & Matthews, K., 1988, ApJ, 328, L35
- (67) Scoville, N.Z., Evans, A.S., et al. 1998, ApJ, 492, L107
- (68) Scoville, N.Z., Evans, N.S., et al., 2000, AJ, 119, 991
- (69) Siebenmorgen, R., Kruegel, E., & Mathis, J.S., 1992, A& A, 266, 501
- (70) Silva et al. 1998, ApJ, 509, 103
- (71) Soifer, B.T. et al. 1984, ApJ, 278, L71
- (72) Soifer, B.T. et al. 1987, ARA&A, 25, 187
- (73) Soifer, B.T., et al., 1999, ApJ, 513, 207
- (74) Soifer, B.T. et al. 2000, AJ, 119, 509
- (75) Solomon, P.M., Rivolo, A.R., et al., 1987, ApJ, 319, 730
- (76) Solomon, P.M., Downes, D., et al. 1997, ApJ, 478, 144
- (77) Spoon, H.W.W., Moorwood, A.F.M., et al. 2004, A&A, 414, 873
- (78) Springel, V., 2005, MNRAS, 364, 1105S
- (79) Springel, V. & Hernquist, L., 2002, MNRAS, 333, 649
- (80) Springel, V. & Hernquist, L., 2003, MNRAS, 339, 289 [SH03]
- (81) Springel, V., di Matteo, T., & Hernquist, L, 2005b, MNRAS, 361, 776
- (82) Springel, V., di Matteo, T., & Hernquist, L, 2005a, ApJ, 620, L79
- (83) Sridharan, T.K., Beuther, H., et al., 2002, ApJ, 566, 931
- (84) Stone, J.M., Xu, J., & Mundy, L.G., 1995, Nature, 377, 315
- (85) Surace, J.A., Sanders, D.B., Evans, A.S., 2000, ApJ, 529, 170
- (86) Surace, J.A. & Sanders, D.B., 1999, ApJ, 512, 162
- (87) Telfer, R.C., et al., 2002, ApJ, 565, 773
- (88) Tran, Q.D., Lutz, D., et al., 2001, ApJ, 552, 527
- (89) Ueda, Y., Akiyama, M., et al., 2003, ApJ, 598, 886
- (90) Verma, A. et al. 2005, SSRv, 119, 355
- (91) Vignali, C., Brandt, W.N., & Schneider, D.P., 2003, AJ, 125, 433
- (92) Weingartner, J., & Draine, B.T., 2001, ApJ, 548, 296
- (93) Whitney, B.A., Wood, K., et al., 2003, ApJ, 598, 1079
- (94) Xu et al. 2001, ApJ, 562, 179
- (95) Yan, L., Chary, R., Armus, L, et al. 2005, ApJ, 628, 604
- (96)