Multiwavelength Observations of EXO 0748–676 – II. Emission Line Behavior
Abstract
We present optical and ultraviolet spectra, lightcurves, and Doppler tomograms of the low-mass X-ray binary EXO 0748–676. Using an extensive set of 15 emission line tomograms, we show that, along with the usual emission from the stream and “hot spot”, there is extended non-axisymmetric emission from the disk rim. Some of the emission and H and absorption features lend weight to the hypothesis that part of the stream overflows the disk rim and forms a two phase medium. The data are consistent with a 1.35M⊙ neutron star with a main sequence companion and hence a mass ratio .
1 Introduction
The low-mass X-ray binary (LMXB) EXO 0748–676 was first recognised as a transient X-ray source by EXOSAT in 1985 (Parmar et al., 1985) and an optical counterpart, UY Vol, was soon associated with it (Wade et al., 1985). Rather than returning to a quiescent state, the system has persisted in outburst since then and fits the typical pattern of the “persistent” class of objects; showing extended periods of activity lasting several years before switching off for a similar period (White, Nasage & Parmar, 1995). This intriguing behavior suggests that such systems are switching between two metastable states in an analogous situation to the Z Cam subgroup of the Dwarf Nova (DN) group of Cataclysmic Variables (CVs).
The outbursting behavior of DNe can be understood in terms of the accretion disk in the system being able to exist in two states (“hot” and “cold”) characterised by high (or conversely low) ionization, viscosity, mass throughput and luminosity (see, for example, the review of Warner 1995). Systems switch from the low state to the high at a critical surface density (or equivalently temperature) giving rise to high luminosity outbursts. Due to an hysteresis effect, the disk switches back to the low viscosity state at a second, lower, critical surface density and the disk then refills with material from the secondary. Z Cam stars exhibit “standstills” where outbursts are suspended. During these periods, the disk is maintained in a high-viscosity state. Transient LMXBs can be seen as the analogues of DNe with the central white dwarf replaced by a neutron star or black hole (see, for example, the review of King 2006). The model above must be modified to account for the effects of X-ray irradiation. This will tend to stabilise systems in the high state by reducing the critical mass-transfer rate for transition back to the low state and thus lengthen the duration of outbursts (van Paradijs, 1996; King, Kolb & Szuszkiewicz, 1997). Like Z Cam stars, the persistent LMXB systems have a sufficient mass transfer rate to maintain extended periods of high luminosity, and the smaller size of the system makes this, rather than the low state, the default configuration. Occasionally (in evolutionary terms), they transition to a low viscosity state.
The review of King (2006) explains how the observed luminosity of EXO 0748–676 implies that the neutron star has accreted since the “turn-on” in 1985. Given that the maximum disk mass that would have allowed the disk to exist in the low state is , this confirms that the system must currently be accreting in a stable “hot” configuration. The periods of reduced mass-transfer might plausibly be ascribed to starspots on the secondary (King & Cannizzo, 1998).
Systems like EXO 0748–676 hold out the prospect of allowing us to probe the nature of the (in)stability mechanism. The understanding gained could then be transferred to more volatile systems.
EXO 0748–676 has an inclination that is well-constrained by its lightcurve. The inclination must be high enough that the disk rim can generate the X-ray dips and eclipses that are observed to recur on the 3.82 hr orbital period. On the other hand, it must also be low enough that the X-ray eclipse is sharp and brief, indicating that the neutron star is visible outside of eclipse. Quantitatively, this translates to the range (Parmar et al., 1986; Hynes et al., 2006a). There is 4% residual X-ray flux during eclipse attributed to scattered emission by a small optically thin Accretion Disk Corona (ADC) (Parmar et al., 1986).
Probably the most natural place to seek the origin of the dips is the disk rim. Analysis of the gas dynamics (Flannery, 1975; Lubow & Shu, 1975, 1976) indicate that the impact of the mass-transfer stream on the disk will cause a thickening of the rim. Following the suggestion of Mason et al. (1980), modelling of the X-ray lightcurve of 2A 1822-371 (White & Holt, 1982) supported the need for such a rim structure. However, work by Frank, King & Lasota (1987) suggested that the absorbing material might actually be closer to the primary from material overflowing the disk rim. Simulations by Armitage & Livio (1996) showed that the interaction of the stream and disk did not produce enough disk thickening to prevent material flowing above and below the disk hot-spot, following a near-parabolic path and impacting at a locus of points across the disk face. This absorbing material would exist in a two-phase state as a result of an ionization instability: cool neutral clouds would coexist with a hot, ionized inter-cloud medium (Frank, King & Lasota, 1987). The crucial difference between the two models is the relative thickness of the stream and disk. In a model that considers only gravity and gas pressure, the stream will spread to have a vertical height larger than the disk and would be expected to be able to flow over the disk surface. The disk would only exhibit a limited thickening downstream from the hotspot. In contrast, the contemporary incarnation of the thick rim model invokes X-ray irradiation to heat the disk rim and cause it to puff up. In this case, the stream would be unable to significantly overflow the disk. However, this picture suffers from the difficulty that to puff up the disk to a suitable height would require X-ray temperatures in the disk mid-plane. X-ray irradiation could only achieve this if the disk were optically thin to X-rays but, if this were so, the rim would not be able to act to obscure X-rays and cause dips.
We are aware of Doppler tomograms having previously been published for 7 X-ray binaries in a high state: 2A 1822-371 (Harlaftis, Charles & Horne, 1997), Her X-1 (Still et al., 1997; Vrtilek et al., 2001), XTE J2123-058 (Hynes et al., 2001), Sco X-1 (Steeghs & Casares, 2002), Cen X-4 (Torres et al., 2002; D’Avanzo et al., 2005), AC211 (Torres, Callanan & Garcia, 2003) and XTE J1118+480 (Torres et al., 2004). This work presents a detailed study as part of a multiwavelength campaign using HST, RXTE, CTIO and Gemini with contemporaneous VLT and Magellan observations. In Paper I (Hynes et al., 2006a), we studied the burst properties of EXO 0748–676 using rapid spectroscopic and photometric data. Here, we study the accretion structure using spectra, lightcurves and Doppler tomograms from several optical and ultraviolet observations.
2 Observations
| Facility | Instrumentation | Start date | UT range | Total Obs. |
|---|---|---|---|---|
| (s) | ||||
| IUE | SWP | 1990 Dec 29 | 17:39–00:59 | 26400 |
| SWP | 1990 Dec 30 | 17:02–23:35 | 23580 | |
| SWP | 1991 Jan 6 | 15:49–21:59 | 22200 | |
| VLT | FORS2, 1400V | 2003 Feb 7 | 04:26–08:15 | 12000 |
| FORS2, 600RI | 2003 Feb 28 | 02:38–06:09 | 12000 | |
| CTIO 4 m | RCS, KPGL1 | 2003 Feb 14 | 06:17–09:31 | 10860 |
| RCS, KPGL1 | 2003 Feb 15 | 03:48–09:31 | 18600 | |
| HST | STIS, G140L | 2003 Feb 18 | 20:06–21:13 | 4000 |
| STIS, G140L | 21:20–22:35 | 4500 | ||
| STIS, G140L | 22:43–00:06 | 4970 | ||
| STIS, G230L | 2003 Feb 19 | 00:17–00:31 | 800 | |
| STIS, G140L | 00:53–01:59 | 4000 | ||
| STIS, G140L | 02:07–03:22 | 4500 | ||
| STIS, G140L | 03:29–04:52 | 4970 | ||
| STIS, G230L | 05:04–05:17 | 800 | ||
| Magellan | IMACS, 600 | 2003 Dec 14 | 07:30:06 | 900 |
| IMACS, 300 | 2003 Dec 15 | 07:08:10 | 1200 |
2.1 HST
Hubble Space Telescope (HST) observations of EXO 0748–676 were obtained on 2003 Feb 18–19 using the Space Telescope Imaging Spectrograph (STIS; Profitt et al. 2002). The observations were timed such that the target was within the continuous viewing zone (CVZ). Consequently, we were able to observe over about 9 hrs with only small gaps for wavelength calibrations and mode changes. This covered two complete binary orbits. Our coverage is summarised in Table 1.
All observations used the MAMA UV detectors in TIMETAG mode, yielding a stream of detected events with 125 s precision, which could be used to reconstruct spectra for any desired time-interval. Most observations concentrated on the far-UV, using the G140L grating. Two short observations of the near-UV region, using the G230L grating, were also obtained.
The G140L grating observations had a spectral dispersion of 0.6 Å/pixel which, combined with a resolution element varying with wavelength, gave a spectral resolution of 1.02 Å at 1200A, 0.90 Å at 1500 Å and 0.84 Å at 1700 Å. Similarly, the G230L grating had a dispersion of 1.58 Å/pixel yielding a spectral resolution of 3.5 Å at 1700 Å and 3.3 Å at 2400 Å.
All HST spectra were reduced with the standard calstis pipeline software. Where appropriate, we used inttag to divide TIMETAG exposures into sub-exposures before applying the calstis calibration. For the near-UV (G230L) observations, we found no reason to change the default settings. The G140L far-UV data, however, suffered from artifacts around the geocoronal Ly line. This occurs because the sky lines are tilted, and the default parameters are not adequate to precisely describe this. Therefore, we adjusted the tilt to fit better the 2-d spectra and moved the background regions closer to the source spectrum. This greatly improved the Ly extraction, although some small residuals are still visible.

2.2 CTIO 4 m Blanco
Optical spectroscopy was obtained on 2003 February 13–15 using the R-C grating spectrograph (RCS) on the 4 m Blanco telescope at the Cerro-Tololo Interamerican Observatory (CTIO). The KPGL1 grating was used with a wavelength coverage of 3600–6620 Å. The combination of the 1.3 arcsec slit width, a spectral dispersion of 0.95 Å/pixel and a spatial scale of 0.5 arcsec/pixel gave a spectral resolution of 2.47 Å. Initial data reduction used standard iraf111IRAF is distributed by the National Optical Astronomy Observatories, which are operated by the Association of Universities for Research in Astronomy, Inc., under cooperative agreement with the National Science Foundation. techniques for bias removal, flat fielding, and optimal extraction of the spectra.
The slit was rotated to include another star on the slit, and this was used for both relative flux calibration and relative wavelength calibration. Owing to technical difficulties, we were unable to intersperse the target observations with arc calibrations and so wavelength calibration was done only using HeNeAr arcs from the beginning of the first night, with subsequent offsets derived using absorption lines in the spectrum of the comparison star. The comparison star was calibrated relative to the spectrophotometric standard EG21 (Hamuy et al., 1992, 1994) using an observation taken at low airmass with a wide-slit. All object spectra were then calibrated relative to this.
2.3 VLT
Optical spectroscopy was also obtained on 2003 February 7 and 2003 February 28 with the Very Large Telescope (VLT) at Cerro Paranal, Chile. The first night of observation used the FORS2 spectrograph and 1400V grating with wavelength coverage 4540–5840 Å and mean dispersion of 0.637 Å/pixel; the second night the 600 RI grating with 5080–8395 Å coverage and mean dispersion of Å/pixel. Both sets of observations used a slit width of 0.4 arcsec, making slit losses significant and absolute flux calibration unreliable. With a spatial scale of 0.125 arcsec/pixel this gave a spectral resolution of 2.04 Å for night 1 and 5.18 Å for night 2.
Initial data reduction was again carried out using iraf. He + Ne and HgCd arc lines were obtained during the day before and after the observations and interpolated through the night.
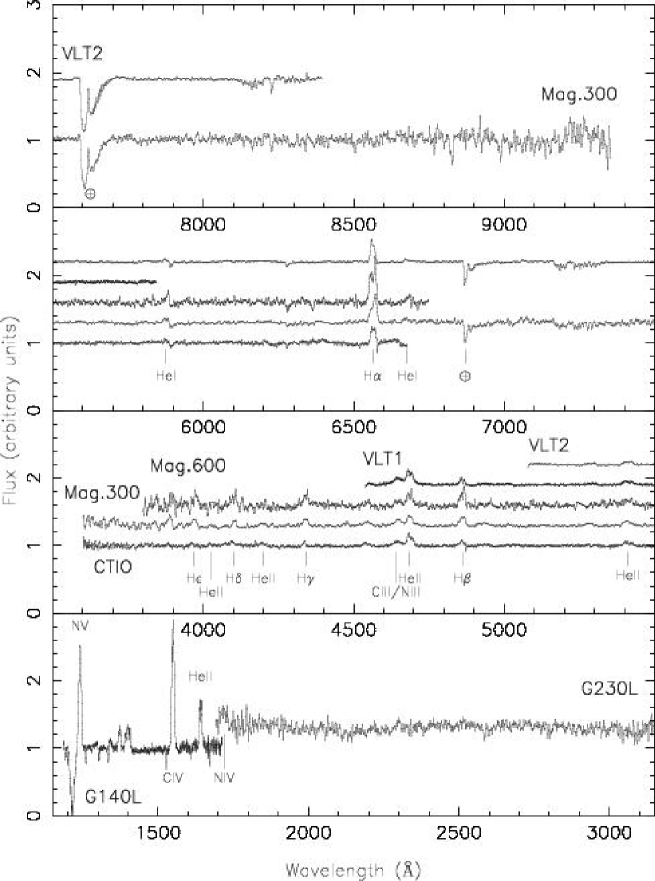
The mean spectrum from both nights of observation is shown in Figure 2.
2.4 Magellan
Two spectra were obtained with the 6.5 m Walter Baade, Magellan telescope at Las Campanas Observatory, Cerro Manqui, Chile on 2003 December 14/15. The IMACS instrument was used in f/4 configuration with a 0.7 arcsec slit and an 8k8k CCD mosaic detector operating in 22 binning mode. The low-resolution spectrum was obtained using the 300 grating with a range of 3410–9350 Å and a 1.5 A/pixel image scale giving 4.3 Å resolution. The higher-resolution spectrum was obtained using the 600 grating with a wavelength range of 3730–6830 Å, a 0.76 Å/pixel image scale and 2.0 Å resolution. Data reduction was carried out using pamela software. Both spectra are plotted in Figure 2.
2.5 Archival IUE spectra
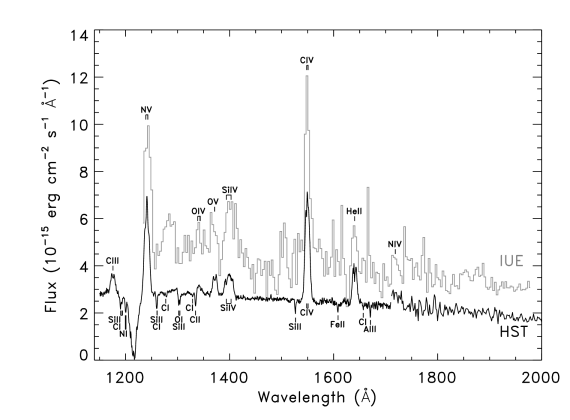
Three spectra of EXO 0748–676 were obtained using the low-resolution short-wavelength prime camera (SWP) in 1990–1991. As these have not been published previously, we extracted the newsips reprocessed spectra (Nichols & Linsky, 1996) from the archive for comparison with our new data. We constructed an exposure time weighted average. This is based on binary orbits and so should adequately represent the mean spectrum in 1990–1991. The extracted spectra are plotted alongside our HST spectra for comparison in Figure 3.
3 Analysis and discussion
3.1 Spectral characteristics
A broad range of emission lines are seen in the data, sampling a range of ionization stages and excitations. These are summarised in Table 2. In the optical, Balmer lines of HI are prominent alongside both HeI and HeII. The Bowen blend of NIII and/or CIII is clearly seen as in most LMXB spectra. The UV spectrum is also typical for an LMXB, being dominated by the strong lines of CIV and NV, alongside CIII, NIV, OIV, and OV. The line strengths seen in the far-UV show no obvious anomalies and the ratio of CIV to NV is typical; there is no indication of substantial CNO processing as seen in XTE J1118+480, for example (Haswell et al., 2002).
| Line | Transition | |||
|---|---|---|---|---|
| (eV) | (eV) | (eV) | ||
| H | 2-3 | — | 10.20 | 12.09 |
| H | 2-4 | — | 10.20 | 12.75 |
| HeII 1640 Å | 2-3 | 24.59 | 40.81 | 48.37 |
| HeII 4686 Å | 3-4 | 24.59 | 48.37 | 51.02 |
| HeII 5412 Å | 4-7 | 24.59 | 51.02 | 53.31 |
| CIII 1176 Å | 2s-2p | 24.38 | 6.50 | 17.04 |
| CIV 1549 Å | 2s-2p | 47.89 | 0.00 | 8.00 |
| NV 1240 Å | 2s-2p | 77.47 | 0.00 | 9.99 |
| OV 1371 Å | 2s-2p | 77.41 | 19.69 | 28.73 |
| SiIV 1400 Å | 3s-3p | 33.49 | 0.00 | 8.87 |
In addition to emission, there are also absorption features. Broad Ly absorption is common in all LMXBs, and may arise from the absorption in the disk atmosphere, and/or the interstellar medium. Many metallic resonance absorption lines in the far-UV are also of interstellar origin. The Na D lines are only partially resolved in the CTIO data and also blended with HeI limiting the precision with which their individual strengths can be measured. The total equivalent width is Å, with the D2 line stronger than D1. Assuming a ratio between 1:1 and 1:2, for D1:D2, implies a D2 EW of 0.3–0.4 Å, and reddening likely in the range 0.07–0.24 (Munari & Zwitter, 1997). This is comparable to, but somewhat larger than, that deduced from the 2175 Å interstellar line in the forthcoming Paper III (Hynes et al., in prep.), . The latter is probably a more reliable indicator. Both are markedly lower than the frequently quoted value of (Schoembs & Zoeschinger, 1990), but this was based on an unreliable method for an LMXB, so our lower values are more credible. The final absorption components worthy of mention are moving features, present in the Balmer lines, that originate within the binary. These will be discussed more thoroughly in Section 3.3.
Equivalent widths were measured for all the lines in Table 2 in each dataset where they were present. The values are summarised in Table 3. Where there was significant phase coverage, each set of data was binned by phase with variance weighting and then a mean spectrum derived with equal weighting for each phase bin. Error estimates were derived by making the measurement 10 times with independently selected continuum regions in each case.
| Line | EW(Å) | Line | |||||
|---|---|---|---|---|---|---|---|
| VLT1 | CTIO | VLT2 | Mag. 300 | Mag. 600 | HST | ||
| H | – | 4.182(8) | 4.930(38) | 7.942(91) | 12.966(18) | 6.511(18) | HeII 1640 Å |
| H w/o abs. | – | 4.710(8) | 5.165(10) | – | – | 3.549(10) | CIII 1176 Å |
| H | 0.249(38) | 1.008(11) | – | 2.746(65) | 4.061(94) | 18.82(19) | CIV 1549 Å |
| H w/o abs. | 1.019(5) | 1.273(10) | – | – | 4.009(36) | 16.52(10) | NV 1240 Å |
| HeII 4686 Å | 4.607(23) | 3.899(8) | – | 4.662(38) | 5.03(12) | 2.212(4) | OV 1371 Å |
| HeII 5412 Å | 1.597(7) | 1.565(20) | 1.462(5) | 2.336(32) | 1.870(21) | 4.442(44) | SiIV 1400 Å |
3.2 Lightcurves
Lightcurves were generated for several of the emission lines considered above having subtracted a polynomial fit to the local continuum in each case. These are plotted in Figure 4.

The CTIO H data presents an overall smooth symmetric lightcurve. Surprisingly, this appears to have two peaks at and with a hint of brief absorption episodes either side of the former. The H lightcurve also peaks around but the rising part of the lightcurve appears steeper than the descending section. At minimum light, the flux completely disappears as a result of the absorption feature that moves across the line profile.
In contrast to the hydrogen Balmer lines, the HeII 4686 Å line reaches a broad peak at around and reaches a sharper minimum in the range –. The HeII 1640 Å and HeII 5412 Å lightcurves shows very little coherent behavior and much scatter and the CIII 1176 Å lightcurve does not show any clear orbital modulation.
The 4 lightcurves NV 1240 Å, OV 1371 Å, SiIV 1400 Å and CIV 1549 Å show similar behavior. Each lightcurve peaks in the range – and reaches a minimum around . However, the orbital modulation is relatively weak in each case. The material producing all 6 of the ultraviolet lines appears to be visible at all phases and uneclipsed. This suggests that rather than being distributed throughout the disk, these high ionization lines arise from specific regions that are never hidden by the secondary.
Crampton et al. (1986) published a broadband B lightcurve and 3 equivalent width line lightcurves. Their H results are close to those presented here. However, their HeII 4686 Å plot contrasts strongly with ours; being similar to the H behavior. The HeII 4686 Å results derived from our CTIO data appear to be in anti-phase to this and eclipse in a similar way to the broadband lightcurve. Since the earlier results using equivalent width are effectively normalised to the continuum, their HeII 4686 Å lightcurve probably represent the behavior of the underlying continuum rather than the line behavior itself.
3.3 Trailed Spectra
Trailed spectra generated for all the emission lines considered above (summarised in Table 2) are given in Figures 5 and 6. The continuum in the region of each line was fitted with a low order polynomial and subtracted off. Normalising the flux by their continuum contributions before subtraction produced no significant differences in the results. The orbital phase was calculated using the ephemeris of Wolff et al. (2002). These data have all been binned by orbital phase and are shown over two cycles with some smoothing. A sine wave with an amplitude of has been over-plotted on each trail to guide the eye and aid in cross-comparisons. The amplitude was chosen to match the clearest observed S-wave which arises from the OV line.
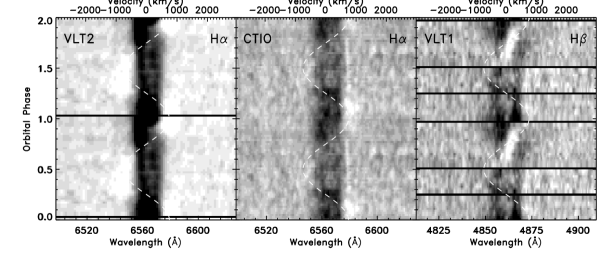
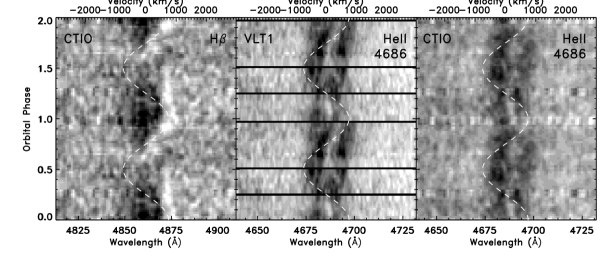
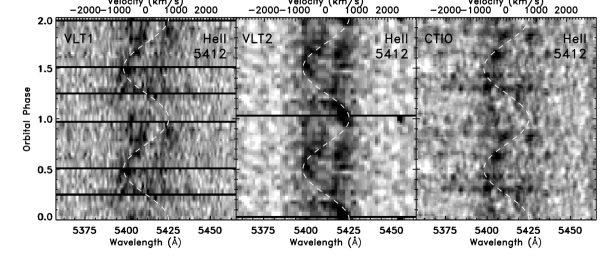
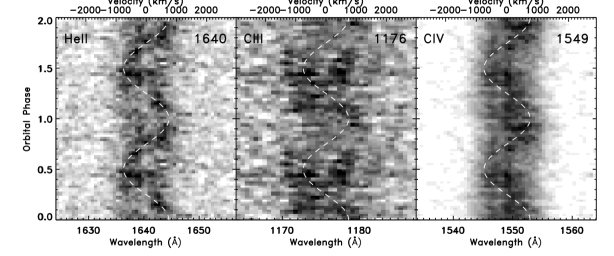
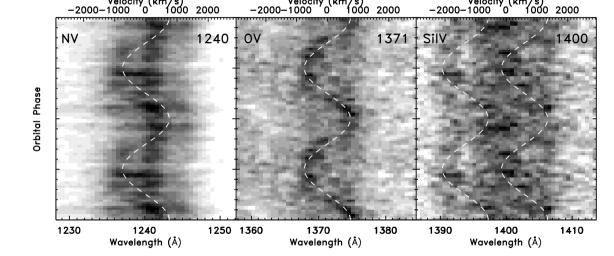
The OV S-wave is so strong as to drown out the broader structures arising from the disk. The HeII 1640 Å line shows a clear hybrid structure with an S-wave matching the OV kinematics superimposed on a double peaked profile that arises from the accretion disk. Enhanced emission along the same sinusoid can also be identified in each of the remaining UV trails. The NV line is worthy of note as the S-wave appears superimposed on a constant velocity profile close to the line centre. This may arise from a double peaked disk profile where the blueward side has slumped into the Ly absorption feature.
Looking closely at the H and H trailed spectra, there seem to be two absorption components superimposed on the emission lines. An S-wave component is clear in the VLT2 H data, less visible in the CTIO H data and also in the phase range – for the two H datasets. In the H data in particular, these align with the kinematics of the OV emission feature while the VLT1 H absorption traces a lower amplitude sinusoid. There is also a clear constant velocity component in the CTIO H data in the – range and possibly also in the VLT1 H and CTIO H data.
Sample spectra showing the motion of the absorption features from the VLT datasets are shown in Figure 7. In an attempt to increase the signal to noise ratio, the H spectra are formed from an average of 4 individual observations leading to a degree of orbital smoothing.
In H, the absorption is clearly visible to the long wavelength side of the emission line at and . At the absorption is appearing on the blue side of the profile. At and the absorption is closer to the line center but predominantly affecting the red peak of the double peaked disk profile. In H, the broad absorption feature is just apparent on the red wing at . The absorption moves into the double peaked disk profile and appears to be slightly to the blue side of the line center at . By the feature is moving back to the long wavelength side of the profile. This behavior is consistent with that shown by the only other two published spectra for this object that we are aware of (Crampton et al., 1986).

The similarity of the kinematics of the H absorption and high ionization emission lines suggests that they arise from the same region. To achieve this would require the plasma to exist in both hot and cold phases simultaneously. Such a situation was envisioned in the overflowing stream model of Frank, King & Lasota (1987) with cold blobs embedded in a hotter low density gas. However, the temperatures required in that model are much higher than that which would produce the lines we observe. It is likely, therefore, that another mechanism is at work. For example, the temperature separation may arise from differences in the efficiency of cooling between denser and rarer regions. The velocity amplitude of the H absorption in the trailed spectra clearly changes between the VLT1 and CTIO observations. While the phase range – appears similar to the H absorption, the constant velocity phases of the absorption requires a more complex explanation. With a velocity , this absorbing material has the correct velocity to be in Keplerian rotation at the circularization radius. However, it is more problematic to explain why different sections of any enhanced ring of material at this radius would be picked out with the observed phase dependence. Why, for example, do we see an S-wave absorption (from material in one region) at certain phases and then constant velocity absorption (implying material that is at that instant on the receding edge of the ring) at other phases? Qualitatively, we might understand the behavior as arising from an extended region of absorbing material along an overflowing stream. For early phases, the absorption would preferentially pick out that part of the stream obscuring the hottest (and thus brightest) part of the inner disk and consequently give rise to an approximately constant velocity component. This continues until we have passed the phase at which the point where the overflowing stream merges with the disk material no longer lies on a line between the observer and the neutron star. For the remaining phases the absorption traces out the S-wave appropriate to the merger point. Confirmation of this would require some reasonably sophisticated radiative transfer modelling. The behavior is also reminiscent of the simulated emission line kinematics produced by the method of Foulkes et al. (2004) in other as yet unpublished spectra. These models studied the eccentric, precessing accretion disks that give rise to superhumps in the SU UMa sub-group of DNe. Interestingly, the preferred mass ratio for this system (, see section 3.4.1 below) is right on the limit for which such eccentricity is possible. UU Aqr has the highest measured for a superhumping system, whereas U Gem at has only recently had a superhump period detected from a single outburst in 1985 (Baptista, Steiner & Cieslinski, 1994; Smak, 2001, 2002; Smak & Waagen, 2004; Patterson et al., 2005). Confirmation of such an explanation would require similar modelling to be undertaken with parameters appropriate to EXO 0748–676.
Other systems also show absorption in the hydrogen Balmer lines but none with the same kinematics. The SW Sex systems are CVs which show the transient absorption during the approximate phase range – (Szkody & Piché, 1990; Thorestensen et al., 1991; Warner, 1995). Similarly, H in the soft X-ray transient XTE J2123-058 shows transient absorption from –. In both cases the absorption is generally interpreted as arising from stream material overflowing the disk (Warner, 1995; Hynes et al., 2001). A contrasting LMXB system is 2A 1822-371 which shows broad absorption lines dominating and moving across the Balmer profiles in the approximate range –. Again, this is interpreted as arising from absorption by material in a vertically extended region resulting from a splash of material deflected around the hot spot (Casares et al., 2003).
Harlaftis, Charles & Horne (1997) measured a very weak FeII 6516 Å absorption feature in 2A 1822-371 at orbital phase 0.75. They ascribed this to the same “iron curtain” feature that was observed in OY Car by Horne et al. (1994). These earlier observations were taken in the ultraviolet using HST and showed a “forest of blended FeII features” that was interpreted as being due to material with supersonic, yet sub-Keplerian, velocity in the outer disk. Close examination of our optical and UV spectra show no convincing evidence for the presence of either feature in this system.
3.4 Doppler Tomograms
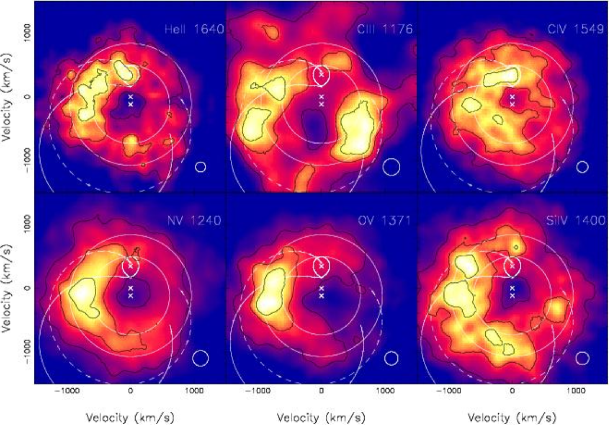
We have used the unsmoothed trailed spectra to generate Doppler tomograms using the maximum entropy technique of Marsh & Horne (1988). The tomograms formed from the optical observations are shown in Figure 8 and those from the HST observations in Figure 9. Markings on the plots were generated using , and (Model 3 of Paper I). The velocities of the centers of mass of the system and of the two stars are marked with crosses. The Roche lobe of the secondary and the Keplerian velocities at the expected edge of the disk and at the circularization radius are also plotted. Two trails are also indicated in the figure. The solid line shows the expected ballistic trajectory of material leaving the L1 point. The dot-dashed line shows the Keplerian velocity at each point that the ballistic stream would pass through.
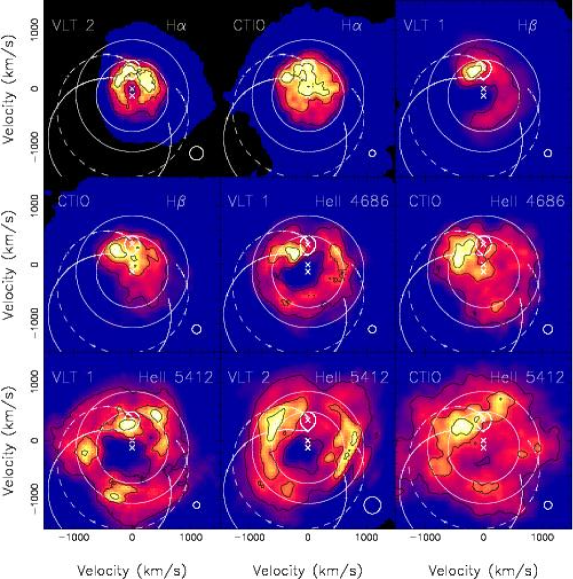
The H and H lines show consistent behavior between both the CTIO and VLT datasets with emission confined to lower velocities than we would expect for any disk material. Both lines, however, suffer from the effects of the absorption feature that mean we must treat the derived tomograms with caution. Absorption violates an assumption in the reconstructive technique: that the observed flux is positive.
The HeII 4686 Å is similar in both VLT and CTIO datasets with emission close to the ballistic stream, although the CTIO tomogram has it in a position also consistent with the edge of the disk. The HeII 5412 Å tomograms are all rather noisy reflecting the weakness of the line and difficulty in effecting an accurate continuum subtraction. Although they all show scattered knots of emission about the disk, the lack of reproducibility strongly suggests that these are noise artifacts. Each of them, however, does show emission at some point along the ballistic stream.
The HeII 1640 Å line produces good results despite being far from the strongest line. The emission is spread out in a ring consistent with emission from a disk. Emission appears to extend along the stream in a similar way to the optical He line maps. Here, however, this emission region is significantly extended around the rim of the disk.
All of the ultraviolet maps from the HST dataset also show a ring of emission consistent with a disk. A possible exception is OV 1371 Å which appears to lack emission in the orbital phase range –0.5. This may just be a relative deficit compared to the strong emission region. The NV 1240 Å line suffers from the interference of the Ly adjacent absorption which is difficult to remove with great confidence. The more isolated CIV 1549 Å would seem a better bet for a good result but, unfortunately, the line consists of two components separated by the equivalent . Convolved with the double peaked disk profile this leaves a difficult dataset to disentangle and gives rise to the filling in of emission at low velocity. The CIII 1176 Å, OV 1371 Å and SiIV 1394,1403 Å lines are all weaker, with the latter also sharing the complication of being a doublet. While the reconstruction routine does allow such doublet lines to be specified with their relative strengths there is inevitably a loss of information in such an entangled case.
The high points of emission in the CIII 1176 Å map all occur along the projected ballistic stream deep into the disk. The line is extremely weak and so potentially unreliable, however.
The high excitation line SiIV 1400 Å, CIV 1549 Å, NV 1240 Å and OV 1371 Å tomograms all show emission in the phase range –0.75. The latter two lines, with higher, but almost equal, ionization potentials, appear to come from further into the disk. None of this emission lies along the continuation of the ballistic stream or the Keplerian velocity corresponding to the stream position as envisioned by the overflowing stream model. However, it is consistent with the region downstream of the hot spot impact and/or the early part of a stream overflow.
The SiIV 1400 Å tomogram is similar to that from HeII 1640 Å. Strong emission sites are scattered around the disk rim although no emission appears along the stream.
Given the velocity resolution of the data, it is difficult to say with certainty whether the strong emission sites in the tomograms occur at velocities significantly different from that expected at the disk rim. The most reliable maps in this regard would be those from the first VLT dataset for HeII 5412 Å and HeII 4686 Å. In these maps, there is emission in the stream region. The former also shows emissions sites close to the circularization velocity. These maps, along with that for CIII 1176 Å, all hint that the stream may be overflowing the disk.
We might, alternatively, attempt to explain the velocity of the emission being in an area we would associate with disk material in terms of a thick rim model. If the disk were puffed up by X-ray irradiation, it would be natural to expect high ionization lines to appear near the rim. However, contemporaneous X-ray observations in Paper III show dips at a wide range of phases. Indeed, similar to the results of Bonnet-Bidaud et al. (2001), only the ranges – and – show a lack of dipping activity. Given azimuthal disk symmetry (or some close approximation) why would one particular phase be singled out for emission? In the overflowing stream model, this can be attributed to the different physical conditions that exist along the stream and in each region of the disk with which it interacts with increasing ionization as the central star is approached.
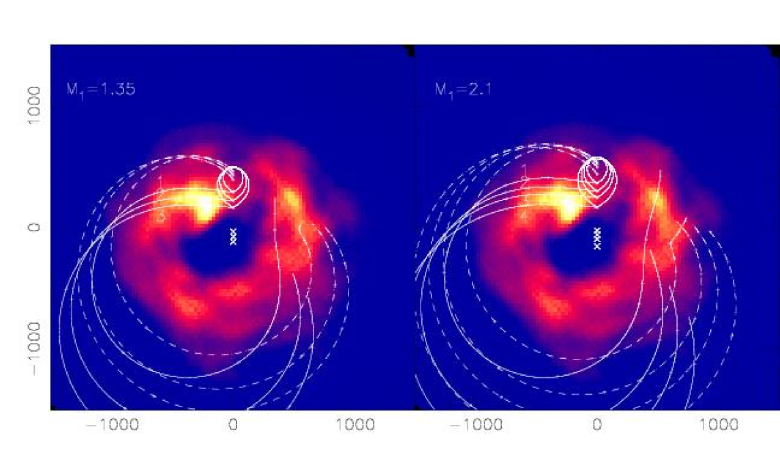
3.4.1 Constraining the Mass-ratio
We can compare the same Doppler tomograms with tracks generated using different choices for the , pairs allowed by the observed eclipses. This is useful as it is often possible to constrain further the acceptable range of (and hence ) to those consistent with identifiable features, in particular the stream. We would expect the stream emission to arise at velocities between the balistic and Keplerian value along the stream trajectory. The tomogram formed from the VLT1 observations of the HeII 4686 Å line are shown in Figure 10 with markings generated for a selection of values. For , these appear to favour values of at the high end of the range considered in Paper I and the observations are most compatible with the assumption of a main sequence secondary (, , Model 3). Özel (2006) recently proposed a lower limit . However, in that case the Model 3 ballistic trajectory barely passes through the strong emission region. To achieve the same degree of agreement as for , we would require (plotted as Model 4), approximately 80% more massive than a main sequence companion. Schenker & King (2002) showed how an overmassive secondary can arise as the result of mass transfer stripping away the secondary’s envelope to reveal a helium rich core. However, the example they give only has a maximum mass excess of around 40% and then only for , significantly smaller in both parameters than we would require. These difficulties led us to retain the assumption of a main sequence secondary with primary as the choice for the markings in Figures 8 and 9 above.
4 Conclusions
Stepping back from the details, we can attempt to identify the common features present in the dataset, focusing on the highest quality lines. Beginning with the tomograms, these appear to show two components across several lines. Firstly a ring of emission is present that can likely be associated with the accretion disk (or a coronal layer above it). Secondly, excess emission is usually present on the left hand side of the tomogram. In HeII 4686 Å, this is in the upper left quadrant and consistent with the accretion stream and/or impact point, with the implied disk radius consistent with tidal truncation. In the higher ionization resonance lines, most obviously OV and NV, this is preferentially lower in the tomogram, below the ballistic stream. This suggests emission from material carried downstream in the disk from the initial stream-impact. HeII 1640 Å appears as a hybrid of the two extremes. The velocities of the high excitation lines are lower than expected from a purely ballistic stream overflow, but appear higher than expected from material at the disk rim; they are intermediate between Keplerian velocities at the disk rim and the circularization radius, suggesting that some penetration of the disk is occurring. Lightcurves provide support for this trend. HeII 4686 Å, which appears to originate at the stream-impact point in the tomograms, is deeply eclipsed as expected, whereas the UV lines including HeII 1640 Å, which appear to originate from downstream of the stream-impact point, show no eclipses. Comparison of the stream position in the Doppler tomograms to models supports the hypothesis that the secondary is a main sequence star and the system has a mass ratio of 0.34.
Examining the trailed spectra, the OV line provides the clearest S-wave component, and appears to show least disk emission. Its S-wave can be clearly seen in trailed spectra of other lines when one allows for their multiplet structure where appropriate. Most surprising is that the same S-wave appears to trace out absorption in the Balmer lines. While it is not required that gas with the same velocity be co-spatial, if it is this points to a two-phase medium. Cool material will produce low ionization absorption lines when backlit by hotter underlying material, whereas the hot component will produce high ionization emission lines, as observed. The presence of this component in H at high velocities at both phases 0.0 and 0.5 in the VLT2 trailed spectrum indicates that absorption cannot simply be by the disk rim but must be by material above the disk, as the rim will not be backlit at .
The picture that thus emerges is that the accretion stream impacts the disk and some material overflows or penetrates it, albeit with velocities closer to the disk rim than to a purely ballistic overflow. The overflowing material forms a two-phase medium. The densest clumps remain relatively cool and produce low ionization absorption of the brighter background disk, whereas the lower density material is hotter and produces high ionization emission.
References
- Armitage & Livio (1996) Armitage, P. J., Livio, M. 1996, ApJ, 470, 1024
- Baptista, Steiner & Cieslinski (1994) Baptista, R., Steiner, J. E., Cieslinski, D. 1994, ApJ, 433, 332
- Bonnet-Bidaud et al. (2001) Bonnet-Bidaud, J. M., Haberl, F., Ferrando, P., Bennie, P. J., Kendziorra, E. 2001, A&A, 365, L282
- Casares et al. (2003) Casares, J., Steeghs, D., Hynes, R. I., Charles, P. A., O’Brien, K. 2003, ApJ, 590, 1041
- Crampton et al. (1986) Crampton, D., Cowley, A. P., Stauffer, J., Ianna, P., Hutchings, J. B. 1986, ApJ, 306, 599
- D’Avanzo et al. (2005) D’Avanzo, P., Campana, S., Casares, J., Israel, G. L., Covino, S., Charles, P. A., Stella, L. 2005, A&A, in press (astro-ph/0508583)
- Flannery (1975) Flannery, B. P. 1975, MNRAS, 170, 325
- Frank, King & Lasota (1987) Frank, J., King, A. R., Lasota, J.-P. 1987, A&A, 178, 137
- Foulkes et al. (2004) Foulkes, S. B., Haswell, C. A., Murray, J. R., Rolfe, D. J. 2004, MNRAS, 349, 1179
- Harlaftis, Charles & Horne (1997) Harlaftis, E. T., Charles, P. A., Horne, K. 1997, MNRAS, 285, 673
- Hamuy et al. (1992) Hamuy, M., Walker, A. R., Suntzeff, N. B., Gigoux, P., Heathcote, S. R., & Phillips, M. M. 1992, PASP, 104, 533
- Hamuy et al. (1994) Hamuy, M., Suntzeff, N. B., Heathcote, S. R., Walker, A. R., Gigoux, P., & Phillips, M. M. 1994, PASP, 106, 566
- Haswell et al. (2002) Haswell, C. A., Hynes, R. I., King, A. R., & Schenker, K. 2002, MNRAS, 332, 928
- Horne et al. (1994) Horne, K., Marsh, T. R., Cheng, F. H., Hubeny, I., Lanz, T. 1994, ApJ, 426, 294
- Hynes et al. (2001) Hynes, R. I., Charles, P. A., Haswell, C. A., Casares, J., Zurita, C., Serra-Ricart, M. 2001, MNRAS, 324, 180
- Hynes et al. (2006a) Hynes, R. I., et al. 2006a, in press (astro-ph/0605143) (Paper I)
- Hynes et al. (2006b) Hynes, R. I., et al. 2006b, in prep. (Paper III)
- King, Kolb & Szuszkiewicz (1997) King, A. R., Kolb, U., Szuszkiewicz, E. 1997, ApJ, 488
- King (2006) King, A. R. 2006, Chapter 13, in: “Compact Stellar X-ray Sources”, Ed: Lewin, W., van der Klis, M., Cambridge University Press, Cambridge, in press (astro-ph/0301118)
- King & Cannizzo (1998) King, A. R., Cannizzo, J. K. 1998, ApJ, 499, 348
- Lubow & Shu (1975) Lubow, S. H., Shu, F. H. 1975, ApJ, 198, 383
- Lubow & Shu (1976) Lubow, S. H., Shu, F. H. 1976, ApJ, 207, L53
- Marsh & Horne (1988) Marsh, T. R., Horne, K. 1988, MNRAS, 235, 269
- Mason et al. (1980) Mason, K. O., et al. 1980, ApJ, 242, L109
- Munari & Zwitter (1997) Munari, U., & Zwitter, T. 1997, A&A, 318, 269
- Nichols & Linsky (1996) Nichols, J. S., Linsky, J. L. 1996, AJ, 111, 517
- Özel (2006) Özel, F. 2006, Nature, in press (astro-ph/0605106)
- Patterson et al. (2005) Patterson, J. et al. 2005, PASP, 117, 1204
- van Paradijs (1996) van Paradijs, J. 1996, ApJ, 464, L139
- van Paradijs, van der Klis & Pedersen (1988) van Paradijs, J., van der Klis, M., Pedersen, H. 1988, A&AS, 76, 185
- Parmar et al. (1985) Parmar, A. N., White, N. E., Giommi, P., Haberl, F., Pedersen, H. 1985, IAU Circ., 4039
- Parmar et al. (1986) Parmar, A. N., White, N. E., Giommi, P., Gottwald, M. 1986, ApJ, 308, 199
- Profitt et al. (2002) Profitt, C., et al. 2002, STIS Instrument Handbook, Version 6.0, STScI, Baltimore
- Schenker & King (2002) Schenker, K., King, A. R. 2002, in: “The Physics of Cataclysmic Variables and Related Objects”, Eds. Gänsicke, B T., Beuermann K., Reinsch K., ASP Conference Series, 261, 243
- Schoembs & Zoeschinger (1990) Schoembs, R., Zoeschinger, G. 1990, A&A, 227, 105
- Smak (2001) Smak, J. I. 2001, Acta Astron., 51, 279
- Smak (2002) Smak, J. I. 2002, Acta Astron., 52, 189
- Smak & Waagen (2004) Smak, J. I., Waagen, E. O. 2004, Acta Astron., 54, 433
- Steeghs & Casares (2002) Steeghs, D., Casares, J. 2002, ApJ, 568, 273
- Still et al. (1997) Still, M. D., Quaintrell, H., Roche, P. D., Reynolds, A. P. 1997, MNRAS, 292, 52
- Szkody & Piché (1990) Szkody, P., Piché, F. 1990, ApJ, 361, 235
- Thorestensen et al. (1991) Thorestensen, J. R., Ringwald. F. A., Wade, R. A., Schmidt, G. D., Norsworthy, J. E., 1991, AJ, 102, 272
- Torres et al. (2002) Torres, M. A. P., Casares, J., Martínez-Pais, I. G., Charles, P. A. 2002, MNRAS, 334, 233
- Torres, Callanan & Garcia (2003) Torres, M. A. P., Callanan, P. J., Garcia, M. R., 2003, MNRAS, 341, 1231
- Torres et al. (2004) Torres, M. A. P., Callanan, P. J., Garcia, M. R., Zhao, P., Laycock, S., Kong, A. K. H. 2004, ApJ, 612, 1026
- Vrtilek et al. (2001) Vrtilek, S. D., Quaintrell, H., Boroson, B., Still, M., Fiedler, H., O’Brien, K., McCray R. 2001, ApJ, 549, 522
- Wade et al. (1985) Wade, R. A., Quintana, H., Horne, K., Marsh, T. R. 1985, PASP, 97, 1092
- Warner (1995) Warner B. 1995, Cataclysmic Variable Stars, Cambridge Univ. Press, Cambridge
- White & Holt (1982) White, N. E., Holt, S. S. 1982, ApJ, 257, 318
- White, Nasage & Parmar (1995) White, N. E., Nagase, F., Parmar, A. N. 1995, Chapter 1, in: “X-Ray Binaries”, Eds. Lewin, W. H. G., Van Paradijs, J., Van den Heuvel, E. P. J., CUP, Cambridge
- Wolff et al. (2002) Wolff, M. T., Hertz, P., Wood, K. S., Ray, P. S., Bandyopadhyay, R. M. 2002, ApJ, 575, 384