Accretion Disks around Young Stars:
Lifetimes, Disk Locking and Variability
Abstract
We report the findings of a comprehensive study of disk accretion and related phenomena in four of the nearest young stellar associations spanning 6-30 million years in age, an epoch that may coincide with the late stages of planet formation. We have obtained 650 multi-epoch high-resolution optical spectra of 100 low-mass stars that are likely members of the Chamaeleontis (6 Myr), TW Hydrae (8 Myr), Pictoris (12 Myr) and Tucanae-Horologium (30 Myr) groups. Our data were collected over 12 nights between 2004 December - 2005 July on the Magellan Clay 6.5m telescope. Based on H line profiles, along with a variety of other emission lines, we find clear evidence of on-going accretion in three out of 11 Cha stars and two out of 32 TW Hydrae members. None of the 57 Pic or Tuc-Hor members shows measurable signs of accretion. Together, these results imply significant evolution of the disk accretion process within the first several Myr of a low-mass star’s life. While a few disks can continue to accrete for up to 10 Myr, our findings suggest that disks accreting for beyond that timescale are rather rare. This result provides an indirect constraint on the timescale for gas dissipation in inner disks and, in turn, on gas giant planet formation. All accretors in our sample are slow rotators, whereas non-accretors cover a large range in rotational velocities. This may hint at rotational braking by disks at ages up to 8 Myr. Our multi-epoch spectra confirm that emission-line variability is common even in somewhat older T Tauri stars, among which accretors tend to show particularly strong variations. Thus, our results indicate that accretion and wind activity undergo significant and sustained variations throughout the lifetime of accretion disks.
1 Introduction
Since planets are born in circumstellar disks, studies of disk evolution can provide useful constraints on the timescale for planet formation. The recently identified young stellar associations, located within 100 pc of the Sun and spanning the critical age range of 5 to 30 million years (Myr), constitute superb targets for such investigations. The growing consensus, primarily from infrared observations of these groups and other young clusters, is that (at least) the inner disks are cleared of small dust grains within the first 6–10 Myr (e.g. Haisch, Lada, & Lada, 2001; Jayawardhana et al., 1999b; Haisch, Jayawardhana, & Alves, 2005). Unfortunately, little is known about the timescale for the dissipation of gas, which accounts for 99% of the disk mass and is crucial for building giant planets. That is because cold molecular gas, especially H2, is hard to detect (e.g., Richter et al., 2002). It is possible to determine the presence of gas in the inner disk, albeit indirectly, from evidence of gas being accreted from the inner disk edge on to the central star. Perhaps the most readily seen signature of infalling gas in low mass stars and brown dwarfs is a broad, asymmetric and, usually, strong H emission line, though other diagnostic lines have also been identified (e.g. Muzerolle, Calvet, & Hartmann, 2001; Jayawardhana, Mohanty, & Basri, 2003). The presence or absence of accretion signatures, thus, provides a valuable probe of inner disk evolution: By comparing the fraction of objects with signs of ongoing accretion in star forming regions at different ages, it is possible to obtain constraints on gas dissipation timescales. Furthermore, the study of accretion also gives us insight into the connection between the central star and its circumstellar disk, presumably through a magnetic field.
Here we report on a comprehensive study of disk accretion and related phenomena in four nearby associations of young stars: Chamaeleontis ( Cha; 6 Myr), Pictoris ( Pic; 12 Myr), TW Hydrae (TWA; 8 Myr) and Tucanae-Horologium (Tuc-Hor; 30 Myr). Many of these stars have been identified based on their X-ray emission and later confirmed as young by the detection of Lithium in optical spectra. Their membership in the associations is supported by several lines of evidence, including measurements of radial velocities, proper motions and distances (when possible). For a recent review of the properties of these groups, see Zuckerman & Song (2004). By investigating accretion in those four associations spanning an age range from 6 to 30 Myr and combining the results with literature data for younger regions (e.g. Mohanty, Jayawardhana, & Basri, 2005), we are able to determine the fraction of accretors as a function of age. The high-resolution, high signal-to-noise, multi-epoch spectra that we have collected allow us to distinguish accretors from non-accretors reliably, using line shapes of H and other diagnostics. Since chromospheric activity influences the same emission lines as accretion, ambiguity is unavoidable for a few objects, although in most cases this problem can be mitigated by combining information from different lines and analysing line profiles. In addition, we can identify spectroscopic binaries whose complex line profiles may mimic accretion. In addition, by deriving projected rotational velocities () for our targets, we will explore for the first time whether there is any evidence for ‘disk locking’ – i.e., for accretors being preferentially slow rotators – at these older ages. We are also able to investigate time variability of emission lines in a number of objects.
2 Observations and spectral analysis
We have obtained a total of 650 high-resolution spectra of 100 likely members of four nearby associations – Cha, TWA, Pic and Tuc-Hor – with the echelle spectrograph MIKE at the Magellan Clay 6.5-m telescope on Las Campanas, Chile. The data were collected during four observing runs between 2004 December and 2005 July. The summary observing log is given in Table 1.
MIKE is a double echelle slit spectrograph, consisting of blue and red arms. For this accretion study, we concentrated on the red spectra, with coverage from 4900 Å to 9300 Å. With no binning and using the 035 slit, our spectra have a resolution of . The pixel scale was 014 pix-1 in the spatial direction, and about 24 mÅ pix-1 at 6500 Å in the spectral direction. One peculiarity of MIKE is that it produces slanted echelle spectra, that is, the spatial direction of the projected slit is not aligned with the CCD columns. Moreover, this tilt is wavelength dependent. We therefore developed a customized software package in ESO-MIDAS to take the slant into account. The details of the reduction software and procedures used will be described in a forthcoming paper.
Integration times were chosen so that the signal to noise ratio (S/N) per spectral resolution element at 6500 Å, except for the brightest stars where this would have implied an exposure shorter than 120 s. In those cases, we used the longest exposure time shorter than 120 s that did not saturate the detector, giving S/N80–500, depending on seeing.
In this first of a series of papers, we focus on accretion-related emission lines in these spectra. In particular, we have measured the equivalent width (EW) and the full-width at 10% of the peak (see Sect. 3) for the H emission line. H is perhaps the most widely used accretion diagnostic, mainly because it is highly sensitive and detectable even in weak accretors. However, the H feature is also affected by chromospheric flares and stellar winds, leading to complex and sometimes ambiguous behaviour. For the linewidth measurements, the continuum level was determined by a linear fit to the continuum on both sides of the H line. By measuring the EW in several continuum regions without strong features, we estimate that the uncertainty of our EW values is on average 0.2 Å. For the 10% widths, the errors are km s-1. We also looked for other diagnostics, such as He I (5876 and 6678 Å), O I (7773 and 8446 Å) and the Ca II triplet (8498, 8542 and 8662 Å). We measured the projected rotational velocity () of each of our targets by fitting with a “spun-up” template of a slowly rotating standard. More details on the measurements will be provided in a forthcoming paper.
3 Accretion signatures
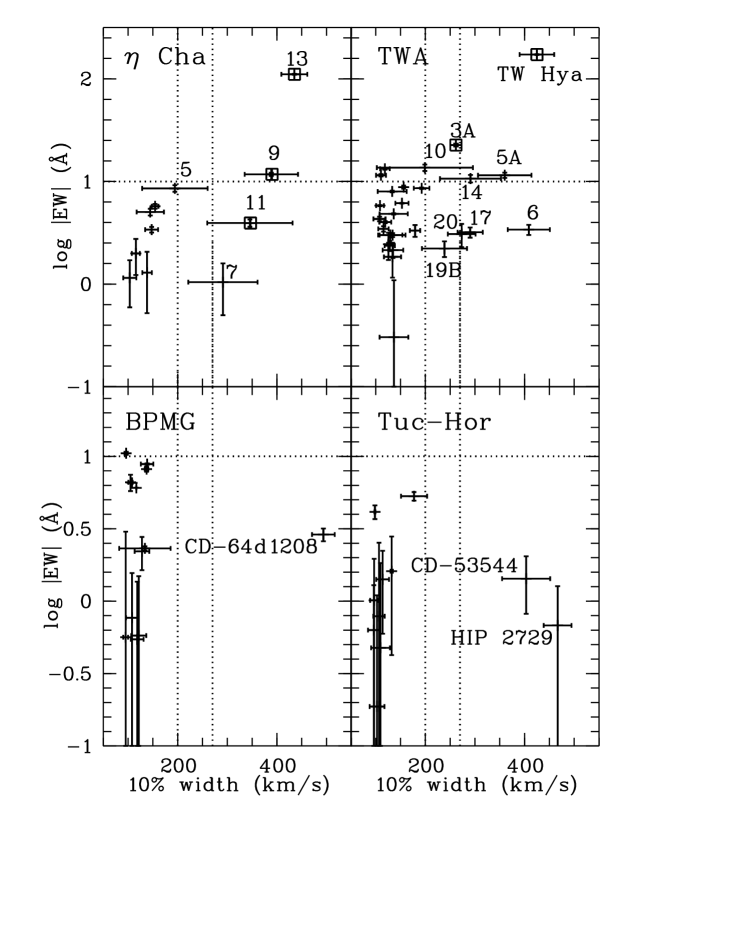
The strength of the H line has long been used to distinguish classical T Tauri stars or accretors (EW 10 Å) from weak-line T Tauri stars or non-accretors (EW 10 Å). It is believed, particularly in the context of the magnetospheric accretion scenario, that in accretors H is produced in the gas falling in from the disk inner edge on to the star. In non-accretors, H emission originates only from chromospheric activity, and thus is generally weaker. Furthermore, the H profiles of accretors tend to be much broader, due to the high velocity of the accreting gas as well as Stark broadening, and asymmetric, as a result of inclination effects and/or absorption by a wind component.
Since the measured EW of H, and thus the threshold for classifying an object as an “accretor”, depends on the spectral type, White & Basri (2003) proposed the full width of the line at 10% of the peak (hereafter, 10% width) as a more robust diagnostic. Based on the presence or absence of veiling in their stellar spectra, they proposed that 10% width 270 km s-1 indicates accretion. Using physical reasoning as well as empirical findings, Jayawardhana, Mohanty, & Basri (2003) adopted 200 km s-1 as a more reasonable accretion cutoff for the very low mass regime (i.e., brown dwarfs), but cautioned that it should be used in combination with additional diagnostics whenever possible. Intriguingly, Natta et al. (2004) have shown that the H 10% width correlates very well with the mass accretion rate derived through other means. Thus, the 10% width appears to be not only a good qualitative indicator of accretion but also gives a quantitative estimate of the infall rate. Here we use both the EW and the 10% width as diagnostics, because accretion should affect both values. On the other hand, if the line profile is broadened due to binarity or fast rotation, we expect high 10% width but the EW should be comparable to those of non-accretors. We also investigate the presence or absence of certain other emission lines – in particular O I (8446 Å), He I (6678 Å) and Ca II (8662 Å) – that are often associated with accretion as well (see discussion and references in Mohanty, Jayawardhana, & Basri, 2005). Particularly the He I (6678 Å) emission feature appears to be a good indicator of ongoing accretion: As shown by Gizis, Reid, & Hawley (2002), chromospherically active stars often show this line in emission, but at a very weak level with EW below 0.25 Å. For our spectra, this is in the range of our detection limit and thus not significant. In a few cases this line has been reported to be in emission during chromospheric flare events (Montes et al., 1998; Martin & Ardila, 2001) with EW of a few Å; thus attributing non-persistent emission in this line to accretion might be problematic. However, if we clearly detect He I (6678 Å) in emission in all spectra for a given star, the object is very likely accreting.
We have measured the H EW and 10% width in all the spectra in hand for all late-type stars in our sample (see Sect. 2). For objects where we see H in emission, the average values and their standard deviations are reported in Tables 2-5; the gives an indication of the line’s variability. We note that these values are in many cases clearly higher than our measurement uncertainties (see Sect. 2), demonstrating that many stars in our sample show emission line variability (see Sect. 6). The tables also indicate the presence of the He I (6678 Å) emission feature, which is an additional diagnostic for ongoing accretion. In the four panels of Fig. 1, we plot the H EW vs. 10% width for members of each of the four stellar associations. This plot is a good way to identify likely accretors in each group, using the criteria discussed above. We show H profiles for selected objects in Fig. 4 and 5.
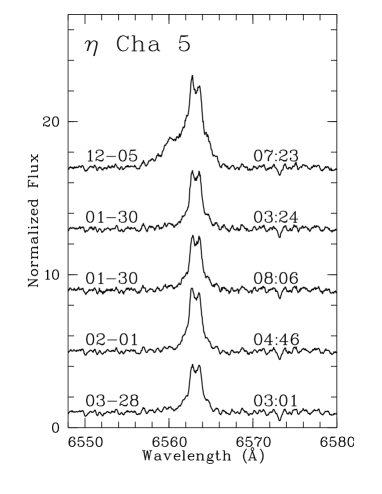
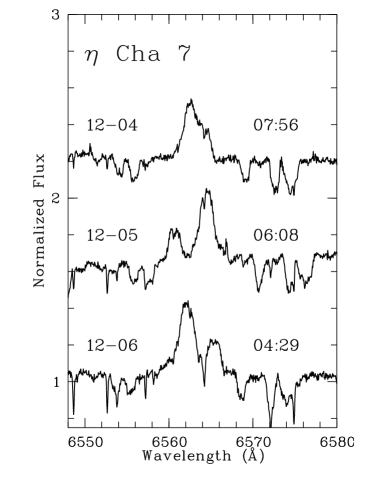
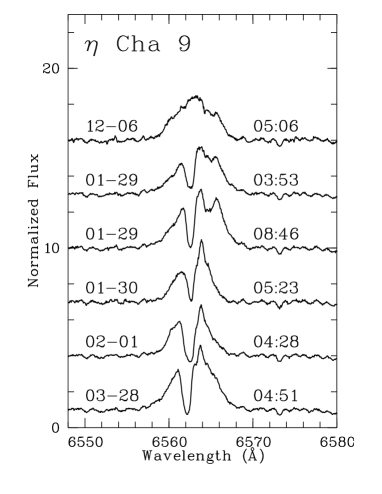
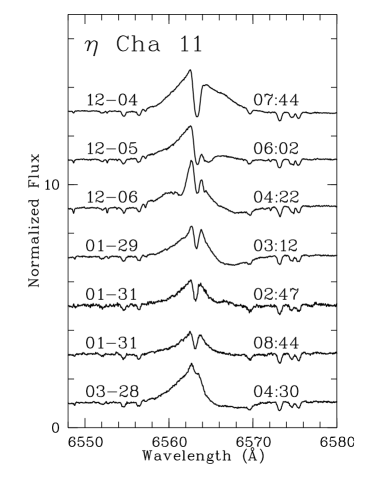
Among Cha cluster members, one star – ECHA J0843.3-7905 or Cha 13 – shows strong signs of accretion, with large H equivalent and 10% widths, comparable to those seen in classical T Tauri stars, and a host of other broad emission lines. Cha 9 also makes the cut as an accretor, based on both its EW and 10% width as well as the presence of He I (6678 Å). Two other members – Cha 7 and 11 – exhibit broad lines wings, with 10% widths above 300 km s-1, but their emission is relatively weak (Fig. 4). Lyo et al. (2004) found Cha 7 to be a double-line spectroscopic binary. Our H profiles of it could well result from the blending of two emission lines from the two binary components (Fig. 4). Besides, it does not show any other accretion-related emission. Thus, we conclude that Cha 7 is not an accretor. The H profile of Cha 11 also appears to consist of more than one component (see Fig. 4 and Sect. 6), but this target does not show any other signs of binarity (Zuckerman & Song, 2004). Whether it is a binary or not, the broad red absorption feature in its H profile, seen at several epochs, is hard to explain without invoking high-velocity infalling material; therefore, we classify Cha 11 as an accretor. The star Cha 5 is at the boundary between accretors and non-accretors. Of our five spectra of Cha 5, only one shows broad H (Fig. 4). The average 10% width is 200 kms-1, i.e. well below the White & Basri (2003) threshold. Furthermore, none of its spectra shows other definitive signs of accretion such as He I (6678 Å) emission. Given these findings, we conclude that it is not accreting during our observations. On the other hand, Lawson, Lyo, & Muzerolle (2004) detect broad H emission with more than 300 kms-1 10% width in a single spectrum and conclude that Cha 5 is accreting at a significant level. Thus, the status of this object is questionable; it appears to show some sporadic accretion, indicating that accretion variability can be quite substantial on long timescales. Since it is non-accreting in our multi-epoch spectra, we do not count it as an accretor in the remainder of this paper.
Both ground-based and Spitzer mid-infrared data are available for members of the Cha group. The L’-band (3.8 m) survey by Haisch, Jayawardhana, & Alves (2005) found infrared excess for only two stars, Cha 11 and 13, both of which we classify as accretors above. The Spitzer IRAC photometry by Megeath et al. (2005) indicates 4-10m excess emission for four stars in our sample, Cha 5, 9, 11, and 13 (called 15 in their paper), where Cha 5 and 9 show excess only at wavelengths m. The IRAC colour excess for Cha 5 confirms that it still might be able to accrete sporadically, as seen by Lawson, Lyo, & Muzerolle (2004), but not in our spectra. It is intriguing that there is no L’-band, but IRAC colour excess plus evidence for, at least sporadic, accretion in Cha 5 and 9. This could imply substantial grain growth and/or partial clearing of the inner disk, while they are still accreting. Thus, these objects might have inner disks depleted of dust, but with substantial amounts of gas. This may also be the case with the accreting star TW Hydrae (see below).
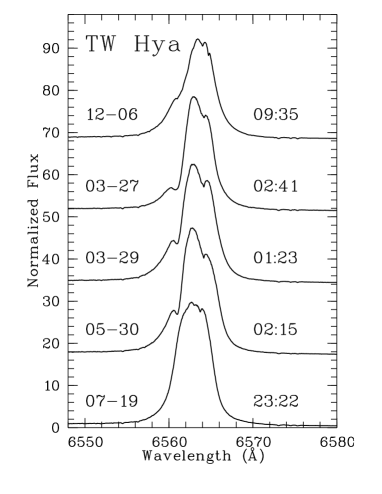
In the TW Hydrae association, two members – TW Hya and Hen 3-600A (TWA 3A) – stand out as accretors based on their H emission as well as the presence of other emission lines such as He I (6678 Å). Both had been identified before, though not in a systematic survey (Muzerolle et al., 2000; Mohanty, Jayawardhana, & Barrado y Navascués, 2003). Based on mid-infrared photometry of TWA members known at the time, Jayawardhana et al. (1999b) reported excesses consistent with inner disks for these two accretors (as well as the HD 98800 quadruple system and the A star HR 4796A; also see Jayawardhana et al., 1998). Recent Spitzer photometry indicates that for both stars the SED does not turn over even by 160, again consistent with their status as stars with active accretion disks (Low et al., 2005). While TW Hya is accreting, shows significant mid-infrared excess, and has a face-on disk resolved in scattered light (e.g. Krist et al., 2000) and in the millimeter (Wilner et al., 2003), it appears to lack near-infrared excess. Based on model fits to the spectral energy distribution (SED) and the millimeter image, there is evidence for partial clearing of the innermost few AU of its disk (Calvet et al., 2002). In the case of the Hen 3-600 binary system with roughly equal mass companions (separation 14 or 70 AU), it is interesting that only the primary shows signs of accretion as well as mid-infrared excess (Jayawardhana et al., 1999a).
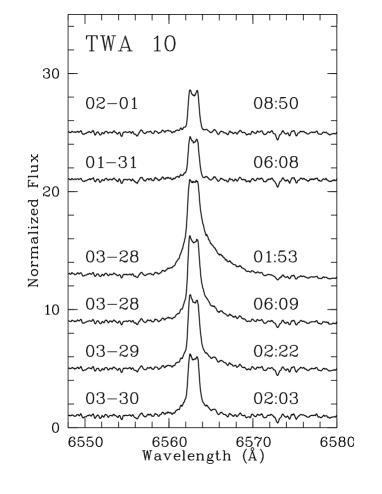
Two more objects show emission line characteristics typical for accretors in at least a few spectra: TWA 10 makes the cut as an accretor based on its EW, but the 10% width is at the borderline. A closer examination of the line profiles shows a burst-like event in our time series (see Sect. 6). During this event, it has increased linewidth in H, He I (6678 Å) emission as well as a strongly asymmetric profile, which is often seen in accreting T Tauri stars. Another interesting case is TWA 5A: This object has broad H emission, but again the values are influenced by a burst event in our time series. During this burst, both EW and 10% width clearly exceed the adopted border between accreting and non-accreting objects. In the remaining spectra, the 10% width is still very high, but the EW is around or close to 10 Å. Again, He I (6678 Å) is detected, but only during the burst event. We examine the H variability of TWA 5A in detail in Sect. 6. TWA 5A has been suspected to be an accretor previously, based on its broad and variable H emission (Mohanty, Jayawardhana, & Barrado y Navascués, 2003).
Although both TWA 10 and TWA 5A show emission line spectra resembling features seen in accreting stars, the recent analysis of their infrared SEDs obtained from Spitzer casts doubts on their spectroscopic classification as accretors (Low et al., 2005): For both objects, the fluxes (or upper limits) at 24, 70, and 160 are consistent with pure photospheric emission, without any evidence for excess emission due to disks. This clearly separates them from the accretors TW Hya and Hen 3-600, whose infrared luminosities are enhanced by several orders of magnitudes. Given the non-detection of a disk at mid- and far-infrared wavelengths with the high sensitivity of Spitzer, ongoing accretion is unlikely for these two objects. Thus we classify both of them as non-accretors. The striking, but not persistent emission line spectrum is in both cases probably due to magnetic activity: As discussed above, chromospheric flares can possibly lead to He I (6678 Å) as well as broad H emission. Although it is still doubtful how a flare can also account for the profile variations seen in TWA 10 and TWA 5A, chromospheric activity appears to be the best explanation for the observed behaviour. The extremely broad H line of TWA 5A is additionally affected by its fast rotation (see Sect. 5) and binarity: The object is a known roughly equal-mass AO binary (Brandeker, Jayawardhana, & Najita, 2003), and there are indications for one of the components being a spectroscopic binary itself (Torres et al., 2003). These two cases demonstrate that caution has to be applied when interpreting emission line spectra of young stars. Multi-epoch, multi-wavelength data have to be used for a reliable characterization of T Tauri stars.
Five other objects – TWA 6, 14, 17, 19B and 20 – have large 10% widths, but the emission is rather weak. Our multi-epoch spectra show evidence of binarity in all five cases (e.g., double-peaked Li I 6708 Å), suggesting that line broadening is the result of the blending of two components rather than high-velocity infalling gas. Perhaps not surprisingly, the same five, along with TWA 5A, have the largest measured in the group (see Tables 2-5), probably due to blending of absorption lines of the two components in the spectra. Furthermore, complementary accretion indicators like He I emission are absent (or seen in absorption) in the spectra of these five objects. In summary, we conclude that TW Hya and Hen 3-600A are the only accreting stars in our TWA sample. Additionally, one of the four young brown dwarfs that are likely members of the TWA, 2MASSW J1207334-393254, is also known to be accreting (Gizis, 2002; Mohanty, Jayawardhana, & Barrado y Navascués, 2003). We have analyzed its variable accretion signatures in two recent papers (Scholz, Jayawardhana, & Brandeker, 2005; Scholz & Jayawardhana, 2006).
Of the Pic moving group members in our sample, none shows definitive evidence of on-going accretion. CD-64 1208 does have a large 10% width, but it is clearly a spectroscopic binary, with line-blends accounting for the broad wings; its Li I absorption line is double-peaked. The H EW is very small and it does not exhibit any other emission lines associated with accretion. We note that AU Mic, which has a resolved dust disk (Kalas, Liu, & Matthews, 2004), does not appear to be accreting.
Among Tuc-Hor moving group members in our sample, two – CD-53544 and HIP 2729 – have large H 10% widths. We do not find evidence for binarity in either case, but both are fast rotators, with 80 and 130 km s-1, respectively. Neither exhibits other accretion-related emission lines. The photospheric lines are clearly broadened by rotation, and the same could account for the broad H. Thus, we do not find any accretors in the Tuc-Hor group either. For this group, Mamajek et al. (2003) carried out a mid-infrared survey, but did not find excess emission for any star, indicating that inner circumstellar disks are optically thin and undetectable at the age of Tuc-Hor.
4 Frequency and lifetime of accreting disks
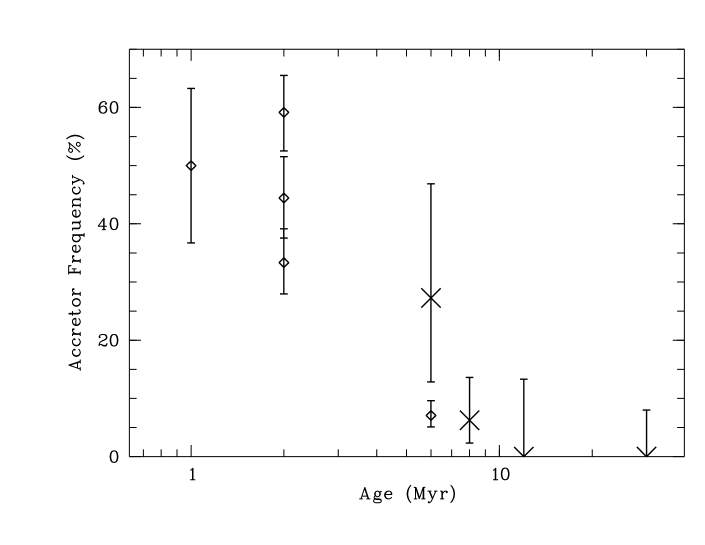
Based on our comprehensive, multi-epoch spectroscopic survey, supplemented with previously published results, we find that three of the 11 late-type stars in Cha (%) and two of the 32 targets in the TWA (%) show evidence of on-going accretion. None of the 21 Pic and 36 Tuc-Hor targets in our survey appears to be accreting. This corresponds to upper limits on the accretor frequency of 13% for Pic and 8% for Tuc-Hor (95% confidence). As shown in Fig. 3, these accretor fractions are well below those found for younger (1–5 Myr) star-forming regions, where the values are generally higher than 30% (Mohanty, Jayawardhana, & Basri, 2005). Except in the case of Cha (where we are necessarily limited by the small number of known members), these lower accretion disk frequencies at older ages can no longer be dismissed as being based on very small samples. Furthermore, the fact that we have collected multi-epoch spectra for our targets reduces (but does not eliminate) the likelihood that we have missed some non-steady accretors in this sample.
To probe the evolution of accretion in these young groups, a critical assessment of their ages is important. For Cha, we adopt the most recent age estimate of Myr, based on comparison of the observed HR diagram with evolutionary tracks (Luhman & Steeghs, 2004). This value is consistent with previous estimates. Webb et al. (1999) discuss different age measurements for the TW Hydrae group and conclude that the most probable age is Myr. Recently Lawson & Crause (2005) found that the TW Hydrae group has two spatially distinct subgroups, whose ages differ by a factor of two. Based on rotation periods and HR diagrams, they argue that the objects TWA 14–19 are likely by a factor of two older than the objects TW Hydrae and TWA 2–13. (TWA 20–25 are not included in their study.) From the Li EW, probably the most reliable observational signature to assess (relative) ages of young stars, there is, however, no evidence for two subgroups with significantly different ages in TW Hydrae (Zuckerman & Song, 2004). At least the M-type objects TWA 14, 15, and 18 should have depleted their Lithium if they were much older than 10 Myr, which is not seen in the data (see Zuckerman & Song, 2004, their Fig. 3). Additionally, the comparison between the rotation periods of the potential subgroups is clearly hampered by small-number statistics. Thus, we decided to treat TW Hydrae as a uniform group with an age of Myr.
For the Pic moving group, both kinematic and evolutionary track diagnostics give an age of Myr (Zuckerman & Song, 2004). For these three groups, the age uncertainty is probably a few Myr. However, using the Li abundance as an age indicator, Zuckerman & Song (2004, their Fig. 3) have convincingly shown that Pic is clearly older than TW Hydrae, and that TW Hydrae is older than Cha. Finally, the most probable age for Tuc-Hor is Myr (Zuckerman & Song, 2004; Torres et al., 2000).
By combining these age estimates with our accretor frequencies, we can set strong constraints on the lifetime of accreting disks: disk accretion appears to cease or dip below measurable rates by about 10 Myr for most late-type stars. Longer-lived accretors must be rare, given that we did not find any among 57 targets in Pic and Tuc-Hor groups. At 12 Myr, the estimated age of the Pic group, the accretor fraction drops below 13% (95% confidence limit); at 30 Myr, the age of Tuc-Hor, it is %. These numbers are in full agreement with constraints from previous studies, which find that accretor frequency and accretion rates drop significantly between 4 and 10 Myr (e.g. Muzerolle et al., 2000; Sicilia-Aguilar et al., 2005). This also provides an indirect constraint on the timescale for gas dissipation in the inner disks and, in turn, on the timescale for gas giant planet formation. Interestingly, the lifetime we derive for gas accretion is roughly consistent with that found for dust in inner disks through previous near- and mid-infrared studies (e.g. Haisch, Lada, & Lada, 2001; Jayawardhana et al., 1999b).
5 Accretion-rotation connection?
Over the years, a number of studies have investigated the connection between the presence of disks and stellar rotation. In the magnetospheric accretion scenario, gas from the inner disk is thought to be channeled by the stellar magnetic field. In that case, one would expect the field lines to connect the star to the disk, which may prevent the star from spinning up (or at least reduce the spin up) as it contracts during the pre-main sequence phase. This process is often referred to as “disk locking” (Camenzind, 1990; Koenigl, 1991; Shu et al., 1994). In other words, we might expect accreting stars to be preferentially slow rotators compared to their peers. Indeed, initial studies by Edwards et al. (1993) found a correlation between rotation period and near-infrared colour excess, interpreted as a connection between star and disk. Although this result has later been confirmed, e.g. by Herbst et al. (2002), other groups fail to detect such a correlation (e.g. Stassun et al., 1999).
One problem with many studies of the disk-rotation connection is the use of near-infrared excess as the disk diagnostic. Due to a variety of effects, e.g. dust settling and inner disk clearing, near-infrared photometry is not a very robust disk indicator. Mid-infrared data are much more reliable for this purpose, and are now available for most of our targets (Jayawardhana et al., 1999b; Low et al., 2005; Megeath et al., 2005). Studies with the aim of investigating the connection between mid-infrared emission and rotation are underway (e.g. Rebull et al., 2005). However, both near-infrared and mid-infrared signatures probe the presence of a dusty disk, and not the coupling between star and disk, which is required in the disk locking scenario. As shown here and elsewhere (e.g. Jayawardhana et al., 2001), the existence of a disk does not necessarily imply a star-disk connection, especially at slightly older ages. Therefore, evidence of on-going accretion – which signals a direct link between the inner disk and the central star – is a much more sensible diagnostic to correlate with stellar rotation rates.
At present, there has been to the best of our knowledge no study of a possible accretion-rotation connection at ages of 6–30 Myr. This is a difficult task, because only few accretors are present at these ages, hampering a reliable statistical comparison of the rotational properties of non-accretors and accretors. Nevertheless, we decided to probe disk-locking at 6-8 Myr using our comprehensive dataset for Cha and TWA. From previous investigations using near-infrared colour excess as disk diagnostic, we expect to see three groups of objects, if disk-locking is still at work in our objects (see review by Herbst et al., 2006): a) Slowly rotating stars with disk, b) slowly rotating stars without disk, c) fast rotating stars without disk. In some sense, this corresponds to an evolutionary sequence: Stars rotate slowly, as long as they are coupled to their disks. After losing the disk, they still rotate slowly for a certain time, because it takes some time to spin them up. Eventually, they will become fast rotating objects without disk, after rotational acceleration due to pre-main sequence contraction. For this simple picture, the critical test is if there are fast rotators with disks – those objects should not exist in a disk-locking scenario, and the most recent investigations of this issue confirm this expectation for 1 Myr old objects based on near- and mid-infrared photometry (Herbst et al., 2002; Rebull et al., 2005). Here we explore if the same behaviour still holds at 6-8 Myr.
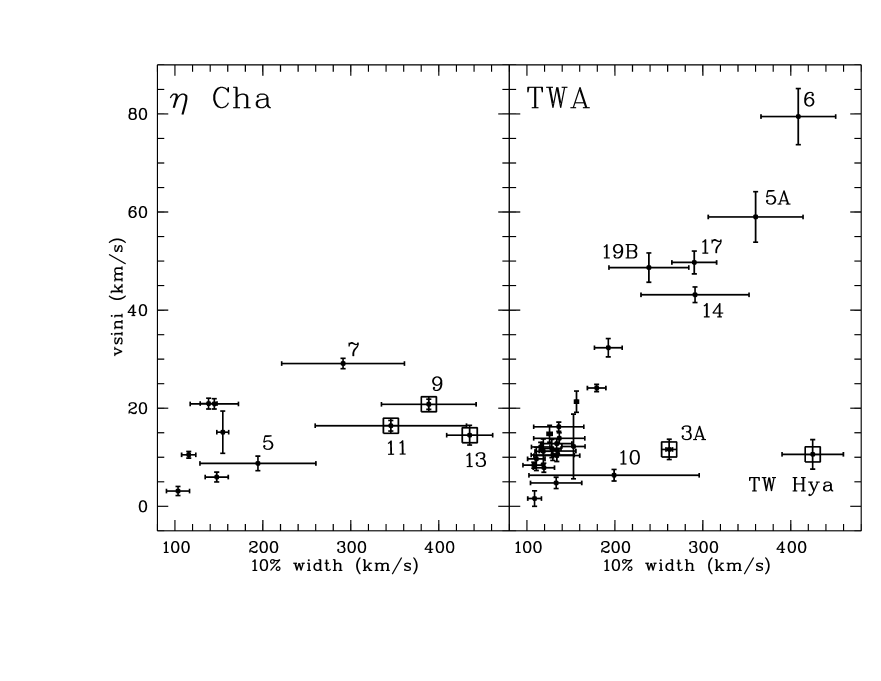
Fig. 2 shows the H 10% width (an accretion diagnostic) vs. the projected rotational velocity () for Cha and TW Hydrae stars. Since faster rotation would contribute to line broadening, it is not surprising that there appears to be an overall positive correlation between and 10% width. In Cha, there is no obvious difference between accretors and non-accretors: all stars are relatively slow rotators with 20 km s-1 (with one exception, Cha 9, but here the 10% width is clearly influenced by binarity, see Sect. 6). In the scenario discussed above, we are missing the fast rotators without disk. This may simply indicate that the stars have not had enough time to spin up. In the somewhat older TW Hya group, the two bona fide accretors – TW Hya and Hen 3-600A (TWA 3A) – are both slow rotators with 15 km s-1. All other non-accreting objects cover the whole range in rotational velocities with up to 50 km s-1 (excluding spectroscopic binaries with blended line profiles). Thus, the available data for the Cha and TW Hydrae group are consistent with the described disk-locking scenario. Since there are only a few accretors in those two groups, however, small number statistics are a big concern.
In Cha and TW Hydrae, rotation periods have been derived for a few objects (Lawson & Crause, 2005; Lawson et al., 2001), including some accretors, through photometric monitoring. In both groups, the periods confirm our results from the analysis, albeit again based on very few objects. With one exception, all periods measured in Cha are in the range between 1 and 20 days, and the two accretors with periods ( Cha 9 and 11) are indistinguishable from the non-accretors. In TW Hydrae, Lawson & Crause (2005) find two rotationally (and spatially) distinct groups of stars (see Sect. 4). We do not see this dichotomy in our data, particularly not after excluding the binaries, which have the highest measured values (see Sect. 3), In any case, the accretor with known period (TW Hydrae itself) belongs to the group of slow rotators with a period of 2.8 d, consistent with our result from the vs. 10% width plot.
In summary, we find that all accretors in our sample are slow rotators with 20 km s-1, whereas non-accretors show a large spread in rotational velocities up to . This is consistent with a scenario where rotational braking by coupling between star and disk can operate in low-mass stars for up to 8 Myr. Given the small numbers of accretors at these ages, however, this result is of low significance. It clearly needs to be checked with larger samples if/when they become available.
6 Emission Line Variability
Many previous studies of young stars have provided evidence for significant variability in the emission lines, particularly H, both in intensity and in profile shape (e.g. Johns & Basri, 1995; Alencar & Batalha, 2002; Scholz, Jayawardhana, & Brandeker, 2005). This was one of the reasons to base our accretor frequency analysis on multi-epoch spectra, to avoid signficant bias due to variability. In some cases, variability information can be used to obtain a detailed view on the accretion behaviour of young stars. Here we want to use our spectra to assess the H variability of our targets.
As indicated by the “errorbars” in Fig. 1, many of our targets show significant variability in the H line in our multi-epoch data. Note that these “errorbars” do not show the uncertainty of our measurements of EW and 10% width, but the scatter of the individual measurements of our multi-epoch data. In most cases, this scatter, given in Tables 2–5, is much higher than the formal error. Thus, H variability is a common phenomenon in the objects in our sample, comparable to the results obtained previously for younger T Tauri stars (e.g. Johns & Basri, 1995; Alencar & Batalha, 2002).
As can be seen in Fig. 1, the objects with evidence of accretion tend to show particularly strong variability. Out of the seven accretors, five show H 10% width changes by more than . Since the 10% width is correlated with accretion rate (Natta et al., 2004), this indicates that the accretion flow in these young stars is often rather unsteady and/or clumpy. Whereas the H width is variable in many cases, the shape of the line is more or less constant for most objects. Some objects, however, show distinct profile changes, probably due to accretion, binarity, or chromospheric activity. In Figs. 4 and 5, we present the time series of the H profiles for some particularly interesting objects, including most of the accretors, which we discuss below.
Two objects, TWA 10 (Fig. 5) and Cha 5 (Fig. 4), show burst-like events in our time series. In both cases, H is clearly much stronger and more asymmetric in one spectrum. For TWA 10, we see gradually decreasing H intensity after this burst event, with the quiescent level reached after about 2 days. A similar trend is seen in the He I (6678 Å) emission line, which is a good indicator of accretion, but occasionally also appears during flare events (see Sect. 3). Additionally, the H line appears to be strongly asymmetric during the burst. This hints to a link between the burst and ongoing accretion rate changes (see Sect. 3), but the lack of mid-infrared emission precludes the existence of a disk for this object (Low et al., 2005). Thus, the spectroscopic behaviour is more likely due to a chromospheric flare event. For Cha 5, we have less information, because the profile change is only apparent in one spectrum. The origin of this event may be a sudden burst of accretion or a chromospheric flare. Lawson, Lyo, & Muzerolle (2004) observe a broad H profile in their (single) spectrum indicating that sporadic accretion events may occur in this object.
The H time series of Cha 7 (Fig. 4) shows clear signs of binarity (see Sec. 3), even with our sparse time sampling. The profile appears to have two components that move relative to each other. The two objects with the most complex profiles are Cha 9 and 11. Both objects have been identified as accretors in Sect. 3, and Cha 9 has a known close companion (Köhler & Petr-Gotzens, 2002), whereas there is no indication of binarity for Cha 11. The H line of Cha 9 (Fig. 4) shows two peaks with a narrow gap in most spectra, where the substructure of the red peak changes on timescales of hours. These changes might be explained by the combined effects of accretion, wind, and binarity. The profile of Cha 11 (Fig. 4) shows similar structure in some spectra, but it is highly variable in all components. For this object, there is clear evidence for ongoing accretion from the H line profile, because we see a highly red-shifted, broad absorption feature, i.e., the line has an inverse P Cygni profile, which is often observed in accreting T Tauri stars (Reipurth et al., 1996) and a clear indication of infalling material. The complexity of the profile probably indicates strong changes in both accretion and wind, as has been found for younger T Tauri stars (e.g. Johns & Basri, 1995; Alencar et al., 2005).
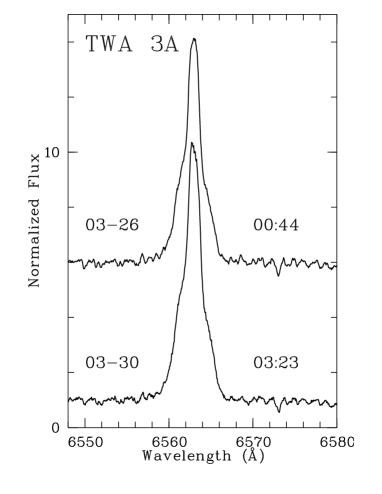
The two well-known accretors in TWA, TW Hydrae and TWA 3A, show very broad and clearly asymmetric profiles (see Fig. 5). Red-shifted absorption features, most likely due to infalling material, are visible as well as blue-shifted profile structures, which may be attributed to outflows. The profile changes are, however, not as dramatic as for the objects discussed above.
The H variability of TWA 5A was of particular interest to us because it had been suspected to be an accretor previously (Mohanty, Jayawardhana, & Barrado y Navascués, 2003) and an AO resolved close binary (Brandeker, Jayawardhana, & Najita, 2003), with roughly equal mass components and a separation of only 54 mas, corresponding to a projected separation of 3 AU at a distance of 55 pc. Additionally, previous high-resolution spectra had hinted that one of the AO components may be a spectroscopic binary as well (Torres et al., 2003). Therefore TWA 5A was monitored in a more extended time series than most of our other targets; in total we obtained 22 spectra, 17 during the 2005 March observing run.
The intensity of H is strongly variable in our time series. The time series of the EW shows a strong burst in the night of the 28th of March, which has strong influence on the average EW for this object. This burst event coincides with the appearance of He I and Ca II in the spectra (see Sec. 3), which are not or only weakly detected in the remaining spectra. Only during this event, the EW exceeds significantly the adopted threshold between accretors and non-accretors, whereas the 10% width is always in the regime normally attributed to accretors (see Sect. 3). However, accretion is unlikely to be the origin for the emission, as argued in Sect. 3, because of the non-detection of a disk excess out to the far-infrared. Thus, the profile shape and variability are probably caused by the combined effects of chromospheric activity, rotation, and binarity. Indeed, the spectroscopic signature of the burst bears similarities to previously observed chromospheric flares (Montes et al., 1998; Martin & Ardila, 2001). Thus, we attribute this event to a magnetically induced flare.
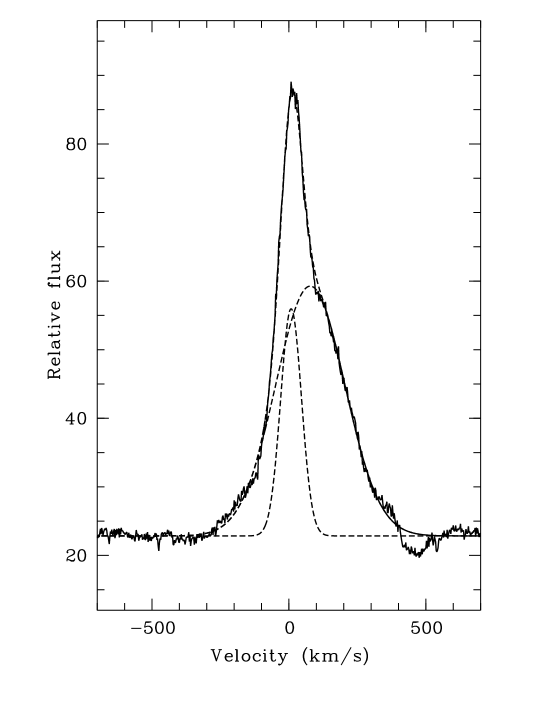
The general shape of the H profiles are very similar in all our spectra: it appears to be composed by a broad and a narrow component, where both components clearly change in intensity and relative position (see Fig. 5). We therefore approximated the H of TWA 5A with two Gaussians to disentangle the two components. In all spectra, the profile composed of two Gaussians fit the observed profile almost perfectly, as can be seen in Fig. 6. The typical is for the broad component and for the narrow one, corresponding to EW of 10-15 Å and Å, respectively.
What is the origin of broad and narrow components? Perhaps the most likely interpretation is that we observe emission from two strongly magnetically active stars in this binary system. In this case, the very different linewidths in the two components might be explained by differences in rotational velocities. If one of the AO-resolved stars is again a spectroscopic binary, where both stars are H active, this would also allow for a larger linewidth and thus provide an explanation for the broad component. Another possible explanation for the line profile is that both components arise from one particularly active star in the system, which exhibits two active regions with different characteristics in the chromosphere.
A more detailed investigation of the complex effects of activity, binarity, and rotation on the H feature requires prior knowledge on the properties of the two (or possibly three) stars in the system. Thus, a sophisticated analysis of the photospheric lines in the composite TWA 5A spectrum is necessary, to determine rotational velocities for both stars and to investigate mass and orbital period of a potential third body in the system.
7 Conclusions
We have carried out an extensive investigation of disk accretion and related phenomena in 100 young stars in four nearby associations that span 6-30 Myr in age. Our study is based on 650 high-resolution, high signal-to-noise multi-epoch optical spectra of these targets. We find that disk accretion ceases or dips below measurable levels by 10 Myr in the vast majority of low-mass stars. This result provides an indirect constraint on the timescale for gas dissipation in inner disks and, thus, gas giant planet formation. We find that all accretors in our sample are slow rotators, whereas non-accretors are either slow or fast rotators. This may indicate that stellar rotation is still braked by the disk at 8 Myr, but the small number of accretors at these ages hampers a more detailed investigation of the rotation-accretion connection. Accretors also often exhibit significant time variability in their emission lines, providing evidence for clumpy accretion flows and/or episodic accretion events.
References
- Alencar et al. (2005) Alencar, S. H. P., Basri, G., Hartmann, L., Calvet, N. 2005, A&A, 440, 595
- Alencar & Batalha (2002) Alencar, S. H. P., Batalha, C. 2002, ApJ, 571, 378
- Baraffe et al. (1998) Baraffe, I., et al. 1998, A&A, 337, 403
- Brandeker, Jayawardhana, & Najita (2003) Brandeker, A., Jayawardhana, R. & Najita, J. 2003, AJ, 126, 2009
- Calvet et al. (2002) Calvet, N., et al. 2002, ApJ, 568, 1008
- Camenzind (1990) Camenzind, O. 1990, RvMA, 3, 234
- Chabrier & Baraffe (1997) Chabrier, G. & Baraffe, I. 1997, A&A, 327, 1039
- de la Reza & Pinzon (2004) de la Reza, R. & Pinzon, G. 2004, AJ, 128, 1812
- Duquennoy & Mayor (1991) Duquennoy, A., Mayor, M. 1991, A&A, 248, 485
- Edwards et al. (1993) Edwards, S., et al. 1993, AJ, 106, 372
- Gizis (2002) Gizis, J.E. 2002, ApJ, 575, 484
- Gizis, Reid, & Hawley (2002) Gizis, J. E., Reid, I. N., Hawley, S. L. 2002, AJ, 123, 3356
- Haisch, Jayawardhana, & Alves (2005) Haisch, K.E.,Jr., Jayawardhana, R. & Alves, J. 2005, ApJ, 627, L57
- Haisch, Lada, & Lada (2001) Haisch, K.E.,Jr., Lada, E.A. & Lada, C.J. 2001, ApJ, 553, L153
- Herbst et al. (2006) Herbst, W. H., Eislöffel, J., Mundt, R., Scholz, A. 2006, Review Chapter for Protostars and Planets V, in press
- Herbst et al. (2002) Herbst, W., et al. 2002, A&A, 396, 513
- Jayawardhana et al. (2001) Jayawardhana, R., et al. 2001, ApJ, 550, L197
- Jayawardhana et al. (2003) Jayawardhana, R., et al. 2003, AJ, 126, 1515
- Jayawardhana, Mohanty, & Basri (2003) Jayawardhana, R., Mohanty, S., Basri, G. 2003, ApJ, 592, 282
- Jayawardhana et al. (1998) Jayawardhana, R., et al. 1998, ApJ, 503, L79
- Jayawardhana et al. (1999a) Jayawardhana, R., et al. 1999, ApJ, 520, L41
- Jayawardhana et al. (1999b) Jayawardhana, R., et al. 1999, ApJ, 521, L129
- Johns & Basri (1995) Johns, C., Basri, G. 1995, AJ, 109, 2800
- Kalas, Liu, & Matthews (2004) Kalas, P., Liu, M.C. & Matthews, B.C. 2004, Science, 303, 1990
- Köhler & Petr-Gotzens (2002) Köhler, R., Petr-Gotzens, M. G. 2002, AJ, 124, 2899
- Koenigl (1991) Koenigl, A. 1991, ApJ, 370, L39
- Krist et al. (2000) Krist, J.E., et al. 2000, ApJ, 538, 793
- Lawson & Crause (2005) Lawson, W. A., Crause, L. A. 2005, MNRAS, 357, 1399
- Lawson, Lyo, & Muzerolle (2004) Lawson, W.A., Lyo, A.R. & Muzerolle, J. 2004, MNRAS, 351, L39
- Lawson et al. (2001) Lawson, W. A., Crause, L. A., Mamajek, E. E., Feigelson, E. D. 2001, MNRAS, 321, 57
- Low et al. (2005) Low, F. J., Smith, P. S., Werner, M., Chen, Ch., Krause, V., Jura, M., Hines, D. C. 2005, ApJ, 631, 1170
- Luhman & Steeghs (2004) Luhman, K. L., Steeghs, D. 2004, ApJ, 609, 917
- Lyo et al. (2004) Lyo, A.-R., Lawson, W. A., Feigelson, E. D., Crause, L. A. 2004, MNRAS, 347, 246
- Mamajek et al. (2003) Mamajek, E. E., Meyer, M. R., Hinz, P. M., Hoffmann, W. F., Cohen, M., Hora, J. L. 2004, ApJ, 612, 496
- Martin & Ardila (2001) Martin, E. L., Ardila, D. R. 2001, AJ, 121, 2758
- Megeath et al. (2005) Megeath, S. T., Hartmann, L., Luhman, K. L., Fazio, G. G. 2005, ApJ, 634, 113
- Mohanty, Jayawardhana, & Basri (2005) Mohanty, S., Jayawardhana, R., Basri, G. 2005, ApJ, 626, 498
- Mohanty, Jayawardhana, & Barrado y Navascués (2003) Mohanty, S., Jayawardhana, R., Barrado y Navascués, D. 2003, ApJ, 593, 109
- Montes et al. (1998) Montes, D., Saar, S. H., Collier Cameron, A., Unruh, Y. C. 1998, ASP Conf. Ser. 154, 1508
- Muzerolle, Calvet, & Hartmann (2001) Muzerolle, J., Calvet, N. & Hartmann, L. 2001, 550, 944
- Muzerolle et al. (2000) Muzerolle, J., et al. 2000, ApJ, 535, 47
- Natta et al. (2004) Natta, A., et al. 2004, A&A, 424, 603
- Press et al. (1992) Press, W. H., Teukolsky, S. A., Vetterling, W. T., Flannery, B. P. 1992, Numerical Recipes in C, Cambridge University Press, 2nd ed.
- Rebull et al. (2005) Rebull, L. M., Stauffer, J. R., Megeath, T., Hora, J., Hartmann, L. 2005, AAS Meeting, 207, 185.08
- Reipurth et al. (1996) Reipurth, B., Pedrosa, A., Lago, M. T. V. T. 1996, A&AS, 120, 229
- Richter et al. (2002) Richter, M.J., et al. 2002, ApJ, 572, L161
- Scholz, Jayawardhana, & Brandeker (2005) Scholz, A., Jayawardhana, R. & Brandeker, A. 2005, ApJ, 629, L41
- Scholz & Jayawardhana (2006) Scholz, A. & Jayawardhana, R. 2006, ApJ, 638, 1056
- Shu et al. (1994) Shu, F., et al. 1994, ApJ, 429, 781
- Sicilia-Aguilar et al. (2005) Sicilia-Aguilar, A., Hartmann, L. W., Hernandez, J., Brice o, C., Calvet, N. 2005, AJ, 130, 188
- Stassun et al. (1999) Stassun, K.G., et al. 1999, AJ, 117, 2941
- Torres et al. (2003) Torres, G., et al. 2003, AJ, 125, 825
- Torres et al. (2000) Torres, G., et al. 2000, AJ, 120, 1410
- Webb et al. (1999) Webb, R. A., et al. 1999, ApJ, 512, 63
- White & Basri (2003) White, R.J. & Basri, G. 2003, ApJ, 582, 1109
- Wilner et al. (2003) Wilner, D. J., Bourke, T. L., Wright, C. M., Jorgensen, J. K., van Dishoeck, E. F., Wong, T. 2003, ApJ, 596, 597
- Zuckerman & Song (2004) Zuckerman, B. & Song, I. 2004, ARA&A, 42, 685

| Date (UT) | Targets (in brackets: no. of observations if ) |
|---|---|
| 2004-12-04 | Cha 1, Cha 11, Cha 7, TWA 19A, TWA 5A, TWA 9A, AU Mic (3), AO Men (2), Pic, GJ3305 (2), HIP 23309 (2). |
| 2004-12-05 | Cha 4, Cha 5, Cha 7, Cha 10, Cha 11, Cha 12, AO Men (2), GJ3305 (2), HIP 23309 (2), TW Hya (2), TWA 5A, TWA 9A, TWA 19A. |
| 2004-12-06 | Cha 3, Cha 4, Cha 6, Cha 7, Cha 9, Cha 11, Cha 13, TW Hya (2), TWA 5A, TWA 6, TWA 7, TWA 8A, TWA 9A, TWA 19A, AO Men (2), |
| AU Mic (5), Pic (2), GJ3305 (2), HIP 23309 (2). | |
| 2005-01-29 | Cha 1 (2), Cha 10 (2), Cha 11, Cha 12 (2), Cha 13, Cha 3, Cha 4 (2), Cha 5, Cha 6 (2), Cha 9 (2), TW Hya, TWA 2A, TWA 3A, |
| TWA 3B, TWA 4A, TWA 6, V343Nor. | |
| 2005-01-30 | Cha1, Cha 3 (2), Cha4, Cha 5 (2), Cha6, Cha10, Cha12, Cha13 (2), TWA 2A, TWA 3A, TWA 3B, TWA 4A, TWA 5A, TWA 6, TWA 7, |
| TWA 8A, TWA 9A, TWA 9B, TWA 11A, TWA 11B, TWA 13A, TWA 13B, TWA 19A, TWA 19B, AO Men, Pic (2), HD 35850, HIP 23309, V343Nor, | |
| CD-53544, CD-60416, CPD-64120, GSC8056-0482,GSC8491-1194, GSC8497-0995, HD 13183, HD 13246, HD 8558, HD 9054, HIP 16853, HIP 21632, | |
| HIP 22295, HIP 30030, HIP 30034, HIP 32235, HIP 33737, HIP 9141, TYC5882-1169, TYC7600-0516. | |
| 2005-01-31 | Cha 1, Cha 4, Cha 11 (2), Cha 12, TWA 2A, TWA 4A, TWA 5A, TWA 6, TWA 7, TWA 9A, TWA 10, TWA 12, TWA 13A, TWA 13B, TWA 14, |
| TWA 16, TWA 17, TWA 18, TWA 19A, TWA 19B, Pic, AO Men, HD 35850, HIP 23309, CD-53544, CD-60416, CPD-64120, GSC8056-0482, GSC8491-1194, | |
| GSC8497-0995, HD 13183, HD 13246, HD 8558, HD 9054, HIP 16853, HIP 21632, HIP 30030, HIP 32235, HIP 33737, HIP 9141, TYC5882-1169, TYC7600-0516. | |
| 2005-02-01 | Cha 1, Cha 3, Cha 4, Cha 5, Cha 6 (2), Cha 9, Cha 10, Cha 12 (2), Cha 13, TW Hya (2), TWA 2A, TWA 4A, TWA 5A, TWA 6, TWA 7, |
| TWA 8A, TWA 8B, TWA 9A, TWA 9B, TWA 10, TWA 12, TWA 13A, TWA 13B, TWA 14, TWA 17, TWA 18, TWA 19A, TWA 19B, Pic, GJ3305, | |
| HD 35850, HIP 23309, V343Nor, CD-53544, CD-60416, CPD-64120, GSC8056-0482,GSC8491-1194, GSC8497-0995, HD 13183, HD 13246, HD 8558, | |
| HD 9054, HIP 16853, HIP 21632, HIP 22295, HIP 30030, HIP 30034, HIP 32235, HIP 33737, HIP 9141, TYC5882-1169, TYC7600-0516. | |
| 2005-03-26 | TWA 3A, TWA 3B, HIP 23418. |
| 2005-03-27 | Cha 1, Cha 3, Cha 4, Cha 13, TW Hya (2), TWA 2A (2), TWA 5A (4), TWA 6 (2), TWA 7 (2), TWA 8A (2), TWA 8B (2), TWA 15A, TWA 15B, |
| TWA 16, TWA 20, TWA 21, TWA 22, TWA 23, TWA 24, TWA 25, Pic (2), AO Men, AU Mic (4), BD-17d6128, CD-64d1208, GJ 3305, GJ799A, GJ799B, | |
| HD 164249, HD 181327, HD 199143, HD 35850 (2), HIP 23309, HIP 23418, HR7329B, PZTel, HIP 105388, HIP 105404, HIP 107345, HIP 107947, HIP 108422, | |
| HIP 16853 (2), HIP 21632, HIP 22295, HIP 30030, HIP 30034, HIP 32235, HIP 33737, TYC5882-1169, TYC7065-0879 (2), TYC7600-0516. | |
| 2005-03-28 | Cha 5, Cha 6, Cha 9, Cha 10, Cha 11, Cha 12, TWA 5A (5), TWA 9A (2), TWA 9B (2), TWA 10 (2), TWA 11A (2), TWA 11B (2), TWA 12 (2), |
| TWA 13A (2), TWA 13B (2), TWA 14 (2), TWA 16 (2), TWA 17 (2), TWA 18 (2), TWA 19A (2), TWA 19B (2), TWA 20, TWA 21 (2), TWA 22 (2), TWA 23, | |
| TWA 24 (2), TWA 25, AU Mic (3), BD-17d6128 (2), Pic, CD-64d1208, GJ799A, GJ799B, HD 164249, HD 181327, HD 199143, PZTel, V343Nor, HIP 105388, | |
| HIP 105404, HIP 107345, HIP 107947, HIP 108422, HIP 21632, HIP 22295, HIP 30030, HIP 30034, HIP 32235, HIP 33737, TYC5882-1169, TYC7600-0516. | |
| 2005-03-29 | TW Hya, TWA 2A, TWA 3A, TWA 4A, TWA 5A (4), TWA 6, TWA 7, TWA 8A, TWA 8B, TWA 9A, TWA 9B, TWA 10, TWA 11A, TWA 11B, TWA 12, |
| TWA 13A, TWA 13B, TWA 14, TWA 15A (2), TWA 15B (2), TWA 17, TWA 18, TWA 19A, TWA 19B, TWA 20 (2), TWA 21 (2), TWA 22 (2), TWA 23 (2), | |
| TWA 24, TWA 25 (2), AU Mic (7), BD-17d6128, Pic (2), CD-64d1208, GJ799A, GJ799B, HD 164249, HD 181327, HD 199143, HIP 23418, PZTel, HIP 105388, | |
| HIP 105404, HIP 107345, HIP 107947, HIP 108422. | |
| 2005-03-30 | TW Hya, TWA 2A, TWA 3A, TWA 3B, TWA 4A, TWA 5A (4), TWA 6, TWA 7, TWA 8A, TWA 8B, TWA 9A, TWA 9B, TWA 10, TWA 11A (13), TWA 11B, |
| TWA 12, TWA 13A, TWA 13B, TWA 14, TWA 15A (2), TWA 15B (2), TWA 16, TWA 18, TWA 19A, TWA 19B, TWA 20 (2), TWA 21, TWA 22, TWA 23 (2), | |
| TWA 24, TWA 25 (2), AU Mic (2), BD-17d6128, CD-64d1208, GJ799A, GJ799B, HD 164249, HD 181327, HD 199143, HIP 23418, PZ Tel, HIP 105388, HIP 105404, | |
| HIP 107345, HIP 107947, HIP 108422. | |
| 2005-07-19 | TWA 2A, TWA 3A, TWA 3B, TWA 4A, TWA 5A, TWA 6, TWA 7, TWA 8A, TWA 8B, TWA 9A, TWA 9B, TWA 12, TWA 13A, TWA 13B, |
| TWA 14, TWA 16, TWA 17, TWA 18, TWA 19A, TWA 19B, TWA 21, TWA 22, TW Hya, AU Mic (2), BD-17d6128 (2), Pic (5), CD-64d1208 (2), | |
| GJ799A (2), GJ799B (2), HD 1555A (2), HD 164249 (2), HD 181327 (2), HD 199143 (2), HD 35850, HIP 112312 (2), HIP 112312B (2), HIP 12545 (2), | |
| HIP 23418, PZ Tel (2), V343Nor, CD-53544, CD-60416 (2), CPD-64120 (2), GSC8056-0482, GSC8491-1194, GSC8497-0995, HD 13183 (2), HD 13246 (2), | |
| HD 8558 (2), HD 9054 (2), HIP 105388 (2), HIP 105404 (2), HIP 107345 (2), HIP 107947 (2), HIP 108422 (2), HIP 1113 (2), HIP 116748B (2), | |
| HIP 116748A (2), HIP 1481 (2), HIP 16853, HIP 1910 (2), HIP 1993 (2), HIP 21632, HIP 22295, HIP 2729 (2), HIP 3556 (2), HIP 490 (2), | |
| HIP 9141 (2), TYC5882-1169, TYC7600-0516. |
| Object | Other Name | No. of spectra | Sp. type | EW | EW aaValues for are the scatter in our multi-epoch spectra, not the measurement uncertainty. Errors in EW are 0.2 Å, in 10% width 5 km s-1 | 10% width | 10% width aaValues for are the scatter in our multi-epoch spectra, not the measurement uncertainty. Errors in EW are 0.2 Å, in 10% width 5 km s-1 | vddThe values for spectroscopic binaries (see last column) might be affected by line blending. | Comments |
|---|---|---|---|---|---|---|---|---|---|
| (Å) | (Å) | () | () | () | |||||
| Cha 1 | RECX 1 | 7 | K4bbZuckerman & Song (2004) | -1.2 | 0.3 | 103 | 13 | 20.9 | |
| Cha 3 | RECX 3 | 6 | M3.25ccLuhman & Steeghs (2004) | -2.0 | 0.2 | 116 | 8 | 10.5 | |
| Cha 4 | RECX 4 | 8 | K7bbZuckerman & Song (2004) | -3.4 | 0.6 | 147 | 13 | 6.0 | |
| Cha 5 | RECX 5 | 6 | M4ccLuhman & Steeghs (2004) | -8.6 | 4.3 | 194 | 66 | 8.8 | |
| Cha 6 | RECX 6 | 7 | M2bbZuckerman & Song (2004) | -5.0 | 0.4 | 145 | 27 | 20.9 | |
| Cha 7 | RECX 7 | 3 | K6ccLuhman & Steeghs (2004) | -1.0 | 0.3 | 291 | 70 | 29.1 | spectroscopic binary |
| Cha 9 | RECX 9 | 6 | M4.5ccLuhman & Steeghs (2004) | -11.7 | 2.7 | 389 | 54 | 20.8 | He I (6678 Å) |
| Cha 10 | RECX 10 | 6 | K7bbZuckerman & Song (2004) | -1.2 | 0.3 | 103 | 13 | 5.0 | |
| Cha 11 | RECX 11 | 7 | K4bbZuckerman & Song (2004) | -3.9 | 2.1 | 345 | 86 | 16.4 | |
| Cha 12 | RECX 12 | 8 | M2bbZuckerman & Song (2004) | -5.7 | 0.5 | 154 | 7 | 15.1 | |
| Cha 13 | ECHA J0843.3-7905 | 6 | M2bbZuckerman & Song (2004) | -110.8 | 13.7 | 435 | 26 | 14.5 | He I (6678 Å) |
| Object | Other Name | No. of spectra | Sp. type | EW | EW aaValues for are the scatter in our multi-epoch spectra, not the measurement uncertainty. Errors in EW are 0.2 Å, in 10% width 5 km s-1 | 10% width | 10% width aaValues for are the scatter in our multi-epoch spectra, not the measurement uncertainty. Errors in EW are 0.2 Å, in 10% width 5 km s-1 | vffThe values for spectroscopic binaries (see last column) might be affected by line blending. | Comments |
|---|---|---|---|---|---|---|---|---|---|
| (Å) | (Å) | () | () | () | |||||
| TW Hya | TWA 1 | 12 | K7bbZuckerman & Song (2004) | -172.5 | 44.7 | 425 | 35 | 10.6 | He I (6678 Å) |
| TWA 2A | CD -29 8887A | 9 | M2eccde la Reza & Pinzon (2004) | -1.8 | 0.2 | 134 | 17 | 12.8 | |
| TWA 3A | Hen 3-600A | 5 | M3eccde la Reza & Pinzon (2004) | -22.6 | 2.9 | 262 | 4 | 11.6 | spectroscopic binary, He I (6678 Å)ddFor all measurements, only spectra were used where we see no doubled lines. Linewidths should therefore not be affected by binarity. |
| TWA 3B | Hen 3-600B | 4 | M3.5ccde la Reza & Pinzon (2004) | -6.1 | 0.9 | 153 | 13 | 12.2 | |
| TWA 5A | CD -33 7795A | 24 | M1.5ccde la Reza & Pinzon (2004) | -11.5 | 4.9 | 360 | 54 | 59.0 | He I (6678 Å) |
| TWA 6 | TYC 7183-1477 | 10 | K7bbZuckerman & Song (2004) | -3.4 | 0.4 | 409 | 42 | 79.5 | spectroscopic binary |
| TWA 7 | TYC 7190-2111 | 9 | M1bbZuckerman & Song (2004) | -5.8 | 0.9 | 109 | 8 | 5.0 | |
| TWA 8A | 8 | M2ccde la Reza & Pinzon (2004) | -8.0 | 1.4 | 133 | 29 | 5.0 | ||
| TWA 8B | 6 | -13.3 | 1.8 | 119 | 10 | 11.2 | |||
| TWA 9A | CD -36 7429A | 11 | K5ccde la Reza & Pinzon (2004) | -2.1 | 0.5 | 135 | 21 | 11.3 | |
| TWA 9B | CD -36 7429B | 7 | M1ccde la Reza & Pinzon (2004) | -4.3 | 0.6 | 108 | 12 | 8.4 | |
| TWA 10 | GSC 07766-00743 | 6 | M2.5bbZuckerman & Song (2004) | -13.6 | 9.6 | 199 | 97 | 6.3 | He I (6678 Å) |
| TWA 11B | HR 4796B | 5 | M2.5ccde la Reza & Pinzon (2004) | -3.5 | 0.6 | 116 | 10 | 12.1 | |
| TWA 12 | RX J1121.1-3845 | 7 | M2ccde la Reza & Pinzon (2004) | -4.8 | 0.9 | 136 | 28 | 16.2 | |
| TWA 13A | RX J1121.3-3447N | 8 | M1eccde la Reza & Pinzon (2004) | -3.0 | 0.7 | 129 | 24 | 10.5 | |
| TWA 13B | RX J1121.3-3447N | 8 | M2eccde la Reza & Pinzon (2004) | -3.0 | 0.7 | 134 | 26 | 10.3 | |
| TWA 14 | 7 | M0ccde la Reza & Pinzon (2004) | -10.7 | 7.8 | 291 | 61 | 43.1 | spectroscopic binary | |
| TWA 15A | 5 | M1.15ccde la Reza & Pinzon (2004) | -8.8 | 0.5 | 156 | 2 | 21.3 | ||
| TWA 15B | 5 | M2ccde la Reza & Pinzon (2004) | -8.6 | 1.4 | 193 | 16 | 32.3 | ||
| TWA 16 | 6 | M1.5ccde la Reza & Pinzon (2004) | -4.0 | 0.8 | 119 | 12 | 7.9 | ||
| TWA 17 | 6 | K5ccde la Reza & Pinzon (2004) | -3.2 | 0.4 | 290 | 25 | 49.7 | spectroscopic binary | |
| TWA 18 | 7 | M0.5ccde la Reza & Pinzon (2004) | -3.3 | 0.4 | 179 | 11 | 24.1 | ||
| TWA 19B | HD 102458B | 8 | K7ccde la Reza & Pinzon (2004) | -2.2 | 0.4 | 239 | 45 | 48.7 | spectroscopic binary |
| TWA 20 | A2 146 | 6 | M2ccde la Reza & Pinzon (2004) | -3.1 | 0.2 | 273 | 28 | eeTWA 20 is a spectroscopic binary; it was not possible to obtain a fit with acceptable reliability. | spectroscopic binary |
| TWA 22 | SSS 1017-5354 | 7 | M5bbZuckerman & Song (2004) | -11.5 | 2.0 | 111 | 10 | 9.7 | |
| TWA 23 | SSS 1207-3247 | 6 | M1bbZuckerman & Song (2004) | -2.4 | 0.2 | 126 | 3 | 14.8 | |
| TWA 24 | GSC8644-0802 | 5 | K3bbZuckerman & Song (2004) | -0.3 | 0.2 | 137 | 29 | 13.0 | |
| TWA 25 | TYC 7760-0283 | 6 | M0bbZuckerman & Song (2004) | -2.4 | 0.5 | 128 | 10 | 11.8 |
| Object | Other Name | No. of spectra | Sp. type | EW | EW aaValues for are the scatter in our multi-epoch spectra, not the measurement uncertainty. Errors in EW are 0.2 Å, in 10% width 5 km s-1 | 10% width | 10% width aaValues for are the scatter in our multi-epoch spectra, not the measurement uncertainty. Errors in EW are 0.2 Å, in 10% width 5 km s-1 | vddThe values for spectroscopic binaries (see last column) might be affected by line blending. | Comments |
|---|---|---|---|---|---|---|---|---|---|
| (Å) | (Å) | () | () | () | |||||
| AO Men | HIP29964 | 9 | K6/7bbZuckerman & Song (2004) | -0.6 | 0.1 | 122 | 15 | 16.0 | |
| Au Mic | HIP102409 | 26 | -2.3 | 0.8 | 134 | 52 | 8.5 | ||
| BD-17 6128 | HD 358623 | 7 | K7/M0ccde la Reza & Pinzon (2004) | -0.5 | 0.2 | 118 | 13 | 14.6 | |
| CD-64 1208 | CPD-64 3950 | 6 | K7bbZuckerman & Song (2004) | -2.9 | 0.5 | 494 | 23 | 102.7 | spectroscopic binary |
| GJ3305 | 8 | M0.5bbZuckerman & Song (2004) | -2.2 | 0.3 | 128 | 15 | 5.3 | ||
| GJ799A | 6 | M4.5ebbZuckerman & Song (2004) | -10.5 | 1.4 | 96 | 3 | 10.6 | ||
| GJ799B | 6 | M4.5ebbZuckerman & Song (2004) | -8.9 | 0.8 | 138 | 13 | 17.0 | ||
| HIP 12545 | BD+05 378 | 2 | M0bbZuckerman & Song (2004) | -0.6 | 0.0 | 95 | 5 | 9.3 | |
| HIP 23309 | CD-57 1054 | 10 | M0.5bbZuckerman & Song (2004) | -0.8 | 0.2 | 108 | 13 | 5.8 | |
| HIP 23418A | GJ 3322A | M3bbZuckerman & Song (2004) | -6.6 | 108 | 7.7 | ||||
| HIP 23418B | GJ 3322B | -6.1 | 116.6 | 21.0 | |||||
| HIP 112312A | V* WW PsA | 2 | M4ebbZuckerman & Song (2004) | -6.6 | 0.1 | 105 | 4 | 14.0 | |
| HIP 112312B | 2 | M4.5ebbZuckerman & Song (2004) | -8.2 | 0.5 | 137 | 4 | 24.3 |
| Object | Other Name | No. of spectra | Sp. type | EW | EW aaValues for are the scatter in our multi-epoch spectra, not the measurement uncertainty. Errors in EW are 0.2 Å, in 10% width 5 km s-1 | 10% width | 10% width aaValues for are the scatter in our multi-epoch spectra, not the measurement uncertainty. Errors in EW are 0.2 Å, in 10% width 5 km s-1 | vsini | Comments |
|---|---|---|---|---|---|---|---|---|---|
| (Å) | (Å) | () | () | () | |||||
| CD-53544 | TYC 8491- 656-1 | 4 | K6VebbZuckerman & Song (2004) | -1.4 | 0.2 | 403 | 48 | 82.2 | fast rotator |
| CD-60416 | TYC 8489- 1155-1 | 5 | K3/4bbZuckerman & Song (2004) | -0.5 | 0.0 | 110 | 19 | 10.1 | |
| CPD-64120 | TYC 8852- 264-1 | 5 | K1VebbZuckerman & Song (2004) | -0.2 | 0.1 | 103 | 15 | 30.2 | |
| GSC8056-0482 | 4 | M3VebbZuckerman & Song (2004) | -5.3 | 0.4 | 177 | 26 | 34.2 | ||
| GSC8491-1194 | 4 | M3VebbZuckerman & Song (2004) | -4.1 | 0.4 | 99 | 1 | 12.8 | ||
| GSC8497-0995 | 4 | K6VebbZuckerman & Song (2004) | -0.6 | 0.2 | 96 | 12 | 6.6 | ||
| HIP 1910 | BPM 1699 | 2 | M1bbZuckerman & Song (2004) | -1.6 | 0.1 | 132 | 2 | 19.0 | |
| HIP 1993 | GSC 08841-00145 | 2 | M1bbZuckerman & Song (2004) | -1.0 | 0.1 | 97 | 8 | 7.1 | |
| HIP 2729 | HD 3221 | 2 | K5VbbZuckerman & Song (2004) | -0.7 | 0.3 | 467 | 28 | 127.5 | fast rotator |
| HIP 3556 | GJ 3054 | 2 | M3bbZuckerman & Song (2004) | -0.8 | 0.0 | 107 | 12 | 5.0 | |
| HIP 107345 | BPM 14269 | 6 | M1bbZuckerman & Song (2004) | -1.4 | 0.2 | 114 | 13 | 5.0 |