Origin of the Counter-Rotating Gas in NGC 1596
Abstract
We present Australia Telescope Compact Array (ATCA) H I imaging of the edge-on galaxy NGC 1596, which was recently found to have counter-rotating ionized gas in its center (). We find a large H I envelope associated with a nearby companion, the dwarf irregular galaxy NGC 1602. The H I covers a region (62 kpc2) and the total H I mass detected is 2.5 (assuming an 18 Mpc distance). The H I is centered on NGC 1602 but appears to have two tidal tails, one of which crosses over NGC 1596. The H I located at the position of NGC 1596 has a velocity gradient in the same sense as the ionized gas, i.e. opposite to the stellar rotation. Both the existence of a large gas reservoir and the velocity gradient of the H I and the ionized gas strongly suggest that the ionized gas in NGC 1596 originated from NGC 1602. From the length of the H I tails we conclude that the interaction started at least 1 Gyr ago, but the unsettled, asymmetric distribution of the ionized gas suggests that the accretion occured more recently. NGC 1596 thus provides a good example where the presence of counter-rotating gas can be directly linked to an accretion event. After the accretion has stopped or the merging is complete, NGC 1596 may evolve to a system with more extended counter-rotating gas but no obvious signature of interaction. There is a substantial local H I peak in one of the two tails, where we also find a faint stellar counterpart. The / ratio in this region is too high for a normal dwarf elliptical or a low surface brightness galaxy, so we conclude that a tidal dwarf is currently forming there.
keywords:
galaxies: spiral - galaxies: ISM - galaxies: stellar content - galaxies: kinematics and dynamics - galaxies: individual (NGC 1596) - galaxies: interactions1 Introduction
During the past 30 years evidence has accumulated for the kinematic complexity of a significant fraction of ellipticals, lenticulars and some spiral galaxies (Rubin, 1994). Oddly rotating stellar and gaseous cores in ellipticals can be taken as support that these galaxies are formed in major mergers. A good example is the prototypical merger remnant NGC 7252, which has star-gas counter-rotation in its core (e.g. Schweizer & Seitzer, 1998). More recently, Bertola, Buson and Zeilinger (1992) found that, even in a significant fraction of S0 galaxies, the warm and cold gas may be of external origin. The first broad search for counter-rotating gas and stars in a sample of galaxies representative of all morphological types and of the local galaxy luminosity function (Kannappan & Fabricant, 2001) showed that counter-rotators can be found in S0’s over a large range of luminosity, but that they occur much less frequently among Sa’s and are absent in later type galaxies. Recently, De Rijcke et al. (2004) found some dwarf ellipticals with kinematically decoupled cores and concluded that they probably originate from an interaction with a giant elliptical or a flyby with a massive galaxy, while a merger origin is ruled out. Geha, Guhathakurta & van der Marel (2005) discovered a counter-rotating core in a low luminosity elliptical and argued for a minor merger between two dwarf size galaxies as the most likely origin.
| NGC 1596 | NGC 1602 | |
| (J2000) | ||
| (J2000) | ||
| Morphological type | SA0: sp | IB(s)m pec: |
| (arcmin) | 3.71 | 1.94 |
| (mag) | 12.10 | 13.33 |
| (km s-1)a | 1510 | 1568 |
| (Jy km s-1)a | 15.7 | 11.2 |
| Inclination (deg)b | 90 | 74 |
| Position angle (deg) | 20 | 83 |
A major merger origin for S0 galaxies with counter-rotating gas is thus a possibility, but other plausible scenarios include minor mergers, accretion of gas from a flyby or secondary gas infall (Kannappan & Fabricant 2001 and references therein). In a recent spectroscopic study of 30 edge-on disc galaxies, Bureau & Chung (2006) reported the discovery of counter-rotators in 10% of their sample or of the S0’s only (see also Chung & Bureau, 2004; Bureau & Freeman, 1999), consistent with the findings of Bertola et al. (1992) and Kuijken et al. (1996). NGC 128, NGC 1596 and NGC 3203 revealed ionized gas (mainly [Oiii]) rotating in the opposite direction to the bulk of the stars. These 3 galaxies have many properties in common: 1) they are all morphologically S0’s, 2) as edge-on systems, they all show a boxy or peanut-shaped (B/PS) bulge, 3) the ionized gas is only seen within a 15 arcsec (typically kpc) region around the center and is highly asymmetric, and 4) all of them have galaxies nearby in projection on the sky and in a similar redshift range, except for NGC 3203 whose companions have unknown redshifts.
The existence of nearby galaxies around these counter-rotators suggests that the origin of the counter-rotating gas is external and related to tidal interactions or merger events. To find direct evidence of this, we obtained H I follow-up observations of these three galaxies. We additionally observed NGC 7332, a similar counter-rotator (Fisher, Illingworth & Franx 1994) recently studied in detail by Falcn-Barroso et al. (2004).
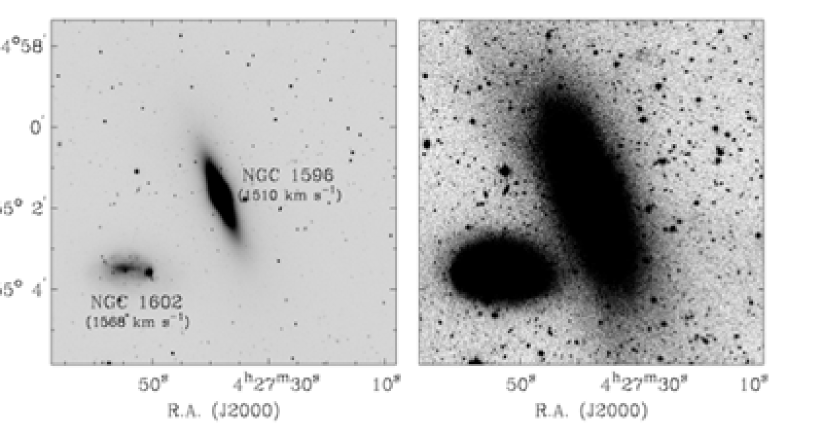
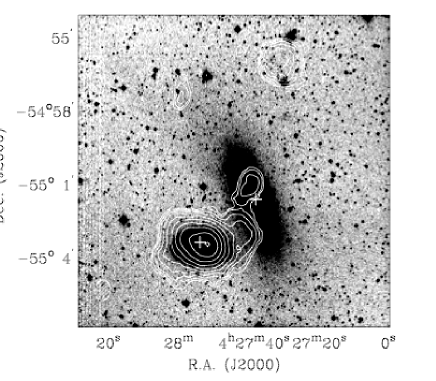
In this paper, we present H I observations of NGC 1596 using the Australia Telescope Compact Array (ATCA)111The ATCA is part of the Australia Telescope which is funded by the Commonwealth of Australia for operation as a National Facility managed by CSIRO.. H I observations of the other three systems using the Very Large Array (VLA) will be presented elsewhere. The redshifts measured in H I are 1510 km s-1 for NGC 1596 and 1568 km s-1 for NGC 1602, its dwarf companion (Reif et al., 1982). Assuming a distance of 18 Mpc (corrected for Virgocentric infall), the projected distance between NGC 1596 and NGC 1602 is 15.7 kpc, less than the distance between the Milky Way and the Large Magellanic Cloud. NGC 1596 is about four times brighter than NGC 1602 in the band. It is an S0 galaxy with a B/PS bulge, probably the edge-on view of a thickened bar (Chung & Bureau, 2004). NGC 1602 is a dwarf irregular galaxy (IB(s)m pec). A deep optical image (Fig. 1; Pohlen et al., 2004) reveals extended stellar envelopes around both galaxies. Pohlen et al. (2004) argue that the outer envelope of NGC 1596 has been disturbed by the interaction with NGC 1602. The general properties of the two galaxies are summarised in Table 1.
In this paper, we will address the following questions:
-
1.
Are these two galaxies, NGC 1596 and NGC 1602, actually interacting with each other as Pohlen et al. (2004) suggested? What is the evidence for the interaction found in the H I observations?
-
2.
If so, is the interaction responsible for the counter-rotating gas in NGC 1596, i.e. does the gas originate from the accreted material?
-
3.
If the origin is accretion, then what is the timescale of the interaction, to go from tidal features to counter-rotating gas?
-
4.
What are the other consequences of the interaction? How does the tidal interaction between NGC 1596 and NGC 1602 influence their morphological types (e.g. is it responsible for the bar of NGC 1596 or possibly of NGC 1602)?
Since this study focuses on only one galaxy, we do not present statistics on counter-rotators, but will focus instead on providing ideas on how counter-rotation between gas and stars can arise. For a discussion of the frequency of counter-rotators, see the recent paper by Bureau & Chung (2006).
2 Observations and Data Reduction
| Configurations | EW352 (2003 Oct 67) | |
|---|---|---|
| 1.5D (2003 Nov 1011) | ||
| 750A (2004 Feb 2021) | ||
| Pointing center (J2000) | RA: 04h27m46.3s | |
| Dec: 0229.5 | ||
| Primary calibrator | PKS 1934638 | |
| Secondary calibrator | PKS 0407658 | |
| H I | 20 cm continuum | |
| Central frequency (MHz) | 1413 | 1384 |
| Total bandwidth (MHz) | 8 | 128 |
| No. of channels per polarization | 512 | 32 |
| Primary beam (FWHM) | 337 | 344 |
The observations were made using the ATCA on 2003 October 6-7, November 10-11 and 2004 February 20-21. In order to get good coverage the data were obtained using three arrays (EW352, 750A and 1.5D), for 12 hr each. H I line and continuum data were obtained simultaneously in two (XX,YY) and four (XX,YY,XY,YX) polarizations, respectively. The H I line observations were centered at 1413 MHz with an 8 MHz bandwidth and 512 channels per polarization. This set-up yields km s-1 velocity coverage and km s-1 per channel. The continuum was centered at 1384 MHz with a 128 MHz bandwidth and 32 channels per polarization. The pointing was centered between NGC 1596 and NGC 1602. For further details of the observations, see Table 2.

The data were calibrated with the MIRIAD (Multichannel Image Reconstruction, Image Analysis and Display) package. Antenna gains were derived from the flux of PKS 1934638, which was observed at the beginning of each run. Phase variations during the observations were corrected using PKS 0407658, which was monitored once every 50 minutes. Bad data were manually flagged and the continuum was subtracted using a linear fit through the line free channels, as determined from the single-dish H I global profile (HIPASS; Koribalski et al. 2004; see Fig. 2).
An image cube was generated by combining the data from the three configurations. In order to maximise sensitivity without unnecessarily degrading the spatial resolution, we applied a weighting scheme intermediate between uniform and natural (but closer to natural) by setting robust=1 (Briggs, 1995). The H I cube was Hanning-smoothed in velocity to a resolution of 6.6 km s-1, cleaned and corrected for primary-beam attenuation.
The beam size of the H I data cube made from the combined data sets is and the rms noise is 1.9 mJy per beam per 6.6 km s-1 channel. This corresponds to a sensitivity limit of 3 atoms cm-2 per channel, which should be sufficient to detect tidal features (Hibbard & van Gorkom, 1996). A 20 cm continuum map was obtained by averaging the continuum channels. The continuum synthesized beam is and the rms noise is 0.33 mJy beam-1. Unless it is noted, the H I data presented in this paper are the combined results from the three array configurations. H I cubes of each array separately were however also generated. The resultant beam sizes are , and for the individual H I cubes from the EW352, 750A and 1.5D configurations, respectively.
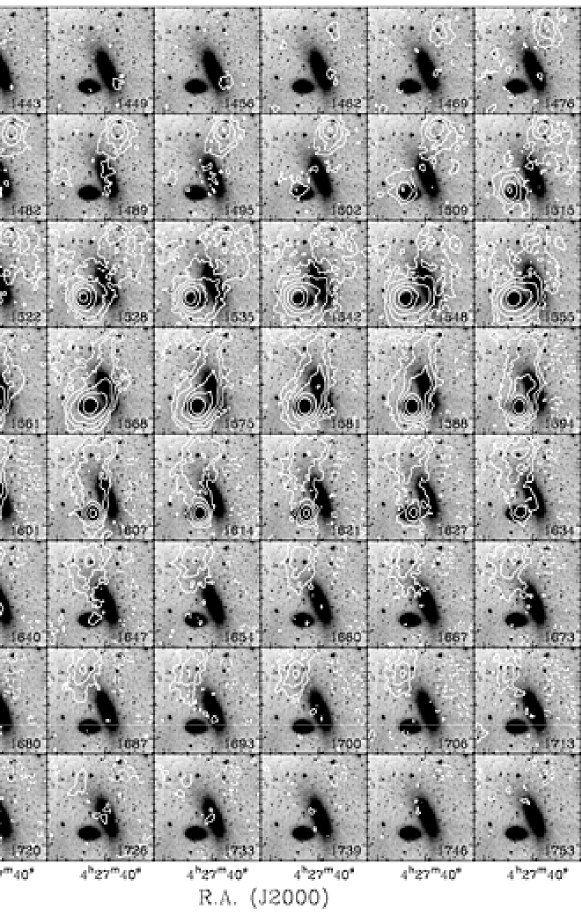
Total H I maps were obtained by summing along the velocity axis using the task momnt in NRAO’s Astronomical Image Processing System (AIPS). In order to preserve diffuse and extended features, a relatively low cutoff was used and pixels above in a cube smoothed by a factor of 2 spatially and spectrally were used as a mask for the full resolution cube. To illustrate the intricate kinematic structure of this system, we use channel maps, 3-dimensional rendering of the cube and position-velocity diagrams.
| peak | ||||
|---|---|---|---|---|
| ( cm-2) | (Jy km s-1) | () | km | |
| NW tail | 3.1 | 6.3 | 0.48 | |
| NGC 1602 | 10.0 | 19.1 | 1.46 | |
| NGC 1596 | 3.3 | 0.25 | ||
| NE tail | 1.8 | 4.6 | 0.35 | |
| Total | 10.0 | 33.0 | 2.52 |
3 Results
3.1 H I distribution and kinematics
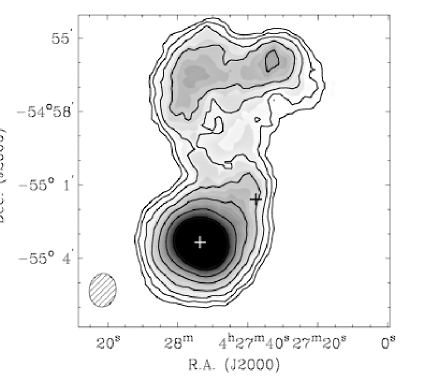
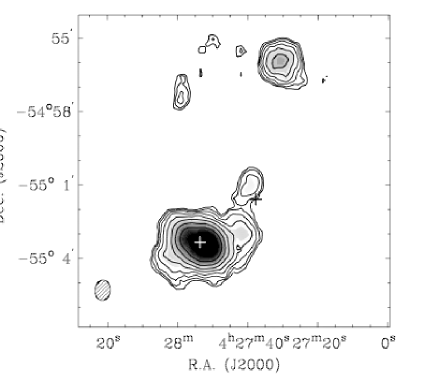
H I is found in a broad region around NGC 1596 and NGC 1602 with an extension of N-S, E-W and a velocity range of 250 km s-1 (see Figs. 2-4). Assuming an 18 Mpc distance, this corresponds to kpc2. Most of the gas is concentrated around NGC 1602, which is clearly the main and presumably the original reservoir of H I. The extended H I appears to show two tidal tails, one to the NNW and the other one to the NNE from NGC 1602, at lower and higher velocities respectively (hereafter NW tail and NE tail). The H I total flux of 33.01.3 Jy km s-1 seen by ATCA is in agreement with the flux of 36.54.4 Jy km s-1 found by HIPASS (Koribalski et al., 2004), so the interferometer appears to have detected most of the extended H I emission (Fig. 2).
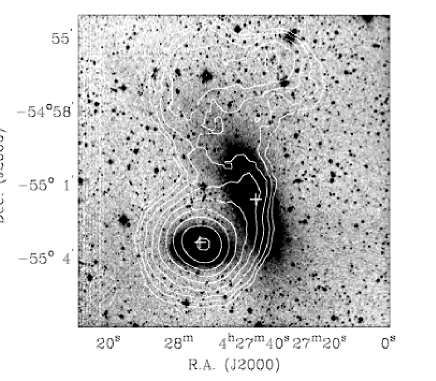
Total H I maps are presented in Figure 4. The region around NGC 1602 contains 58% of the total flux (19.1 Jy km s-1 or ). The structure is highly asymmetric, the H I stretching in the direction of NGC 1596. Based on the highest resolution map (beam ), the peak in H I emission is offset to the west by compared to NGC 1602’s optical center. In Figure 4, we additionally present the total H I map generated from the two high resolution data sets only (1.5D and 750A). The offset of the H I distribution from the optical center and the extended outer envelope toward NGC 1596 appear more clearly in total H I maps of higher resolutions.
The H I surrounding NGC 1596 is far from that of normal spirals. About 10% of the total flux (3.3 Jy km s-1 or ) is found within an ellipse of major-axis centered on NGC 1596, without any distinctive concentration. The peak column density within the optical radius of NGC 1596 is about cm-2.
The properties of these distinct regions are summarised in Table 3.
The NW tail is quite distinct from the rest of the H I structure both kinematically and morphologically. It extends from 1462 to 1528 km s-1 (Fig. 3), containing 19% of the total flux (6.3 Jy km s-1 or ). The H I emission peaks at , with a column density of cm-2. Note that the deep optical image shows very faint emission at the tip of the NW tail (near , ), coincident with the H I peak. This may in fact be a tidal dwarf as discussed in section 4. The tail can be most clearly seen extending from the dwarf to NGC 1602 in channels, 1469-1509 km s-1.
The rest of the structure, i.e. the NE tail, extends from 1548 to 1733 km s-1 (Fig. 3) and contains about 14% of the total flux (4.6 Jy km s-1 or ). The peak emission is not so different, with a highest column density of 1.8 cm-2 (, ).
3.2 20 cm radio continuum
We do not detect NGC 1596, NGC 1602 or the tidal tails in the continuum down to a 3 limit of 1 mJy beam-1 (a star formation rate of 0.09 yr-1; Hopkins et al. 2003). A prominent source (PMN J0427-5506) is however located just south of NGC 1596 and NGC 1602, with a peak of 0.24 Jy per beam (, ). Our measurement at 1.4 GHz fits nicely in the middle of previous measurements at 4.85 GHz (107 mJy; Wright et al., 1994) and 0.843 GHz (46614 mJy; Mauch et al., 2003). No H I absorption was detected against PMN J0427-5506.
4 Discussion
4.1 Interaction Scenario
The H I morphology and kinematics suggest that some H I gas has been tidally stripped from NGC 1602 by NGC 1596.
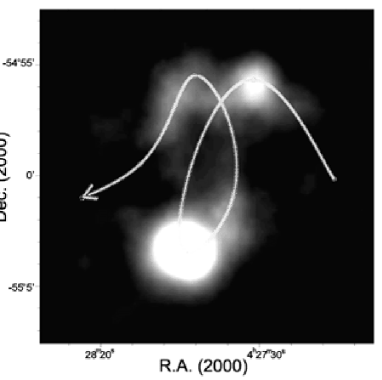
First, two arms (the NW and NE tails) are located at velocities lower and higher than NGC 1602, suggesting that they point in opposite directions with respect to each other along the line-of-sight, similarly to the features formed in tidal interactions (e.g. Toomre & Toomre, 1972).
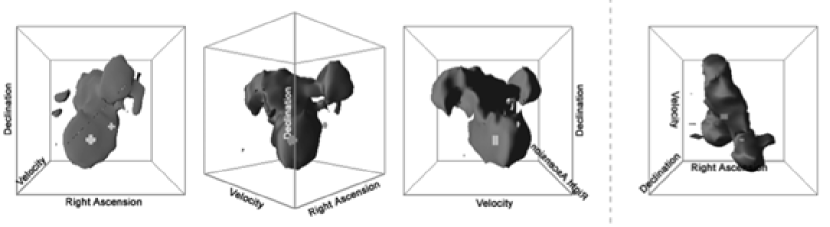
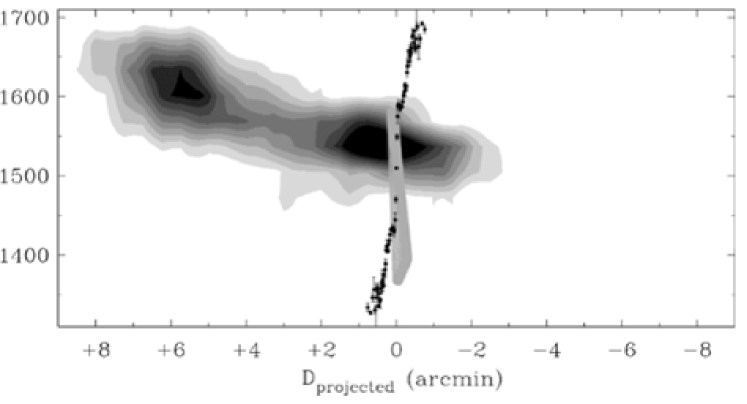
Second, the complex H I morphology strengthens the suggestion made by Pohlen et al. (2004) that NGC 1596 and NGC 1602 have interacted in the past. NGC 1602 most likely had a very extended H I disc, as is common for dwarf irregular galaxies (e.g. Hunter et al., 1998). One or several close passages of NGC 1602 near the H I poor S0 galaxy NGC 1596 pulled out what appears to be two H I tidal tails. The two tails can best be seen in Figures 5 and 6. In Figure 5, we present 3D renderings of the H I cube, indicating where NGC 1596 and NGC 1602 are in the plane of the sky and along our line-of-sight. Note that the tails are very distinct in velocity. Figure 6 shows a position-velocity cut along the two tails. The continuous velocity gradient along both tails is remarkable, though there is a kink in velocity between the NW tail and NGC 1602. This kind of jump has been seen before in the tidal tail of a merger remnant (NGC 7252; Hibbard & Mihos, 1995, see their Fig. 1), and could be the combined effect of a projection and the tidal tail detaching itself, forming a dwarf galaxy.
Since the tails are in different orbital planes (they would otherwise cross), more than one close passage must have taken place. Indeed, Salo & Laurikainen (2000) showed in their N-body model of M51 that significant out-of-plane velocities can be produced through multiple encounters. We speculate that the NW tail was pulled out in a first encounter, while the NE tail was pulled out in a second closer passage. The asymmetric H I distribution in NGC 1602 (toward NGC 1596) also suggests that this is the most recent event (Figs. 4 and 5). The higher resolution H I image of NGC 1602 even shows a hint of a counter tail in the east.
Third, NGC 1596’s stripping of the H I gas from NGC 1602 is plausible in terms of timescales. Assuming that the total H I found in this region used to belong to NGC 1602, roughly 0.9 of H I has been stripped. The NW and NE tail are about 49 kpc and 38 kpc long, respectively, projected on the sky (from the center of NGC 1602 to where those concentrations are present; see section 3). The H I kinematics tells us that it would take roughly yr for the gas to travel from the center of NGC 1602 to where the tails reach at present. Since there must have been at least two passages, this yields a lower limit of about 1 Gyr to form both tails. Some simulations (e.g. Hibbard & Mihos, 1995) show that it is possible to form tails with those lengths in such time scales. Note that the H I mass found in tidal features can be as large as (e.g. in the Southern tail of NGC 3921; Hibbard & van Gorkom, 1996). These properties suggest that most of the gas originally belonged to NGC 1602 and that some of the H I has been stripped by the interaction with NGC 1596, forming the two tidal tails.
4.2 Origin of the Counter-Rotating Ionized Gas
The question remains whether the stripped H I is responsible for the counter-rotating ionized gas found in NGC 1596.
First, the fact that there is a large gas reservoir available around NGC 1596 makes the connection between the H I and the counter-rotating ionized gas more likely than an internal origin.
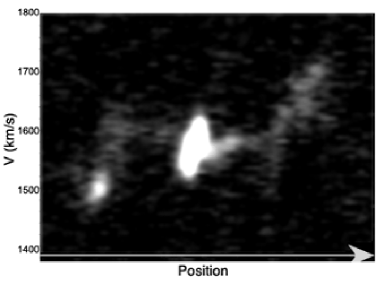
In addition, the H I and the ionized gas have the same velocity gradient, opposite to that of the stars. In Figure 7, the H I position-velocity diagram (PVD) along the major-axis of NGC 1596 is compared with that of the ionized gas found in the optical spectra and the stellar rotation curve. The H I concentration to the NE and over a large velocity range is the NE tail. It is clear that the H I and the ionized gas have the same velocity gradient, both rotating in the opposite direction to the stars. Whether the accreted gas is co- or counter-rotating with the disc clearly depends on how it falls in. However, the large-scale agreement between the velocity gradient of the H I and the ionized gas in the disc of NGC 1596 (Fig. 7) makes the connection between the H I gas of NGC 1602 and the ionized gas in NGC 1596 more plausible. The counter-rotating ionized gas in NGC 1596 very likely originated from the H I gas stripped from NGC 1602, which must have been accreted in retrograde motion with respect to the stellar disc.
Given the highly asymmetric distribution of the ionized gas in the disc of NGC1596, there must not have been enough time for the accreted material to totally settle. The accretion onto NGC 1596 must have been ongoing for not much longer than yrs, i.e. one rotation period.
4.3 Other Consequences of the Interaction
There is a local H I peak in the NW tail which also shows a faint stellar counterpart (, ). The peak gas column density of this region in fact exceeds the standard star formation threshold (Kennicutt, 1989) and Ferguson & Sandage (1990) identified a distinct object in this location, classifying it as dwarf elliptical ( and mag). This object is however not likely to be a normal dwarf elliptical, based on its high gas-to-light ratio. The H I mass within around (), where the kinematics is fairly well defined (Fig. 6), is 4.8. This yields / (or, assuming a linewidth of 60 km s-1, /164 ), which is much larger than that of typical dE galaxies (, e.g. Gottesman & Johnson, 1983; Bouchard et al., 2005). Also, since gas rich low surface brightness galaxies have / and / in the range of and , respectively (Freeman, 1997), it is also unlikely that the object is an LSB galaxy.
This faint optical counterpart is thus more likely to be a dwarf formed at the end of one tidal arm than a normal dE or an LSB that was there before the interaction started. The idea of creating dwarf galaxies in collisions of galaxies (tidal dwarfs or TDGs) was first proposed by Zwicky (1956) and a fair number of candidates have been found (e.g. in NGC 4038/9, “the Antennae”; Hibbard et al. 2001 and references therein). Deep H/ imaging or metallicity measurements should enable us to sort out this issue.
As shown in Figure 5, the tidal tails are not in the same orbital plane, implying that there must have been more than one close approach between the two galaxies. It is possible that NGC 1596 was approached from the back side of NGC 1602 along the line-of-sight, pulling out the NW tail first and the NE tail more recently. This time sequence is also consistent with the fact that only the NW tail shows a stellar counterpart. The stars could have formed in situ in the NW tail, or alternatively they may have been stripped with the gas in the tidal encounter. Further optical observations (e.g. H imaging or spectroscopy) should also help to sort this out. Some of the gas from the NE tail must have been accreted onto NGC 1596 (in retrograde motion with respect to the stars) after the second approach.
It is worth recalling that NGC 1596 possesses a boxy bulge, one of the morphological signatures of a thickened bar seen edge-on (e.g. Combes & Sanders, 1981; Combes et al., 1990). NGC 1596 also revealed kinematic signatures of a bar in the study by Chung & Bureau (2004). The bar may have contributed to transport the material to the central part of the disc, although such processes are inefficient for counter-rotating material. It is also possible that the interaction with NGC 1602 accelerated the formation of the bar in NGC 1596 (or vice-versa) as has been shown to occur in simulations (e.g. Noguchi, 1987; Gerin et al., 1990; Mihos et al., 1995; Miwa & Noguchi, 1998).
5 Conclusion
We presented the H I distribution and kinematics of the galaxy pair NGC 1596/NGC 1602 and its surrounding. H I is found in a broad region covering NGC 1596 and its H I-rich companion NGC 1602. This region corresponds to 70 kpc2 assuming an 18 Mpc distance. The total H I mass found is 2.5 and about half of this is concentrated in and around NGC 1602. Both the H I morphology and kinematics suggest that NGC 1602 is the main gas reservoir. Two tidal tails are found, respectively at lower and higher velocities with respect to NGC 1602, which were most likely caused by an interaction with NGC 1596. The counter-rotating ionized gas found in NGC 1596 thus probably originated from H I gas transferred from NGC 1602 to NGC 1596. Besides the fact that there is a huge gas reservoir available in this region, this is also supported by the consistent velocity gradient of the H I and the counter-rotating ionized gas along the major-axis of NGC 1596.
We find a local H I peak in the NW tail, where we also see a faint stellar counterpart. The / (or /) ratio of this region is unrealistically high for a normal dE or LSB galaxy, and it is more likely to be a dwarf that has formed at the tip of a tidal arm (TDG).
Our discovery of counter-rotating gas in the sample of Chung & Bureau (2004) was somewhat fortuitous. In spite of the difficulty to find such objects, they are known to be common (Bureau & Chung 2006 and references therein), and although there are only a few known counter-rotators showing direct evidence for ongoing accretion (e.g. IC 1459, Sadler et al., 2002), signatures of past mergers or hints of tidal interactions are found in a number of them (Schweizer, 1998). Counter-rotators thus support the idea that tidal interactions and accretion play an important role in galaxy formation and evolution.
Acknowledgments
We would like to thank Jim Caswell, Meryl Waugh, Lister Staveley-Smith and Emma Ryan-Weber for their technical advice during the observations and data reduction. We thank John Hibbard, Renzo Sancisi and Chris Mihos for their inspiring comments on this work, and the anonymous referee for comments that led to an improvement of the paper. We also thank Michael Pohlen who kindly provided the deep optical image of NGC 1596/1602. This work has been supported in part by NSF grant AST-00-98249 to Columbia University.
References
- Bertola et al. (1992) Bertola F., Buson L. M., Zeilinger W. W., 1992, ApJ, 401, L79
- Bouchard et al. (2005) Bouchard, A., Jerjen, H., Da Dosta, G. S., Ott, J., 2005, AJ, 130, 2058
- Briggs (1995) Briggs D. S. 1995, High Fidelity Deconvolution of Moderately Revolved Sources. Ph. D. thesis, New Mexico Institute of Mining and Technology
- Bureau & Freeman (1999) Bureau M., Freeman K. C., 1999, AJ, 118, 126
- Bureau & Chung (2006) Bureau M., Chung A., 2006, MNRAS, 366, 182
- Chung & Bureau (2004) Chung A., Bureau M., 2004, AJ, 127, 3192
- Combes & Sanders (1981) Combes F., Sanders R. H., 1981, A&A, 96, 164
- Combes et al. (1990) Combes F., Debbasch F., Friedli D., Pfenniger D., 1990, A&A, 233, 82
- De Rijcke et al. (2004) De Rijcke S., Dejonghe H., Zeilinger W. W., Hau G. K. T., 2004, A&A, 426, 53
- de Vaucouleurs et al. (1991) de Vaucouleurs G., de Vaucouleurs A., Corwin H. G., Buta R. J., Paturel, G., Fouque, P., 1991, Third Reference Catalogue of Bright Galaxies (RC3)
- Falcn-Barroso et al. (2004) Falcn-Barroso J., et al., 2004, MNRAS, 350, 35
- Fisher et al. (1994) Fisher D., Illingworth G., Franx M., 1994, AJ, 107, 160
- Ferguson & Sandage (1990) Ferguson, H. C., Sandage, A., 1990, AJ, 100, 1
- Freeman (1997) Freeman, K., 1997, PASA, 14, 4
- Geha et al. (2005) Geha M., Guhathakurta P., van der Marel R. P., 2005, AJ, 129, 2617
- Gerin et al. (1990) Gerin M., Combes F., Athanassoula E., 1990, A&A, 230, 37
- Gottesman & Johnson (1983) Gottesman, S. T., Johnson, D. W., 1983, IAUS, 100, 307
- Hibbard & Mihos (1995) Hibbard J. E., Mihos J. C., 1995, AJ, 110, 140
- Hibbard & van Gorkom (1996) Hibbard J. E., van Gorkom J. H., 1996, AJ, 111, 655
- Hibbard et al. (2001) Hibbard J. E., van der Hulst J. M., Barnes J. E., Rich R. M., 2001, AJ, 122, 2969
- Hopkins et al. (2003) Hopkins A. M., et al., 2003, ApJ, 599, 971
- Hunter et al. (1998) Hunter D. A., Wilcots E. M., van Woerden H., Gallagher J. S., Kohle S., 1998, ApJ, 495, 47
- Kannappan & Fabricant (2001) Kannappan S. J., Fabricant D. G., 2001, AJ, 121, 140
- Kennicutt (1989) Kennicutt R., 1989, 344, 685
- Koribalski et al. (2004) Koribalski B. S., et al., 2004, AJ, 128, 16
- Kuijken et al. (1996) Kuijken K., Fisher D., Merrifield M. R., 1996, MNRAS, 283, 543
- Mauch et al. (2003) Mauch T., Murphy T., Buttery H. J., Curran J., Hunstead R. W., Piestrzynski B., Robertson J. G., Sadler E. M, 2003, MNRAS, 342, 1117
- Mihos et al. (1995) Mihos J. C., Walker I. R., Hernquist L., Mendes de Oliveira C., Bolte M., 1995, ApJ, 447, 87
- Miwa & Noguchi (1998) Miwa T., Noguchi M., 1998, ApJ, 499, 149
- Noguchi (1987) Noguchi M., 1987, MNRAS, 228, 635
- Pohlen et al. (2004) Pohlen M., Balcells M., Ltticke R., Dettmar R.-J., 2004, A&A, 422, 465 (astro-ph/0404164)
- Reif et al. (1982) Reif K., Mebold U., Goss W. M., van Woerden H., Siegman B., 1982, A&AS, 50, 451
- Rubin (1994) Rubin V. C., 1994, AJ, 108, 456
- Sadler et al. (2002) Sadler E. M., Oosterloo T., Morganti R., 2002, ASP Conf. Ser. 273: The Dynamics, Structure, & History of Galaxies: A Workshop in Honour of Professor Ken Freeman, 273, 215
- Salo & Laurikainen (2000) Salo H., Laurikainen E., 2000, MNRAS, 319, 377
- Schweizer (1998) Schweizer F., 1998, Galaxies: Interactions and Induced Star Formation, ed. D. Friedli, L. Martinet, D. Pfenniner (Saas-Fee Advanced Course 26, Berlin: Springer), pp. 181188
- Schweizer & Seitzer (1998) Schweizer F., Seitzer P., 1998, AJ, 116, 2206
- Toomre & Toomre (1972) Toomre A., Toomre J., 1972, ApJ, 178, 623
- Wright et al. (1994) Wright A. E., Griffith M. R., Burke B. F., Ekers R. D., 1994, ApJS, 91, 111
- Zwicky (1956) Zwicky F., 1956, Ergebnisse der Exakten Naturwissenschaften, 29, 344