Hubble Space Telescope NICMOS Observations of T Dwarfs: Brown Dwarf Multiplicity and New Probes of the L/T Transition
Abstract
We present the results of a Hubble Space Telescope NICMOS imaging survey of 22 T-type field brown dwarfs. Five are resolved as binary systems with angular separations of 005–035, and companionship is established on the basis of component F110W-F170M colors (indicative of CH4 absorption) and low probabilities of background contamination. Prior ground-based observations show 2MASS 1553+1532AB to be a common proper motion binary. The properties of these systems – low multiplicity fraction (11% resolved, as corrected for sample selection baises), close projected separations ( = 1.8–5.0 AU) and near-unity mass ratios — are consistent with previous results for field brown dwarf binaries. Three of the binaries, 2MASS 0518-2828AB, SDSS 0423-0414AB and SDSS 1021-0304AB, have components that span the poorly-understood transition between L dwarfs and T dwarfs. Spectral decomposition analysis of SDSS 1021-0304AB reveals a peculiar flux reversal in this system, with a T5 secondary that is 30% brighter at 1.05 and 1.27 than the T1 primary. This system, 2MASS 0518-2828AB and SDSS 1534+1615 all demonstrate that the -band brightening observed between late-type L to mid-type T dwarfs is an intrinsic feature of this spectral transition, albeit less pronounced than previously surmised. We also find that the resolved binary fraction of L7 to T3.5 dwarfs is twice that of other L and T dwarfs, an anomaly that can be explained by a relatively rapid evolution of brown dwarfs through the L/T transition, perhaps driven by dynamic (nonequilibrium) depletion of photospheric condensates.
Subject headings:
stars: binaries: visual — stars: fundamental parameters — stars: individual (SDSS J042348.57041403.5, 2MASS J051859952828372, SDSS J092615.38+584720.9, SDSS J102109.69030420.1, 2MASS J15530228+1532369) — stars: low mass, brown dwarfs1. Introduction
Multiple star systems are of fundamental importance in the study of stellar populations, and by inference much of galactic and extragalactic astrophysics. These systems remain the predominant outlet for the direct measurement of individual stellar masses, either through the detection of orbital motion or microlensing techniques (An et al., 2002). Eclipsing binaries also enable measurement of stellar radii. The properties of and interactions between the components of multiple star systems are fundamental to the phenomena of cataclysmic variables, X-ray binaries, Type Ia supernovae, planetary nebulae and several classes of peculiar stars. Indeed, the creation of multiple systems is inherent in the star formation process itself. Measurement of multiplicity statistics — the binary fraction, mass ratio distribution and separation distribution — provide key empirical constraints on star formation theory. The formation and character of planet-forming debris disks around young stars can be modulated by the presence of companions. Finally, coeval binary systems provide a unique control environment for studying the detailed physical properties of individual stars, yielding insight on the general characteristics of a stellar class.
Multiple systems have been particularly useful in the study of brown dwarfs, stars with insufficient mass to sustain core hydrogen fusion (Kumar, 1962; Hayashi & Nakano, 1963). Indeed, many of the first brown dwarfs to be identified are members of nearby multiple systems (Becklin & Zuckerman, 1988; Nakajima et al., 1995; Oppenheimer et al., 1995; Rebolo et al., 1998). Over the past few years, high resolution imaging and spectroscopic surveys of very low mass (VLM; M 0.1M☉) stars and brown dwarfs in the field and in young stellar clusters have revealed roughly 75 binaries (cf. Burgasser et al. 2006b111A current list of known VLM binaries is maintained by N. Siegler at the Very Low Mass Binaries Archive, http://paperclip.as.arizona.edu/$∼$nsiegler/VLM_binaries/.), with intriguing results. The resolved VLM binary fraction (the frequency of binary systems in a given sample of stars) is 10-20%, significantly lower than the binary fractions of solar-type stellar systems (65%; e.g. Abt & Levy 1976; Duquennoy & Mayor 1991) and early-type M stars (30–40%; e.g. Fischer & Marcy 1992; Reid & Gizis 1997; Delfosse et al. 2004), indicating a decline in the binary fraction with later spectral types (Bouy et al., 2006). The resolved binary fraction is likely a lower limit to the true binary fraction due to the existence of unresolved, closely separated systems (Maxted & Jeffries, 2005). This possibility is an important consideration for low-mass systems, for while the distribution of separations of F- through M-type stellar pairs is quite broad, ranging over 0.1 AU to 0.1 pc, 90% of all known VLM binaries have projected separations 20 AU (Burgasser et al., 2006b), with maximum separations scaling with total system mass (Close et al., 2003; Burgasser et al., 2003c, however, see Luhman 2004 and Billeres et al. 2005). The mass ratio distribution of resolved VLM binaries is also distinct, peaking sharply at (Reid et al., 2001; Bouy et al., 2003; Burgasser et al., 2003c), in contrast to the relatively flat mass ratio distributions of stellar systems (e.g., Mazeh et al. 1992). These properties have led researchers to suggest that VLM stars and brown dwarfs may form via a different mechanism than stars (e.g., Bate, Bonnell & Bromm 2002), although this idea remains controversial (e.g., Luhman 2004). More concretely, astrometric and spectroscopic followup of VLM binaries have provided the first brown dwarf mass measurements (Basri & Martín, 1999; Lane et al., 2001; Bouy et al., 2004; Brandner et al., 2004; Zapatero Osorio et al., 2004; Stassun et al., 2006), important empirical constraints for theoretical evolutionary models.
In order to constrain the binary properties of brown dwarfs in greater detail, to identify new systems useful for mass measurements, and to search for very low luminosity brown dwarf companions, we have conducted a high resolution imaging survey of 22 T dwarfs using NICMOS on the Hubble Space Telescope (hereafter, HST). T dwarfs are the lowest luminosity (L 310-5 L☉) and coldest (Teff 1400 K; Golimowski et al. 2004) brown dwarfs currently known. They are distinguished by the presence of strong H2O and CH4 absorption bands in their near infrared spectra (Burgasser et al., 2002c; Geballe et al., 2002) and the absence of photospheric condensates that dominate warmer L dwarf atmospheres (Marley et al., 1996; Tsuji et al., 1996; Allard et al., 2001). We have identified five binaries in our sample, of which three have well-resolved components allowing detailed characterization of their empirical properties.
Observations are described in 2, including the sample composition, observing strategy and data reduction. In 3 we present photometric results, including color/spectral type, photometric conversion and bolometric correction relations. In 4 we describe point spread function (PSF) fits to our resolved sources, and determine sensitivity limits for putative faint companions. Detailed analysis of individual systems is given in 5. In 6 we provide an updated assessment of the multiplicity properties of field brown dwarfs, including the overall binary fraction, separation distribution and mass ratio distribution. In 7 we examine what currently known brown dwarf binaries reveal about the poorly understood transition between L dwarfs and T dwarfs. Results are summarized in 8.
2. Observations
2.1. T Dwarf Targets
Observations presented here incorporate data from two HST programs, GO-9833 and GO-10247 conducted during Cycles 12 and 13, respectively. The first program targeted 22 T dwarfs identified in the Sloan Digitial Sky Survey (York et al., 2000, hereafter SDSS) and the Two Micron All Sky Survey (Skrutskie et al., 2006, hereafter 2MASS), spanning the full range of T spectral types (T0 to T8), including the lowest luminosity brown dwarf so far identified, 2MASS 0415-0935222We use abbreviated notation for sources in our observed sample throughout the text; e.g., 2MASS hhmmddmm, where the suffix is the J2000 sexigesimal Right Ascension (hours and minutes) and declination (degrees and minutes). Full source names and coordinates are provided in Table 1. (Burgasser et al., 2002c; Vrba et al., 2004; Golimowski et al., 2004). Twelve of these sources have measured parallaxes from Dahn et al. (2002); Tinney, Burgasser & Kirkpatrick (2003); and Vrba et al. (2004); and 17 have proper motion measurements (although several did not at the time HST images were obtained; see below). Program GO-10247 targeted the peculiar T1 dwarf 2MASS 0518-2828 (Cruz et al., 2004), a source suspected of being multiple due to its peculiar near infrared spectrum. A compilation of the observed properties of all of the sources is provided in Table 1.
2.2. Imaging and Data Reduction
Table 2 provides a log of our HST observations. Each target was imaged over one orbit in the three filters F090M (except SDSS 1254-0122), F110W and F170M using the highest-resolution camera NIC1 (pixel scale 0043, field of view 1111). 2MASS 0518-2828 was also observed with the F145M and F160W filters. The F110W and F170M filters sample the peak spectral flux of T dwarfs (around 1.2 ) and the 1.6 CH4 band, respectively, as illustrated in Figure 1. As the near infrared CH4 bands are primary classification diagnostics for T dwarfs (Burgasser et al., 2006a), F110W-F170M color can provide a rough estimate of spectral type (cf. 3.2) as well as a discriminant for bona-fide, low-temperature brown dwarf companions. The F090M filter samples the red wing of the pressure-broadened 0.77 K I doublet (Burrows, Marley, & Sharp, 2000; Allard et al., 2003; Burrows & Volobuyev, 2003), and provides an additional discriminant against background sources.
All data were acquired in MULTIACCUM mode. Multiple exposures in the F110W and F170M filters were obtained in a spiral dither pattern with steps of 13 ( 30 NIC1 pixels). Total integration times in these two filters ranged over 791-912 s and 1519-1600 s, respectively, for the majority of our sample. Exceptions include 2MASS 0348-6022, which was observed for a longer period due to its location in the HST continuous viewing zone; and 2MASS 0518-2828, where shorter exposures were taken to allow observations in five filters over one orbit. Short (48-88 s), single F090M exposures were obtained for the GO-9833 targets. Multiple F090M, F145M and F160W exposures were obtained for 2MASS 0518-2828 using the same dither pattern as the F110W and F170M observations.
Several of our targets were not well centered on the NIC1 camera due largely to their uncertain or unknown proper motions at the time of the observations. The most extreme case is that of 2MASS 0727+1710. At the time of the HST observations the proper motion of 2MASS 0727+1710 had not been measured, so the telescope was pointed at the 1997.83 epoch position as measured by 2MASS. Unfortunately, this source has one of the largest proper motions in our sample, 12970005 (Vrba et al., 2004), and the resulting 83 motion between the 2MASS and HST imaging epochs was sufficient to move 2MASS 0727+1710 out of the NIC1 field of view. Observations of SDSS 0151+1244 were also offset due to source motion, and the object was imaged in the corner of the NIC1 camera’s field of view (12 from the closest edge of the array), limiting the area sampled for companions. The remaining sources were detected sufficiently close to the center of the NIC1 array (25 from the array edge) to provide adequate sampling of separations within the resolution of the original discovery surveys (– for SDSS and 2MASS).
Images were reduced by standard pipeline processing (CALNICA, Bushouse et al. 1997) using updated calibration images and photometric keywords as of August 2004. CALNICA reduction includes analog-to-digital correction, subtraction of bias and dark current frames, linearity correction, correction for readout artifacts (the “bars” anomaly), division by an appropriate flat field image, photometric calibration, cosmic ray identification, and combination of MULTIACCUM frames into a single calibrated image. Post-CALNICA processing was limited to the cleaning of cosmic rays and persistent bad pixels by nearest-neighbor interpolation, and the mosaicking of the F110W and F170M dithered image sets (and all five filter sets of 2MASS 0518-2828) using the CALNICB routine.
2.3. Resolved Sources
Subsections (2525) of the reduced F090M, F110W and F170M mosaic images for each source are shown in Figure 2. North/east orientations are indicated by arrows, and the images are scaled logarithmically to highlight low flux features. Note the clearly resolved PSFs in most of the F110W and F170M images, resulting in significant structure outside of the core of the PSF including first-order Airy rings and diffraction spikes at wider separations. Three sources immediately stand out as obvious doubles. The previously reported binary SDSS 0423-0414 (Burgasser et al., 2005b) shows two overlapping PSFs roughly oriented along a NNE/SSW axis, with the northern component appearing to be slightly fainter in the F110W and F170M bands. SDSS 1021-0304 also appears to be a close double aligned along a ENE/WSW axis, with the western component appearing to be fainter at both F090M and F170M, but not F110W. 2MASS 1553+1532 is a well-resolved pair aligned along a N/S axis, with the southern component appearing to be slightly fainter at F090M (it is marginally detected in this band), F110W and F170M. This source had previously been reported as a candidate binary by Burgasser, Kirkpatrick & Brown (2002).
In addition to these three sources, PSFs of 2MASS 0518-2828 and 2MASS 0926+5847 are slightly elongated in the HST images and therefore also appear to be double. These sources are shown in more detail in Figure 3, which displays contour plots of the central 0909 regions of the F090M and F110W images around 2MASS 0518-2828 and SDSS 0926+5847, respectively, and equivalent data for the unresolved source 2MASS 1503+2525. 2MASS 0518-2828 is slightly elongated along a N/S axis (PSF full width at half maximum of 1.86 pixels, as compared to 1.57 pixels for 2MASS 1503+2525), with the shape of its southern extension indicating a fainter component. All three F090M images obtained for 2MASS 0518-2828 show the same elongation in the same orientation, lending confidence to its reliability. The elongation is less obvious in the F110W and F145M images of this source, and marginally detected in the F160W and F170M images, presumably because it is obscured by the broader PSF at these wavelengths. SDSS 0926+5847 is clearly elongated along a NW/SE axis (PSF FWHM of 2.67 pixels at F110W, versus 2.06 pixels for 2MASS 1503+2525), and appears to be more symmetric, suggesting near-equal brightness components. Again, the same elongation is seen in each of the F110W and F170M exposures (the source is only marginally detected at F090M). We therefore conclude that both systems are resolved doubles. PSF fits for all of the doubles are presented in 4. The remaining 17 targets appear to be single at the resolution of the NIC1 camera.
3. NICMOS Photometry
3.1. Measurements
Aperture photometry for all of the sources in our sample were measured from the individual calibrated images using the IRAF333IRAF is distributed by the National Optical Astronomy Observatories, which are operated by the Association of Universities for Research in Astronomy, Inc., under cooperative agreement with the National Science Foundation. PHOT routine. Various aperture radii ranging from 2-20 pixels (0086-086) about the source flux peak were examined, with a common background annulus of 20-30 pixels (086-13). Integrated source count rates were converted to photometric magnitudes on the Arizona Vega system ( = 0.02) using the photometric keyword parameter PHOTFNU and Vega fluxes of 2157.3, 1784.9 and 946.1 Jy at F090M, F110W and F170M, respectively (Schultz et al., 2005). Individual magnitudes from dithered exposure frames were averaged to derive a single photometric measurement for each source. F145M and F160W magnitudes for 2MASS 0518-2828 were similarly measured using Vega fluxes of 1197.1 and 1042.6 Jy, respectively.
Aperture corrections in the F110W and F170M filters were determined from observations of the three highest signal-to-noise (S/N) single sources in our sample, 2MASS 0348+6022, SDSS 1254-0122 and 2MASS 1503+2525. Comparison of integrated flux profiles as a function of aperture size between these sources demonstrates excellent agreement, with deviations of less than 0.01 mag for apertures wider than 4 pixels. For F090M observations, we adopted aperture corrections measured from observations of 2MASS 0518-2828, even though this source is slightly resolved (all other sources have insufficient S/N in this filter). Table 3 lists the aperture corrections obtained for each filter, corrected from an 11.5 pixel (049) reference aperture to an infinite aperture using values from Schultz et al. (2005).
Photometric measurements are listed in Table 4. For unresolved sources and the marginally resolved pairs SDSS 0926+5847 and 2MASS 0518-2828, we report 5-pixel (022) aperture photometry corrected to an infinite aperture using the values in Table 3. For the resolved doubles SDSS 0423-0414 and SDSS 1021-0304, we report 15-pixel (065) aperture photometry encompassing both components with no aperture correction. This aperture size was chosen as it includes 90% of the light in all three filters and minimizes photometric noise. For the well-resolved double 2MASS 1553+1532, we report corrected 3-pixel (013) aperture photometry for each component separately. Uncertainties include contributions from the scatter of individual measurements (typically 1-2%) and in the aperture corrections (1% for F110W and F170M, 5% for F090M), as well as 5% absolute calibration uncertainties and 1% zeropoint drift (Schultz et al., 2005). The 5% calibration uncertainties, which dominate the error budgets for F110W and F170M magnitudes, are highly correlated and reduce to 3% for NICMOS colors; e.g., F110W-F170M. These values are reported separately in Table 4. For 2MASS 0518-2828, we also measured F145M = 15.860.05 and F160W = 15.200.05.
Formal limiting magnitudes for each source field and filter were determined by PSF simulation. Scaled PSFs of 2MASS 1503+2525 were added onto blank regions of the individual F090M, F110W and F170M exposures and checked for visual detection. Reliable detections were possible for peak flux scalings of 7, 5 and 5 times the background noise at F090M, F110W and F170M, respectively. These limits are given in Table 2. There is a slight correlation of these limiting magnitudes with telescope pointing angle with respect to the Moon, likely the result of increased background emission. Several of our sources were detected in the F090M exposures at magnitudes below the formal detection limits, and have appropriately poorer S/N.
3.2. T Dwarf Colors
The original motivation for the filter set employed in this study was to provide adequate color discrimination of bona-fide companions from coincident background sources, and to determine photometric classifications. Figure 4 compares F110W-F170M colors to spectral type for sources in our sample and unresolved late-type L dwarfs observed in the HST NICMOS program of Reid et al. (2006a). Spectral types are based on optical spectroscopy for the L dwarfs and near infrared spectroscopy for the T dwarfs. We also show synthetic colors measured from low resolution near infrared spectra of late-type L and T dwarfs from Burgasser et al. (2006a). Earlier than type T1, F110W-F170M color is relatively constant at 1.8 mag, albeit with significant dispersion (0.3 mag) that is larger than the photometric uncertainties. For subclasses T1 and later, there is a tight correlation between spectral type and color. A linear fit to the photometric data for unresolved sources yields
| (1) |
(where SpT(T1) = 1, SpT(T5) = 5, etc.), with an RMS scatter of 0.4 subclasses. Thus, F110W-F170M is a reliable proxy for spectral type in the T dwarf regime. F090M-F110W color also provides a gross discriminant of T spectral type, as shown in Figure 5. These colors redden from 1.25 to 2.55 over spectral types T1 to T8, due largely to increased absorption by K I. However, photometric uncertainties are much larger for the F090M data, reducing its utility. We therefore focus on the F110W-F170M colors for our analysis.
Despite the apparent utility of HST colors to distinguish and classify T dwarfs, the vast majority of photometric data for these objects are from ground-based studies based principally on the (1.2 ), (1.6 ) and (2.0 ) telluric opacity windows. To put our photometry into context with existing data, we compared and magnitudes to and photometry, respectively, on the 2MASS and Mauna Kea Observatory (MKO; Simons & Tokunaga (2002); Tokunaga, Simons & Vacca (2002)) systems. MKO data were collated from Leggett et al. (2002); Knapp et al. (2004); and references therein444A compilation of these data is maintained by S. Leggett at http://www.jach.hawaii.edu/$∼$skl/LTdata.html.. Figure 6 compares -F110W and -F170M colors to F110W-F170M color for T dwarfs in our sample. We also plot MKO/NICMOS synthetic colors derived from low resolution near infrared spectroscopy (from Burgasser et al. 2006a) as a comparison. There is a marked difference between 2MASS and MKO -F110W colors. The former are roughly constant (-0.75 mag) for -0.2 F110W-F170M 1.7, but there is significant scatter (0.2 mag) due primarily to the large uncertainties associated with faint 2MASS T dwarf photometry (typically 0.04-0.10 mag). In contrast, MKO -F110W colors show a tight correlation with F110W-F170M color (MKO photometric uncertainties are typically 0.03-0.05 mag) and a 0.2-0.3 magnitude offset from 2MASS -F110W colors due to differences in the filter profiles (cf. Stephens & Leggett 2004). A polynomial fit to the MKO/NICMOS photometric data for unresolved sources yields the relation
| (2) | |||||
with a scatter of 0.04 mag. 2MASS and MKO -F170M colors are similar (the result of their equivalent -band filter profiles), and both span a wider range than -F110W colors due to strong 1.6 CH4 absorption in the later-type T dwarfs. -F170M color is also correlated with F110W-F170M color, and a fit to MKO photometry for unresolved sources yields
| (3) | |||||
with a scatter of 0.05 mag. Interestingly, the combined light colors of SDSS 1021-0304 fall well off both of these lines As discussed in 5.3, these discrepancies are due to the unique composition of the SDSS 1021-0304 system. Note that equivalent relations for 2MASS/NICMOS photometry are presented in Reid et al. (2006a).
In Figure 7 we plot derived F110W and F170M bolometric corrections (BC) for T dwarfs in our sample as a function of F110W-F170M color. These were computed from ground-based MKO photometry and -band BCs from Golimowski et al. (2004) as, e.g., . Again, there is good correlation between the NICMOS BCs and F110W-F170M color, and a polynomial fit to the F110W photometry of unresolved sources yields
| (4) | |||||
with a scatter of 0.07 mag.
4. PSF Fitting
4.1. Method
The properties of the five resolved doubles in our sample were determined by fitting individual images to PSF models using an algorithm similar to that described in Burgasser et al. (2003c). One important modification in this study was the use of model PSFs generated by the Tiny Tim program555See http://www.stsci.edu/software/tinytim/tinytim.html. (Krist, 1995). Tiny Tim was specifically designed to generate PSFs for HST imaging data, and includes mirror zonal errors and filter passband effects in the model PSF shape. We generated several grids of Tiny Tim PSFs for the F090M, F110W and F170M filters appropriate for the post-cryocooler NICMOS NIC1 detector, sampling 169 positions across the chip in row/column increments of 16 pixels. For each calibration image, our PSF fitting routine employed the model PSF located closest to the position of the target on the chip. We also used near infrared spectral data for SDSS 1021-0304 from Burgasser et al. (2006a) as input to the Tiny Tim program in order to model the appropriate spectral response across the passband. Model PSFs were sampled at 10 times the native pixel resolution of NIC1 for subpixel shifting.
PSF fits were made for 2525 subsections of each image centered on the target sources, and initial guesses for the pixel positions and fluxes of the two components were made using a simple peak detection algorithm (for the primary) and single-PSF subtraction (for the secondary). Model images were then generated using two Tiny Tim PSFs resampled to the resolution of the data and scaled to the estimated peak fluxes of the detected sources. Our routine then iteratively searched for the optimal solution to the primary position, secondary position, primary flux and secondary flux, in that order, by computing the residuals between the model image and the data. Positional shifts of 0.1 pixels were made by shifting the oversampled model PSFs in integer units, and then downsampling to the resolution of the data. Fluxes were varied in steps of 1% (0.01 mag). The PSF fits were done recursively for convergence; i.e., if better solutions to any of the four binary parameters were found, the routine retested all of the parameters starting with the primary position until no reduction in residuals could be made.
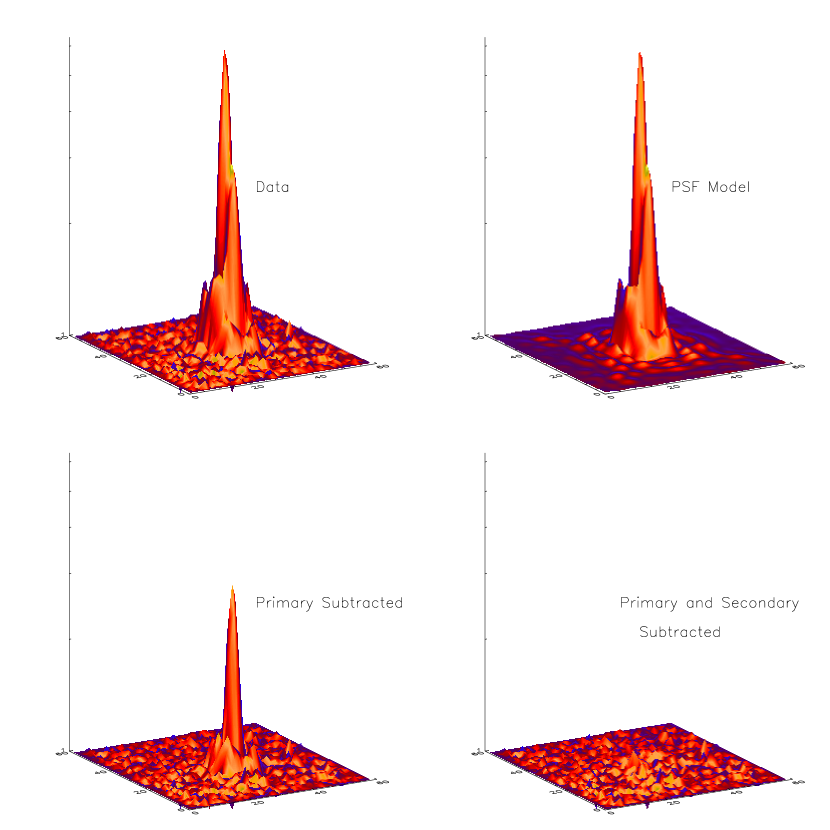
Figure 8 illustrates the quality of these fits for one of the F170M images of the SDSS 1021-0304 pair. Shown are surface plots of the original data on a logarithmic vertical scale (to bring up the background noise), the best-fit PSF model, the result of subtracting the primary PSF model from the data, and the result of subtracting the full PSF model from the data. The primary-subtracted image shows a well-resolved secondary component, with clear detection of that component’s first-order Airy ring. The final subtraction is extremely clean and average residuals (typically 1% of the peak source flux for all fits) are at the level of background noise.
Final estimates of the flux ratio, separation and position angles of each double were determined as the mean of individual determinations from each calibrated image, with some vetting of very poor fits caused largely by cosmic ray hits close to the target source. Uncertainties include scatter in the individual fits and systematic uncertainties of 0.01 mag and 0004 in flux ratio and separation, respectively, as prescribed by the fitting routine. These values are listed in Table 5
For the wider doubles SDSS 0423-0414, SDSS 1021-0304 and 2MASS 1553+1532, we estimate that additional systematic effects in the fitting process are insignificant given the well-resolved nature of these sources and minimal residuals. Indeed, resolved aperture photometry for the 2MASS 1553+1532 pair are consistent with the PSF results within measured uncertainties. For the closer binaries 2MASS 0518-2828 and SDSS 0926+5847, whose angular separations are less than 2 NIC1 pixels, systematic effects may be more important. To examine this possibility, we experimented with PSF fits to test data constructed to mimic the measured properties of the 2MASS 0518-2828 and SDSS 0926+5847 pairs in the F110W and F170M bands. A total of 300 test images were constructed for each target/filter simulation using random pairings of 2525 subsections of images for the brightest unresolved sources in our sample (2MASS 0348-6022, SDSS 1254-0122 and 2MASS 1503+2525, for a total of 23 PSF images at F110W and 13 PSF images at F170M). The selected PSF images were shifted by subpixel resampling to replicate separations and position angles randomly drawn from Gaussian distributions centered at the measured values of the binary under investigation, and with distribution widths twice the measured uncertainties. The secondaries in each test image were scaled to a flux ratio randomly drawn from a uniform distribution (in magnitude space) spanning 0 mag to the measured magnitude difference plus three times the measured uncertainty. These test images were then run through the same PSF fitting algorithm as described above to derive experimental values. Systematic effects were ascertained by selecting only those test cases where the experimental values agreed with the measured values for the binaries, and then computing the mean and standard deviation of the associated input parameters. For 2MASS 0926+5847, these simulations indicate that the underlying flux ratios for this system (F110W(sim) = 0.40.2, F170M(sim) = 0.40.3) are closer to unity, as suggested by visual inspection of the images themselves (cf. Figure 3). Similar systematic flux ratio offsets are indicated for 2MASS 0518-2828 (F110W(sim) = 0.80.5, F170M(sim) = 0.90.6). The flux ratio offsets are largely due to the PSF fitting algorithm attempting to fit both components with a single PSF, while the secondary PSF fits the largest peak in the residuals. There were no indications of systematic offsets in the separations or position angles of these systems, however. The “systematics-corrected” flux ratios resulting from these simulations are given in Table 5.
4.2. Results
The angular separations of our sources range from 00510012 (2MASS 0518-2828) to 03490005 (2MASS 1553+1532). Assuming spectrophotometric distance estimates for 2MASS 0518-2828, SDSS 0926+5847 and 2MASS 1553+1532 of 346, 387 and 122 pc based on their combined light 2MASS -band magnitudes (corrected for equal-brightness components) and the /spectral type relations of Tinney, Burgasser & Kirkpatrick (2003), projected separations range over 1.8-5.0 AU. These values are consistent with the small separations typically found for resolved brown dwarfs (Burgasser et al., 2006b).
Relative magnitudes and combined light photometry were used to determine component F110W and F170M magnitudes and colors; these are also listed in Table 5. For SDSS 0423-0414, SDSS 1021-0304 and 2MASS 1553+1532, the secondary colors are consistent with T dwarf spectral types of T2, T5 and T7, respectively. Component colors for SDSS 0926+5847 (after correction for systematic effects) indicate spectral types of T40.5, consistent with the composite spectral type of T4.5. Component colors for 2MASS 0518-2828 have much larger uncertainties, and we can only ascertain that they are consistent with spectral types T3 and earlier. In all cases, we can rule out that the secondaries are hotter background stars, since both component and composite F090M magnitudes would be significantly brighter than observed. Furthermore, the likelihood of a background source lying near any of the target sources is very small. In our entire sample, only five additional point sources were detected at F110W in the 11 NIC1 field of view, with magnitudes of 19.5-22.5. Assuming that the background surface density scales as (i.e., scaling as ), then the probability of a background source with F110W 18.0 mag (bracketing the estimated magnitudes of the detected secondaries) lying within 1 of any target source is , and can be ruled out at the 4 confidence level. We therefore conclude that all five secondaries are physically bound T dwarf companions.
Utilizing our derived F110W bolometric correction/color relation (Eqn. 4), we can determine the relative bolometric luminosities of the binary components as
| (5) | |||||
These values are given in Table 5. We also list absolute values for the components of SDSS 0423-0414 and SDSS 1021-0304, which have parallax distance measurements. In all cases, we verify that the secondaries are less luminous than the primaries, as expected. Relative effective temperatures, , were determined from the relative bolometric luminosities assuming identical component radii, so that TB/TA = . Again, secondary Teffs are less than primary Teffs for all five systems, although in no case are differences more than 20%. These ratios are consistent with estimated component Teffs based on their spectral types (from F110W-F170M color and spectral decomposition; see 5.3) and the Teff/spectral type relation of Golimowski et al. (2004), taking into account the 124 K scatter in the latter relation. For SDSS 0423-0414 and SDSS 1021-0304, we derived component Teffs from their individual luminosities and assumed radii of 0.0950.010 R☉, appropriate for 0.5-5 Gyr brown dwarfs in the Teff range of late-type L and T dwarfs (Burrows et al., 1997). These effective temperatures are consistently 100-200 K lower than those based on the Golimowski et al. (2004) relation. Although the deviations are comparable to the uncertainties in both this relation and our Teff determinations, the Golimowski et al. (2004) results may be overestimated in this spectral type regime due to contamination by these previously unresolved (and hence overluminous) binaries.
Finally, we derived mass ratios for the five binary systems, assuming coevality, using the mass-luminosity power-law relation of Burrows et al. (2001), L M2.64, implying
| (6) |
System mass ratios are all 0.7 or greater, similar to most currently known brown dwarf pairs. Individual component masses were estimated from the evolutionary models of Burrows et al. (1997) using the component Teffs (for 2MASS 0518-2828, SDSS 0926+5847 and 2MASS 1553+1532) or s (for SDSS 0423-0414 and SDSS 1021-0304), and assuming an age range of 0.5-5 Gyr, typical for local disk dwarfs (Reid & Hawley, 2000). These component masses are roughly consistent with the estimated mass ratios. Orbital period estimates were derived assuming circular orbits and semimajor axes (Fischer & Marcy, 1992). These periods range over 10-50 yr, with the SDSS 0423-0414, 2MASS 0518-2828 and SDSS 0926+5847 systems (P 20 yr) appearing to be the best targets for dynamical mass measurements.
4.3. Search Limits for Very Faint Companions
In order to search for even fainter companions to unresolved T dwarfs in our sample, we repeated the PSF fitting analysis described above on the F110W calibrated images using a single PSF model for the primary. The F110W images were chosen because this filter samples the peak of the near infrared spectral flux of brown dwarfs down to Teff 500 K (Burrows, Sudarsky & Lunine, 2003), and therefore provides the most sensitive probe for low mass companions. We examined residual images (subtraction of the PSF model from the data) by eye for faint point sources that persist in the same location relative to the original primary. Out of the entire sample, only one “candidate” companion was identified, a faint source (F110W 22.0) located 097 northeast of the T1 SDSS 0151+1244. This source has a high probability of being spurious, however; it does not appear in either the F090M or F170M images, and due to the pointing offset of the HST observations of SDSS 0151+1244 (see 2.2) was only detected in one F110W exposure. While it is therefore likely to be a residual cosmic ray or ghost, it warrants follow-up confirmation imaging since its brightness relative to SDSS 0151+1244 is consistent with a Teff 450 K brown dwarf companion.
Sensitivity limits for putative faint companions were quantified by examining the F110W radial profiles for each of the unresolved sources before and after PSF subtraction. Examples of the brightest (2MASS 1503+2525) and faintest (SDSS 0207+0000) sources are shown in Figure 9. PSF subtraction results in residuals that are 4-4.5 mag fainter than the peak source flux in the core and first Airy ring (), irrespective of the brightness of the primary. At larger separations, there is little or no improvement in sensitivity beyond the inherent decrease in the primary flux, and residuals are largely background limited at . Faint source sensitivity limits (assuming 3 detections) for each of the unresolved sources, including mass ratio limits assuming F110W and using Eqn. 6 are given in Table 6 These detection limits can be characterized as follows:
-
•
No detections for ,
-
•
F110W 3-3.5 mag ( 0.3-0.4) for ,
-
•
F110W varying from 3-3.5 mag to the background limit (4-6.5 mag; 0.1-0.3) for , and
-
•
F110W background limited for .
Assuming all of our sources have masses below the hydrogen burning minimum mass (0.075 M☉; Chabrier et al. 2000; Burrows et al. 2001), these observations rule out companions down to just above the deuterium burning limit (0.012 M☉; Burrows et al. 2001) for most of our targets.
Finally, we comment on the 5 faint sources (F110W = 19.5–22.5) detected at wider separations () in the NIC1 images. These can be ruled out as low temperature companions based on their magnitudes and F110W-F170M colors, typically 1.2-1.4 mag, inconsistent with co-spatial mid- and late-type T dwarf companions but typical for background M stars.666The most interesting source is located 763 northeast of SDSS 1254-0122 at 12h54m5414 01d224284. With F110W-F170M = 2.310.14, this source is likely to be a highly reddened background star or faint unresolved galaxy. We conclude that no bona-fide companions are present around any of our targets with and 0.1-0.3.
5. Analysis of Individual Sources
5.1. SDSS 0423-0414
The identification of SDSS 0423-0414 as a binary system was previously reported in Burgasser et al. (2005b). The parameters reported here supersede those of the previous paper, although all measurements are consistent within the reported uncertainties. This source, similar in composition to the recently resolved binary 2MASS J22521073-1730134 (Reid et al., 2006b), is an unusual system, as its combined light optical spectrum (Cruz et al., 2003, Kirkpatrick et al. in prep.) exhibits both 6563 Å H emission, an indicator of magnetic activity; and 6708 Å Li I absorption, present in brown dwarfs with masses below the Li-burning minimum mass (0.065 M☉; Rebolo, Martín, & Magazzu (1992)). Both signatures are rare in very late-type L dwarfs and T dwarfs, as the strength and frequency of H emission plummets across the L dwarf regime (Gizis et al., 2000; Kirkpatrick et al., 2000; Mohanty & Basri, 2003; West et al., 2004), while Li I absorption becomes increasingly difficult to detect against a progressively fainter continuum suppressed by pressure-broadened Na I and K I lines (Burrows & Volobuyev, 2003). The only other sources known to exhibit the same combination of features are the L2 Kelu 1 (Ruiz, Leggett, & Allard, 1997), which has also been resolved as a binary system (Liu & Leggett, 2005; Gelino, Kulkarni & Stephens, 2006); the L0.5 2MASS J20575409-0252302 (Cruz et al., 2003), which has not (Reid et al., 2006a); and the L0 2MASS J11544223-3400390 (Kirkpatrick et al., in prep.), which has not yet been imaged at high angular resolution.
This raises the question: from which component or components do these spectral features arise? Decomposition of the combined light near infrared spectrum using the resolved NICMOS photometry indicates that this system is composed of an L6.5 primary and a T2 secondary (Burgasser et al., 2005b, see 5.3). H emission from T dwarfs is rare; only three other T dwarfs have been detected in emission (Burgasser et al., 2003a), one of which, 2MASS J12373919+6526148 (Burgasser et al., 1999), is unusually active and is speculated to be a very tight ( 0.1 R☉) interacting binary system (Burgasser et al., 2000a, 2002a). The H line flux as measured from combined light optical spectral data (Kirkpatrick et al. in prep.), flux calibrated to SDSS photometry (20.220.04; Geballe et al. 2002), is ergs cm-2 s-1. Using the component bolometric luminosities listed in Table 5, we derive = -5.5 if the emission arises from the L6.5 primary, and -5.2 if it arises from the T2 secondary. Compared to similar-typed objects exhibiting H emission – e.g., DENIS-P J0205.4-1159 (L7; -6.2; Mohanty & Basri 2003) and SDSS 1254-0122 (T2; = -5.8; Burgasser et al. 2003a) – the emission flux from either component is not necessarily extreme, but is nevertheless rare in this spectral type regime (cf. Figure 3 in Burgasser et al. 2002a).
Turning to the 6708 Å Li I line, Liu & Leggett (2005) have pointed out that the detection of this feature in a substellar binary can be used as a powerful constraint of systemic age in conjunction with theoretical evolutionary models, particularly if the absorption can be attributed to one or both components. SDSS 0423-0414 exhibits a prominent Li I line, and as luminous flux in this spectral region is dominated by the earlier-type primary (the optical classification of this source is L7.5; Cruz et al. 2003) it is likely that this component is responsible for the absorption. This deduction is supported by the fact that atomic Li gas is likely to be depleted in the photosphere of the secondary (for which we derive Teff = 126070 K) as Li is incorporated into LiCl and LiOH at Teffs 1500 K and pressures 1-10 bar (Lodders, 1999).
Assuming then that the observed absorption arises from the L6.5 primary, which must then have M 0.065 M☉, an upper age limit of 1.7 Gyr can be deduced using the theoretical evolutionary models of Burrows et al. (1997); this is illustated in Figure 10. This age is on the young side for a field dwarf, and may explain the presence of H emission in one or both components; observations of fully-convective lower main sequence stars in the field and clusters shows that magnetic activity is commonly enhanced in young stars (Hawley et al., 1999; Reid, 2003). It is also consistent with the kinematics of this system, as its tangential velocity, = 24.00.7 km s-1, is on the low end of the T Dwarf distribution of Vrba et al. (2004). An estimated minimum age for this system of 0.5 Gyr can be argued from the absence of low surface gravity features in its combined-light optical spectrum (e.g., VO absorption and weakened alkali lines; see Kirkpatrick 2005). Thus, the components of SDSS 0423-0414 are among the few brown dwarfs with well-constrained ages, distances and bolometric luminosities.
5.2. 2MASS 0518-2828
The detection of a companion to 2MASS 0518-2828 appears to confirm the binary hypothesis of Cruz et al. (2004) for this source, put forth to explain its unusual near infrared spectrum. 2MASS 0518-2828 exhibits clear CH4 absorption at 1.6 but no CH4 band at 2.2 . This is in contrast with trends in the standard L/T spectral sequence, where the 2.2 band is seen to develop in the latest-type L dwarfs first, followed by 1.6 absorption at the start of the T sequence (Geballe et al., 2002). Cruz et al. (2004) found that the combination of L6 and T4 spectra, with the latter scaled to be 20% brighter at 1.27 adequately matches the observed spectral energy distribution for 2MASS 0518-2828. The small separation of this source, and the corresponding poor determination of its relative photometry, makes it impossible to verify the conjectured spectral types of the components based on these HST observations (although our photometry are consistent with these types). However, the fact that 2MASS 0518-2828 is resolved into two components makes this scenario likely.
5.3. SDSS 1021-0304
Like SDSS 0423-0414 and 2MASS 0518-2828, SDSS 1021-0304 appears to be a binary straddling the L/T transition, with component F110W-F170M colors indicating spectral types of T2 and T5. However, this source is particularly interesting as the two components have nearly equal magnitudes at F110W, while the secondary is a full magnitude fainter at F170M. Because H2O and CH4 absorption bands encompassed by the F110W filter bandpass (cf. Fig. 1) become stronger with later spectral types, the equivalent magnitudes of the two components suggests that the secondary has a brighter peak flux density, like 2MASS 0518-2828.
To explore this possibility, we performed a spectral decomposition of the combined light near infrared spectra of this source and SDSS 0423-0414 using a method similar to that described in Burgasser et al. (2005b) and Reid et al. (2006b). In brief, our technique involves the combination of various pairings of standard spectra (sources with well-defined classifications) after scaling them to the relative fluxes of the binary system under investigation. The hybrid spectra were then compared to the combined light spectrum of each (unresolved) binary to determine the best match. We performed our analysis on low resolution ( 150) near infrared data obtained with the SpeX spectrograph (Rayner et al., 2003) mounted on the 3.0m NASA Infrared Telescope Facility. Details on the acquisition, reduction and characteristics of these data are described in detail in Burgasser et al. (2004a, 2006a). The comparison basis set was composed of equivalent spectra of late L and T dwarf standards from Kirkpatrick et al. (1999); Cruz et al. (2003); and Burgasser et al. (2006a); specifically: 2MASS J08354256-0819237 (L5), 2MASS J04390101-2353083 (L6.5), DENIS-P J0205.4-1159777DENIS-P J0205.4-1159 is either a resolved, near-equal mass binary (Koerner et al., 1999; Leggett et al., 2002) or a triple (Bouy et al., 2005), and is arguably a poor choice for this analysis. However, we did not have an alternate L7 comparison source, and DENIS-P J0205.4-1159 is currently the L7 optical spectral standard on the Kirkpatrick et al. (1999) scheme. (Delfosse et al., 1997, L7), 2MASS J16322911+1904407 (L8), SDSS 0151+1244 (T1), SDSS 1254-0122 (T2), 2MASS 1209-1004 (T3), 2MASS 2254+3123 (T4), 2MASS 1503+2525 (T5) and SDSS 1624+0029 (T6). Pairings of the standard spectra were scaled to the observed F110W flux ratios, then added together and normalized. The quality of agreement between the resulting hybrid spectra and those of the binaries was quantitatively determined by comparison of the H2O, CH4 and spectral indices defined in Burgasser et al. (2006a), as well as the relative F170M flux ratios between the spectral components.
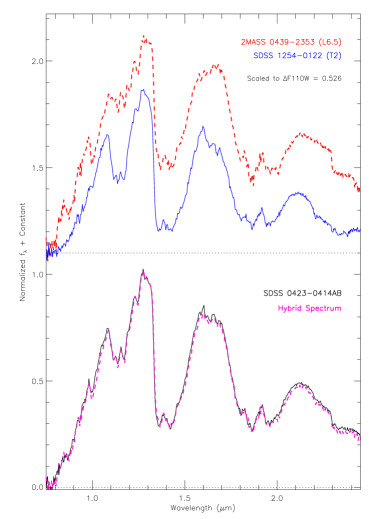
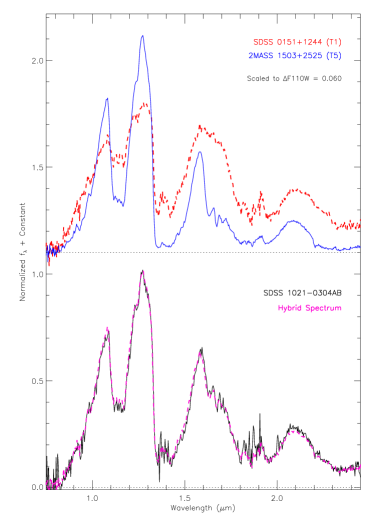
The best matches for SDSS 0423-0414 and SDSS 1021-0304 are shown in Figure 11. For the former, we confirm previous results by Burgasser et al. (2005b), finding a best fit to a combination of the L6.5 2MASS 0439-2353 and the T2 SDSS 1254-0122. A hybrid spectrum of the T1 SDSS 0151+1244 and the T5 2MASS 1503+2525 provides the best match for SDSS 1021-0304. Note that the derived spectral types of the secondary components agree with photometric classifications based on F110W-F170M colors. In both cases the hybrid spectra show remarkable agreement with the binary spectra, both in terms of band strengths and the overall spectral energy distribution, across the full 0.8-2.5 band. The relative F170M magnitudes as measured from the scaled component spectra are in rough agreement with HST photometry, differing by at most 0.1 mag, an offset attributable to the low resolution and calibration uncertainties in the spectral data.
Examining the relative fluxes of the best-fit component spectra for SDSS 1021-0304 in more detail, a remarkable fact is revealed. The emergent flux density of the T5 secondary of this system is 31% brighter than that of the T1 primary at the peak of the spectral energy distribution (1.27 ), and 24% brighter at the 1.05 flux peak. This is despite the fact that the secondary is 11% cooler and 37% less luminous overall. That these spectral peaks differ significantly between the two components while F110W magnitudes are roughly equivalent can be explained by the redistribution of flux within the F110W bandpass. The increased brightening at 1.05 and 1.27 in the secondary component is offset by deeper H2O and CH4 bands at 1.1 and 1.35 . At the bottom of these molecular features, and at shorter and longer wavelengths, the primary component is brighter. The components of SDSS 0423-0414 do not exhibit this same brightness inversion, although the peak flux densities are rather similar (differing by less than 25% at 1.27 ) given the large differences in spectral type. The brightening of the secondary component of SDSS 1021-0304 is similar to that hypothesized for 2MASS 0518-2828, and more recently observed for the T1.5+T5.5 binary SDSS J153417.05+161546.1 (Liu et al., 2006, hereafter SDSS 1534+1615). Indeed, the photometric and spectroscopic properties of SDSS 1021-0304 and SDSS 1534+1615 are quite similar. We discuss the observed -band brightening, and its implications on the transition between L dwarfs and T dwarfs, in 7.
5.4. 2MASS 1217-0311
Burgasser et al. (2003c) reported a possible faint companion to this object in HST Wide Field Planetary Camera 2 imaging, but our NICMOS observations fail to reveal this source. Assuming that the relative flux at F110W between 2MASS 1217-0311 and the putative companion is as bright or brighter than that at F1042M ( = 1.02 ), it would have been easily detected at the separation (021) and flux ratio (2.4 mag) previously observed. It is likely that the prior detection was an unfortunate combination of cosmic ray hits localized near the target source.
5.5. 2MASS 1553+1532
2MASS 1553+1532 is the latest-type binary in our sample, and the best resolved. The F110W-F170M colors are consistent with very similar spectral types (T6.5 and T7), effective temperatures (within 7%) and masses (). With a separation of 03490005 the 2MASS 1553+1532 pair is resolvable by ground-based imaging under the best seeing conditions, and was previously reported as a possible binary by Burgasser, Kirkpatrick & Brown (2002) based on imaging observations with the Keck 10m Near Infrared Camera (Matthews & Soifer, 1994, hereafter NIRC) on 2000 July 22 (UT). We have revisited these data to determine whether the two components share common proper motion, and to search for orbital motion.
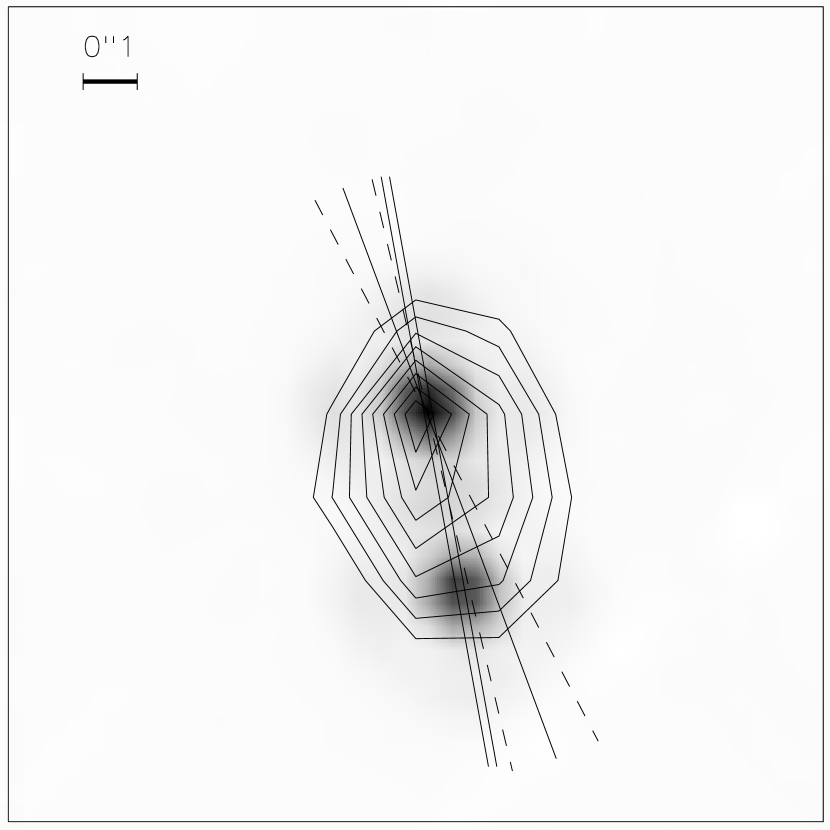
Conditions during the Keck observations in 2000 were particularly excellent, with clear skies and seeing of 03 (full width at half maximum) at during the observations. 2MASS 1553+1532 was observed in this filter, with 10 dithered exposures of 20s each obtained sequentially. Immediately following these observations, 10 dithered 20s exposures of the unresolved T dwarf 2MASS 2254+3123 were also obtained. Despite the large angular offset between the sources, we used these observations for PSF calibration as no other sufficiently bright and unresolved sources were detected in the 2MASS 1553+1532 fields. Raw images for both datasets were pairwise subtracted to eliminate first order background emission, and checked for linearity. No further reduction of the data (e.g., flat fielding) was done as relative photometry was not a priority. Figure 12 shows the PSFs of 2MASS 2254+3123 and 2MASS 1553+1532. The latter is clearly extended along a NNE/SSW axis, but the underlying components overlap substantially. We extracted astrometric information using a PSF fitting algorithm similar to that described above, but in this case comparing subsections of each pair-wise subtracted frame of 2MASS 1553+1532 to all 10 observations of 2MASS 2254+3123, for a total of 100 separate fits. Imposing the condition that average residuals be less than 3% of the peak source flux, the 42 best fits gave a mean separation = 030003 (assuming a camera pixel scale of 0153) and position angle = 1997.
The difference in epoch between the HST and Keck images is 3.126 yr. A preliminary proper motion of this object as measured by the USNO infrared parallax program (Vrba et al., 2004) of 04 yr-1 (F. Vrba 2006, private communication) implies a total motion of the system of 13 over this period. Yet the change in the relative separation between the two components is only 005003. These observations therefore confirm common proper motion for this pair, which are almost certainly gravitationally bound.
As for orbital motion, both the separation and position angle of this system have changed only slightly between the Keck and HST observations. While only marginally significant ( = 97), Figure 13 illustrates that these slight changes are perceptible. However, the small position angle change is significantly less than that expected (26) for its estimated 45 yr orbital period. This suggests that the true orbital period may be much longer, possibly due to smaller component masses in a younger system, or a particularly eccentric orbit; or that the orbital inclination is quite different from a face-on projection (consistent with the slight change in the separation of the two components). Further high-resolution imaging may constrain these possibilities in a reasonably short time period (5 yr), but mapping of the full orbit is clearly a long-term prospect.
6. An Updated Assessment of Brown Dwarf Multiplicity
6.1. The Binary Fraction
The fraction of resolved binaries in our sample is = 5/22 = 23%, where the uncertainties take into account the size of the sample (Burgasser et al., 2003c). This is similar to resolved binary fractions measured for other large high resolution imaging samples of VLM field dwarfs (Reid et al., 2001, 2006a; Bouy et al., 2003; Close et al., 2003; Gizis et al., 2003; Siegler et al., 2005). However, as all of these samples are largely magnitude-limited, this fraction is biased in favor of unresolved, near-equal mass ratio binaries. We can estimate the underlying (i.e., volume-limited) binary fraction, , as (cf. Eqns. 4 and 5 in Burgasser et al. (2003c))
| (7) |
where
| (8) |
is the fractional increase in volume sampled for binaries with flux ratio (Eqn. 6) and mass ratio ratio distribution . In Burgasser et al. (2003c), both flat and delta-function forms of were considered; here, we explicitly calculate = 2.50 using a power-law mass ratio distribution as described below. This yields = 11%, a value consistent with previous determinations of bias-corrected VLM binary fractions (Burgasser et al., 2003c; Close et al., 2003; Siegler et al., 2005) and volume-limited estimates (Bouy et al., 2003; Reid et al., 2006a, 15% and 12%, respectively).
It is important to stress that this fraction applies only to those binary systems that are resolvable by direct imaging. For our study, this limits the phase space sampled to 1 AU and 0.35, or 5 AU and 0.2. The equivalent phase space of F-G and M dwarf binaries in the studies of Duquennoy & Mayor (1991) and Reid & Gizis (1997) yield binary fractions of 39% (combining both mass ratio and period distributions) and 24% (for ), respectively. Hence, in equivalent phase spaces the binary fraction of brown dwarfs in our sample is less than that of more massive stars.
But does this mean that the overall binary fraction of brown dwarfs is less? Maxted & Jeffries (2005) have proposed that a substantial fraction (50-67%) of VLM binaries may be hiding in more closely separated systems ( 2.6 AU) and can only be resolved as spectroscopic binaries. This projected separation corresponds to an angular separation of 013 at the average distance of sources in our sample (20 pc), only 3 NIC1 pixels. Indeed, over 25% of resolved brown dwarf binaries identified to date have angular separations below this limit, with the majority close to the resolution limits of . This supports the possibility that a significant number of more closely-separated and/or more distant systems remain unresolved. Bayesian statistical analysis of high resolution imaging studies by Reid et al. (2006a), which takes into account the possible presence of unresolved systems, indicates an overall VLM binary fraction of 24%, twice that of the resolved fraction.888Note that this analysis assumes a symmetric Guassian separation distribution; the fraction may be higher (lower) if there is an excess (deficiency) of short period systems (cf. Maxted & Jeffries 2005). This still places the binary fraction of VLM dwarfs at 1/3 that of solar-type stars, and 2/3 that of M dwarfs, consistent with a decreasing binary fraction toward later spectral types and lower masses.
6.2. The Separation Distribution
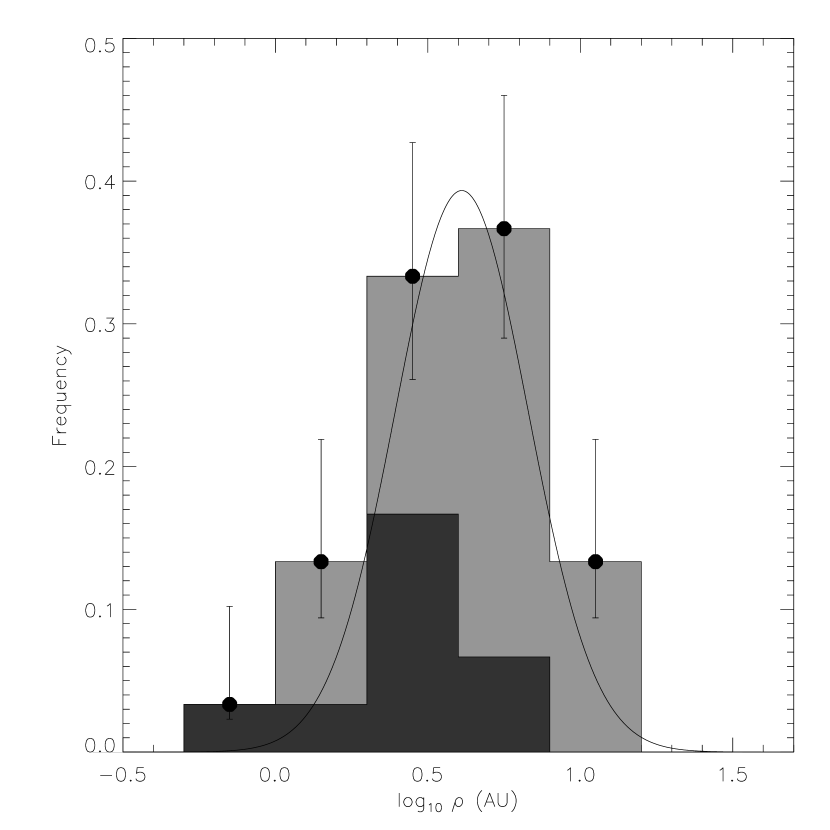
The projected separation distribution of 30 brown dwarf binaries resolved by high resolution imaging surveys to date are shown in Figure 14. These include systems listed in Burgasser et al. (2006b)999This sample incorporates binaries identified in Martín et al. (1999); Leinert et al. (2001); Reid et al. (2001, 2006a); Potter et al. (2002); Bouy et al. (2003); Burgasser et al. (2003c); Gizis et al. (2003); McCaughrean et al. (2004); Burgasser et al. (2005a); Liu & Leggett (2005); Liu et al. (2006); and this study. that have estimated primary masses below 0.075 M☉. In accordance with previous studies, we find that this distribution peaks at very close separations, 4 AU with a broad peak spanning 2–8 AU. This is significantly lower than the 30 AU peak of the F-G and M binary separation distributions (Duquennoy & Mayor, 1991; Fischer & Marcy, 1992). Indeed, no brown dwarf field binaries have been identified with separations AU. However, two wider brown dwarf binaries systems have been recently identified in young cluster/associations: 2MASS J11011926-7732383 (Luhman, 2004), a 240 AU binary in the 2 Myr Chameleon I association; and 2MASS J1207334-393254 (Chauvin et al., 2004, 2005), a 40 AU, very low mass (Mtot 0.03 M☉) brown dwarf binary in the 8 Myr TW Hydrae association (Gizis, 2002). Both systems are very young, and it remains unclear as to whether their configurations are stable long-term (Mugrauer & Neuhäuser, 2005). The widest VLM field binary so far identified, DENIS J055146.0-443412.2 (Billeres et al., 2005, 220 AU), is likely composed of two VLM stars. Hence, the wide separation brown dwarf binary desert originally suggested by Martín et al. (2000) — not to be confused with the brown dwarf companion desert around solar-type stars (Marcy & Butler, 2000) — remains a distinct characteristic of brown dwarf binaries in the field.
At closer separations, imaging surveys are limited by angular resolution. Hence, the true peak of the brown dwarf separation distribution may be lower than that inferred from Figure 14. Nevertheless, it is interesting to note that the separations of binaries identified in this survey — and indeed all T dwarf binaries identified to date — are 5 AU, such that most T dwarf binaries have separations below the peak of the brown dwarf distribution. The apparent compactness of T dwarf binaries as compared to warmer M- and L-type brown dwarf systems is consistent with a maximum binary separation that scales with total system mass (Reid et al., 2001; Burgasser et al., 2003c; Close et al., 2003), since cooler brown dwarfs have lower masses than warmer ones at a given age. However, the smaller separations of T dwarf binaries may also be due to selection effects. T dwarfs are intrinsically fainter and typically found at closer distances to the Sun than M and L dwarfs in magnitude-limited surveys. Hence, T dwarf binaries can generally be observed at higher linear resolution. A statistically robust volume-limited sample of M-, L- and T-type brown dwarfs would provide an adequate check for mass dependency in the separation distribution of substellar objects.
6.3. The Mass Ratio Distribution
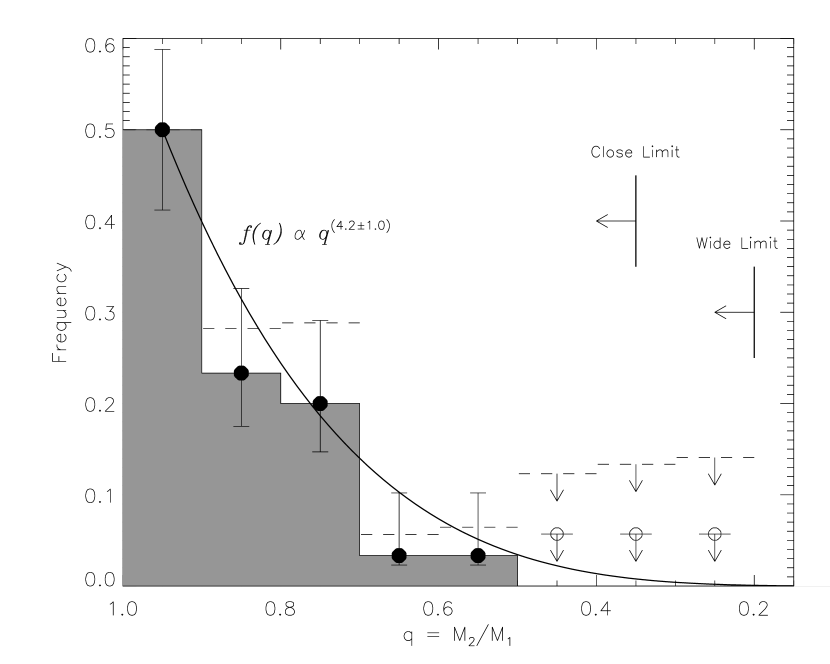
The mass ratio distribution of brown dwarf binaries is shown in Figure 15. This distribution is clearly peaked at , with 509% of all known systems having near-equal mass components. Again, because the majority of these systems were originally selected from magnitude-limited surveys, there is an inherent bias in the discovery of equal-mass systems that scales approximately as . A bias-corrected distribution, also shown in Figure 15, nevertheless shows that near-equal mass ratio systems are predominant. This result is robust even when sensitivity limits are taken into account. The bias-corrected frequency of binaries drops by a factor of 7.8 from to , even though most imaging programs are complete for companions down to or below this limit. A fit to the bias-corrected distribution for to a power-law, , yields = 4.21.0, slightly flatter but nevertheless consistent with a Bayesian analysis of VLM binaries (Reid et al., 2006a).
In summary, our sample supports prior results on brown dwarf multiplicity, namely:
-
•
The resolved binary fraction of brown dwarfs is lower than that of stars, % for 3 AU and 0.3;
-
•
The separation distribution of resolved brown dwarfs peaks around 4 AU; the true peak may lie at lower separations due to resolution limits of imaging programs;
-
•
The maximum separations of field brown dwarf binaries appears to decrease for later spectral types, consistent with a mass-dependent trend; and
-
•
Most brown dwarf pairs have near-equal mass ratios, with a bias-corrected distribution of indicated by current data.
These characteristics of brown dwarf field binaries provide key empirical constraints for the theoretical modeling of brown dwarf formation and dynamical evolution, issues that are discussed in detail in Burgasser et al. (2006b); Luhman et al. (2006); and Whitworth et al. (2006).
7. Binaries and the L/T Transition
7.1. -band Brightening - Intrinsic to the L/T Transition
Three of the binaries in our sample – 2MASS 0518-2828, SDSS 0423-0414 and SDSS 1021-0304 – are composed of brown dwarfs that span the transition between L dwarfs and T dwarfs. This spectral type range has been the focus of both observational and theoretical studies as it encompasses dramatic changes in the atmospheric properties (e.g., photospheric condensate dust depletion) and spectral energy distributions (e.g., the onset of CH4 absorption) of cool brown dwarfs. This transition also exhibits several unusual traits, including an apparent brightening of absolute -band magnitudes from late-type L to mid-type T dwarfs (Dahn et al., 2002; Tinney, Burgasser & Kirkpatrick, 2003; Vrba et al., 2004). This so-called “-band bump” has been attributed to dynamic atmospheric processes, such as condensate cloud fragmentation (Burgasser et al., 2002b), a sudden increase in sedimentation efficiency (Knapp et al., 2004) or a global collapse of the condensate cloud layer (Tsuji, 2005). However, Tsuji & Nakajima (2003) have also argued that age and/or surface gravity effects amongst disparate field sources may be responsible.
The component fluxes of the SDSS 1021-0304 binary demonstrate that the last hypothesis can be largely ruled out for this system. Under the reasonable assumption of coevality, these brown dwarfs have similar ages, masses and (presumably) radii, implying nearly identical surface gravities. Yet the T5 secondary of this system is clearly brighter than the T1 primary at 1.05 and 1.27 . Similar trends suggested in the 2MASS 0518-2828 system and observed in SDSS 1534+1615 demonstrate that SDSS 1021-0304 is not a unique case. Hence, a brightening of surface fluxes at these wavelengths appears to be an intrinsic feature of the L/T transition.
7.2. A “Bump” or a “Plateau”?
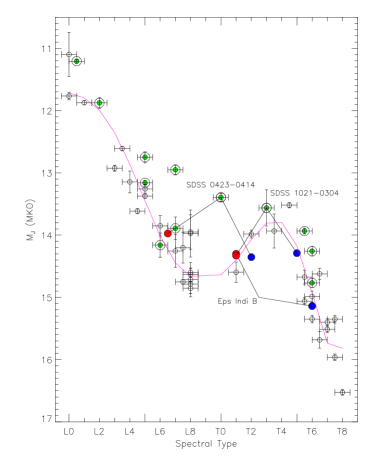
In their analysis of the SDSS 1534+1615 binary, Liu et al. (2006) proposed that the -band bump may be artificially enhanced by a significant contribution of binaries amongst mid-type T dwarfs (such “crypto-binarity” has also been suggested by Burrows, Sudarsky & Hubeny 2006). To examine this hypothesis in detail, Figure 16 compares absolute MKO - and -band magnitudes to spectral type for 50 L and T dwarf systems with measured parallaxes (Dahn et al., 2002; Tinney, Burgasser & Kirkpatrick, 2003; Vrba et al., 2004, precision 20%), companions to nearby Hipparcos stars (Becklin & Zuckerman, 1988; Nakajima et al., 1995; Burgasser et al., 2000b; Kirkpatrick et al., 2001; McCaughrean et al., 2004) and resolved absolute magnitudes for SDSS 0423-0414, SDSS 1021-0304 and the T1 + T6 binary Epsilon Indi B (McCaughrean et al., 2004). For consistency, spectral types for L dwarfs are based on optical data and the Kirkpatrick et al. (1999) classification scheme, while those for T dwarfs are based on near infrared data and the Burgasser et al. (2006a) scheme. MKO magnitudes for the SDSS 0423-0414 and SDSS 1021-0304 components are based on their F110W-F170M colors and Eqn. 2; -band component photometry is derived from synthetic colors measured from the component spectral templates.
The -band bump is seen clearly in these data in the T1-T5 spectral type range, and is well traced by the absolute magnitude/spectral type relation of Tinney, Burgasser & Kirkpatrick (2003). Yet one of these data points is the unresolved SDSS 1021-0304 systems, and its individual component fluxes are only slightly brighter ( and 14.29) than the latest-type L dwarfs (). The same holds true for the T2 secondary of SDSS 0423-0414 () and the T1 primary of Epsilon Indi B (). Indeed, all of the resolved components spanning types T1 to T5, have nearly identical absolute -band magnitudes.
Does this mean that the -band bump is largely an artifact of multiplicity? Possibly, but only if the T2 SDSS 1254-0122, the T3.5 SDSS 1750+1759 (both unresolved in this study) and the T4.5 2MASS J05591914-1404488 (Burgasser et al., 2000c, unresolved in Burgasser et al. (2003c)) are all closely-separated multiples. This is not out of the realm of possibility, for as discussed in 6.2 the separations of brown dwarf binaries likely extend below imaging resolution limits. One or all of these systems may also have been imaged at an unfortunate orbital angle, as was the case initially for Kelu 1 (Martín, Brandner & Basri, 1999; Liu & Leggett, 2005; Gelino, Kulkarni & Stephens, 2006). Furthermore, the fact that SDSS 1254-0122 and 2MASS 0559-1404 are 0.5 and 0.8 mag brighter at -band than the T2 and T5 secondaries of SDSS 0423-0414 and SDSS 1021-0304, respectively, suggests that the former are unresolved multiples. If the primaries of these hypothetical systems are constrained to have , then the secondaries of SDSS 1254-0122 and SDSS 1750+1759 would have 15.3-15.5 and be T6 dwarfs. 2MASS 0559-1404 would be required to have near equal-magnitudes components or be a higher multiple system. High resolution radial velocity monitoring observations are needed to test these possibilities.
It is important to point out that the absolute -band magnitudes of the early-type T dwarf resolved binary components examined here are still 0.4 mag brighter than the latest-type L dwarfs (but 0.5 mag fainter at -band). Hence, some broad-band brightening may still be present across the L/T transition. Furthermore, even if the -band “bump” is a more modest “plateau”, there remains a significant (30%) brightening at 1.05 and 1.27 due to flux redistribution within the -band spectral region, a feature not yet reproduced self-consistently by current atmosphere models.
7.3. The Origin of -band Brightening
That the observed brightening is concentrated in the 1.05 and 1.27 flux peaks is an important clue to its origin. The photospheric atomic and molecular gas opacities of low-temperature brown dwarfs show distinct minima at these wavelengths, shaped by strong H2O and CH4 bands and bracketed by pressure-broadened K I at shorter wavelengths and collision-induced H2 absorption at longer wavelengths. Condensate opacities, for grain sizes (40-80 ) computed in a self-consistent manner (Ackerman & Marley, 2001), are roughly constant across the near infrared band. In the L dwarf regime, condensates are a dominant source of opacity at the -, - and -band spectral peaks. However, theoretical atmosphere models incorporating condensate clouds indicate that the photospheric opacity from these species are dominant only in the 1.05 and 1.27 flux peaks for Teff 1300-1500 K; i.e., at the L/T transition (cf. Figure 16 in Burrows, Sudarsky & Hubeny 2006). If these condensates are suddenly removed, the total opacity at these wavelengths decreases, allowing brighter emission from deeper and hotter layers.
This is the underlying thesis for dynamical atmospheric explanations for the -band brightening (Burgasser et al., 2002b; Knapp et al., 2004). However, one must also consider whether higher gas opacities at longer wavelengths, with the increased photospheric abundances of H2O and CH4 molecules below Teff 1300-1800 K (Burrows & Sharp, 1999; Lodders & Fegley, 2002) and stronger H2 absorption, might lead to a redistribution of flux into the 1.05 and 1.27 flux peaks. Current cloud models that assume constant sedimentation efficiency (Marley et al., 2002) or particle size distributions (Burrows, Sudarsky & Hubeny, 2006) do not show this to be the case. Hence, a dynamic mechanism for clearing out photospheric condensate dust may still be necessary to explain the evolution of brown dwarf atmospheres across the L/T transition.
7.4. The Frequency of L/T Binaries
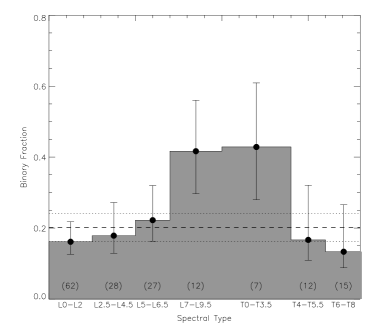
Is there evidence from the distribution of binary frequency as a function of spectral type that binaries play a special role through the L/T transition? To address this, we have compiled results from high resolution imaging of L and T dwarfs by Koerner et al. (1999); Martín et al. (1999); Reid et al. (2001, 2006a); Close et al. (2003); Bouy et al. (2003); Burgasser et al. (2003c); Gizis et al. (2003); and this study.101010We also include the recently identified Kelu 1 binary (Liu & Leggett, 2005; Gelino, Kulkarni & Stephens, 2006), a target of prior searches. We did not include individual binary discoveries made serendipitously (Goto et al., 2002; Potter et al., 2002; McCaughrean et al., 2004; Burgasser et al., 2005a) or those identified as part of as yet unpublished surveys (Liu et al., 2006; Stumpf, Bradner & Henning, 2006) in order to make a fair assessment of the observed binary fraction. Care was taken to identify duplicate sources in each of the imaging studies, and classifications were verified through published optical (L dwarfs, on the Kirkpatrick et al. (1999) scheme) and near infrared data (T dwarfs, on the Burgasser et al. (2006a) scheme). Only those resolved pairs that had a high probability of companionship, based on either common proper motion confirmation, resolved spectroscopy and/or photometric colors, or very low probability of coincidence with an unrelated background source, were considered as bona-fide binaries. The complete sample includes 129 L dwarfs and 34 T dwarfs, of which 33 are binary.
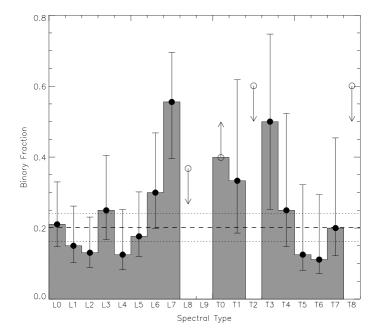
Figure 17 plots the observed binary fraction of these sources as a function of spectral type, binned by individual subclasses and into subclass groups of L0-L2 (62 sources), L2.5-L4.5 (28 sources), L5-L6.5 (27 sources), L7-L9.5 (12 sources), T0-T3.5 (7 sources), T4-T5.5 (12 sources) and T6-T8 (15 sources). Note that these fractions have not been corrected for selection bias (resulting in an overestimate from equal-brightness systems) or sensitivity/resolution limits (resulting in an underestimate by missing closely separated or low mass ratio systems). This sample may also be subject to more subtle biases, such as the smaller typical distances of later-type, intrinsically fainter brown dwarfs, resulting in greater linear resolution for these objects (although this effect may be offset by the apparent decrease in separations for lower-mass brown dwarfs). It nevertheless serves to illustrate possible trends.
There is clearly significant structure in the binary fraction distribution for individual subclasses, although this could be attributed to small number statistics. By binning the subclasses (reducing statistical uncertainties), a remarkable result emerges. For most of the sample, binary fractions are consistent with the overall fraction, = 204%. Yet the L7-L9.5 and T0-T3.5 subclass groups – the L/T transition objects — have fractions that are twice as high, 42% combining all 19 systems in this spectral type range. This deviation is significant at the 98% confidence level compared to the sample mean.
Why would the observed binary fraction of L/T transition objects be so high? We posit the following scenario. Analysis of the SDSS 0423-0414 and SDSS 1021-0304 components, and prior results from Kirkpatrick et al. (2000); Burgasser et al. (2002c); Dahn et al. (2002); Vrba et al. (2004) and Golimowski et al. (2004), all indicate that the L/T transition spans a relatively narrow range of effective temperatures, Teff 200–300 K. However, the cooling rate of brown dwarfs is largely insensitive to changes in the photospheric opacity (Chabrier et al., 2000), such as the removal of condensates or emergence of CH4 absorption. Brown dwarfs must therefore progress through the L/T transition relatively rapidly, implying fewer such sources per spectral subtype for a given field sample. On the other hand, the analysis of 5.3, and similar results by Cruz et al. (2004); Burgasser et al. (2005b); Reid et al. (2006b); and Liu et al. (2006), all demonstrate that early-type T dwarf spectral features can be reproduced from the combined light of a late-type L and mid-type T dwarf binary. It is therefore possible that such hybrid binaries, if unrecognized, could significantly contaminate a spectral sample of early-type T dwarfs.
To illustrate this point, consider the following example. Assuming that L5-L8 dwarfs have Teff 1700-1300 K and L8-T5 dwarfs have Teff 1300-1100 K (Table 5 and Golimowski et al. (2004)), the mass function simulations of Burgasser (2004) predict a relative space density of between these two groups, largely independent of the shape of the underlying mass function. However, because mid- to late-type L dwarfs are roughly twice as bright as L/T transition objects, the relative number observed in a magnitude-limited sample (the best approximation for current imaging samples) is . Now consider that all brown dwarfs in a magnitude-limited sample have a resolvable binary fraction of 25%, and that 20% of all late-type L dwarf binaries have T dwarf secondaries (this is roughly consistent with the mass ratio distribution of Figure 15). These binaries would exhibit a combined light spectrum similar to a late-type L/early-type T dwarf, and would be identified as such in an unresolved spectroscopic sample. Hence, the observed binary fraction among late-type L dwarfs in this scenario would be 20%, while the fraction of L/T transition binaries would be
| (9) |
i.e., nearly twice the underlying binary fraction. This numerical example serves to illustrate that the binary hypothesis provides both a qualitative and quantitative explanation for the peak in the binary fraction of L/T transition objects. More complete modeling of this effect will be presented in a forthcoming publication.
We therefore conclude that multiplicity does play an important role in the L/T transition, contaminating samples of “true” transition objects and leading to a greater -band brightening than that inferred for resolved systems. These binaries also provide a detailed and intriguing picture of this still poorly-understood transition, and a list of all currently known L/T binaries is given in Table Hubble Space Telescope NICMOS Observations of T Dwarfs: Brown Dwarf Multiplicity and New Probes of the L/T Transition. Further study of these source will provide improved understanding of the physical mechanisms governing this transition, including the depletion of photospheric condensates, the emergence of CH4 gas and the possible role of atmospheric dynamics in brown dwarf spectral evolution.
8. Summary
We have identified 5 binaries in of a sample of 22 T dwarfs imaged with HST NICMOS. Of these, three are well-resolved, permitting determination of their component spectral types, relative bolometric luminosities and Teffs, and systemic mass ratios. The identification of 2MASS 0518-2828 as a closely-separated binary confirms previous suspicions of multiplicity based on this object’s unusual near infrared spectrum. The bias-corrected resolved binary fraction of this sample (%), the near-unity mass ratios of the components of these systems () and their small projected separations ( AU) are all consistent with previously identified trends amongst VLM dwarfs, indicating that they are salient properties of brown dwarf field binaries.
Three of the binaries in our sample, SDSS 0423-0414, 2MASS 0518-2828 and SDSS 1021-0304, are composed of sources spanning the L to T transition, and spectral decomposition analysis of SDSS 1021-0304 reveals that its T5 secondary is 25–30% brighter at 1.05 and 1.27 than its T1 primary, despite being 35% less luminous overall. The properties of these sources, as well as the recently discovered binary SDSS 1534+1615, indicate that the -band brightening previously observed amongst late-type L and mid-type field T dwarfs is an intrinsic feature of the L/T transition and not the result of age, surface gravity or metallicity effects. In support of the results of Burrows, Sudarsky & Hubeny (2006) and Liu et al. (2006), we find that the -band bump may be more of a -band “plateau”, with T1-T5 dwarfs having , enhanced by the presence of unresolved binaries in this spectral type range. Indeed, we find that the frequency of L/T transition binaries is twice as high as those of all other L and T dwarfs, a statistically significant deviation that can be explained if spectroscopic samples of L/T transition objects are significantly contaminated by binaries composed of earlier-type and later-type components. Taken together, the properties of L/T binary systems provide the most conclusive evidence to date that the L/T transition occurs relatively rapidly, driven by the removal of photospheric condensates that is likely to be facilitated by dynamic atmospheric processes. Further parallax and multiplicity measurements will better constrain the flux evolution and relative numbers of L/T transition objects, important constraints for understanding the physical mechanism of photospheric condensate depletion and the atmospheric evolution of brown dwarfs as they cool below Teff 1500 K.
References
- Abt & Levy (1976) Abt, H. A., & Levy, S. G. 1976, ApJS, 30, 273
- Ackerman & Marley (2001) Ackerman, A. S., & Marley, M. S. 2001, ApJ, 556, 872
- Allard et al. (2001) Allard, F., Hauschildt, P. H., Alexander, D. R., Tamanai, A., & Schweitzer, A. 2001, ApJ, 556, 357
- Allard et al. (2003) Allard, N. F., Allard, F., Hauschildt, P. H., Kielkopf, J. F., & Machin, L. 2003, A&A, 411, L473
- An et al. (2002) An, J. H., et al. 2002, ApJ, 572, 521
- Basri & Martín (1999) Basri, G., & Martín, E. L. 1999, AJ, 118, 2460
- Bate, Bonnell, & Bromm (2002) Bate, M. R., Bonnell, I. A., & Bromm, V. 2002, MNRAS, 332, L65
- Becklin & Zuckerman (1988) Becklin, E. E., & Zuckerman, B. 1988, Nature, 336, 656
- Billeres et al. (2005) Billeres, M., Delfosse, X., Beuzit, J.-L., Forveille, T., Marchal, L., & Martín, E. L. 2005, A&A, 440, L55
- Brandner et al. (2004) Brandner, W., Marín, E. L., Bouy, H., Köhler, R., Delfosse X., Basri, G., & Andersen, M. 2004, A&A, 428, 205
- Bouy et al. (2006) Bouy, H., Moraux, E., Bouvier, J., Brandner, W., Martín, E. L., Allard, F., Baraffe, I., & Fernández, M. 2006, AJ, 637, 1056
- Bouy et al. (2003) Bouy, H., Brandner, W., Martín, E. L., Delfosse, X., Allard, F., & Basri, G. 2003, AJ, 126, 1526
- Bouy et al. (2005) Bouy, H., Martín, E. L.,, Brandner, W., & Bouvier, J. 2005, AJ, 129, 511
- Bouy et al. (2004) Bouy, H., et al. A&A, 2004, 423, 341
- Burgasser et al. (2006a) Burgasser, A. J., Geballe, T. R., Leggett, S. K., Kirkpatrick, J. D., & Golimowski, D. A. 2006a, ApJ, 637, 1067
- Burgasser, Kirkpatrick & Brown (2002) Burgasser, A. J., Kirkpatrick, J. D., & Brown, M. E. 2002, BAAS, 200, 1105
- Burgasser et al. (2003a) Burgasser, A. J., Kirkpatrick, J. D., Liebert, J., & Burrows, A. 2003a, ApJ, 594, 510
- Burgasser (2004) Burgasser, A. J. 2004, ApJS, 155, 191
- Burgasser et al. (2005a) Burgasser, A. J., Kirkpatrick, J. D., & Lowrance, P. J. 2005a, AJ, 129, 2849
- Burgasser et al. (2003b) Burgasser, A. J., Kirkpatrick, J. D., McElwain, M. W., Cutri, R. M., Burgasser, A. J., & Skrutskie, M. F. 2003b, AJ, 125, 850
- Burgasser et al. (2003c) Burgasser, A. J., Kirkpatrick, J. D., Reid, I. N., Brown, M. E., Miskey, C. L., & Gizis, J. E. 2003c, ApJ, 586, 512
- Burgasser et al. (2000a) Burgasser, A. J., Kirkpatrick, J. D., Reid, I. N., Liebert, J., Gizis, J. E., & Brown, M. E. 2000a, AJ, 120, 473
- Burgasser et al. (2002a) Burgasser, A. J., Liebert, J., Kirkpatrick, J. D., & Gizis, J. E. 2002a, AJ, 123, 2744
- Burgasser et al. (2002b) Burgasser, A. J., Marley, M. S., Ackerman, A. S., Saumon, D., Lodders, K., Dahn, C. C., Harris, H. C., & Kirkpatrick, J. D. 2002b, ApJ, 571, L151
- Burgasser, McElwain & Kirkpatrick (2003) Burgasser, A. J., McElwain, M. W., & Kirkpatrick, J. D. 2003, AJ, 126, 2487
- Burgasser et al. (2004a) Burgasser, A. J., McElwain, M. W., Kirkpatrick, J. D., Cruz, K. L., Tinney, C. G., & Reid, I. N. 2004a, AJ, 127, 2856
- Burgasser et al. (2006b) Burgasser, A. J., Reid, I. N., Siegler, N., Close, L. M., Allen, P., Lowrance, P. J., & Gizis, J. E. 2006b, in Planets and Protostars V, eds. B. Reipurth, D. Jewitt and K. Keil (Univ. Arizona Press: Tucson), in press
- Burgasser et al. (2005b) Burgasser, A. J., Reid, I. N., Leggett, S. J., Kirkpatrick, J. D., Liebert, J., & Burrows, A. 2005b, ApJ, 634, L177
- Burgasser et al. (1999) Burgasser, A. J., et al. 1999, ApJ, 522, L65
- Burgasser et al. (2000b) —. 2000b, ApJ, 531, L57
- Burgasser et al. (2000c) —. 2000c, AJ, 120, 1100
- Burgasser et al. (2002c) —. 2002c, AJ, 564, 421
- Burrows et al. (1997) Burrows, A., et al. 1997, ApJ, 491, 856
- Burrows et al. (2001) Burrows, A., Hubbard, W. B., Lunine, J. I., & Liebert, J. 2001, Rev. of Modern Physics, 73, 719
- Burrows, Marley, & Sharp (2000) Burrows, A., Marley, M. S., & Sharp, C. M. 2000, ApJ, 531, 438
- Burrows & Sharp (1999) Burrows, A., & Sharp, C. M. 1999, ApJ, 512, 843
- Burrows, Sudarsky & Hubeny (2006) Burrows, A., Sudarsky, D., & Hubeny, I. 2006, ApJ, 640, 1063
- Burrows, Sudarsky & Lunine (2003) Burrows, A., Sudarsky, D., & Lunine, J. I 2003, ApJ, 596, 587
- Burrows & Volobuyev (2003) Burrows, A., & Volobuyev, M. 2003, ApJ, 583, 985
- Bushouse et al. (1997) Bushouse, H., MacKenty, J., Skinner, C., & Stobie, E. 1997, in ASP Conf. Ser. 125, Astronomical Data Analysis Software and Systems VI, ed. G. Hunt & H. E. Payne (ASP: San Francisco), 439
- Chabrier et al. (2000) Chabrier, G., Baraffe, I., Allard, F., & Hauschildt, P. 2000, ApJ, 542, 464
- Chauvin et al. (2004) Chauvin, G., Lagrange, A.-M., Dumas, C., Zuckerman, B., Mouillet, D., Song, I., Beuzit, J.-L., & Lowrance, P. 2004, A&A, 425, L29
- Chauvin et al. (2005) —. 2005, A&A, 438, L25
- Close et al. (2003) Close, L. M., Siegler, N., Freed, M., & Biller, B. 2003, ApJ, 587, 407
- Cruz et al. (2004) Cruz, K. L., Burgasser, A. J., Reid, I. N., & Liebert, J. ApJ, 2004, 604, L61
- Cruz et al. (2003) Cruz, K. L., Reid, I. N., Liebert, J., Kirkpatrick, J. D., & Lowrance, P. J. 2003, AJ, 126, 2421
- Dahn et al. (2002) Dahn, C. C., et al. 2002, AJ, 124, 1170
- Delfosse et al. (2004) Delfosse X., Beuzit J.-L., Marchal L., Bonfils X. C., Perrier, C., et al. 2004, in Spectroscopically and Spatially Resolving the Components of the Close Binary Stars, ed. R. W. Hilditch et al., (ASP: San Francisco), p. 166
- Delfosse et al. (1997) Delfosse, X., et al. 1997, A&A, 327, L25
- Duquennoy & Mayor (1991) Duquennoy, A., & Mayor, M. 1991, A&A, 248, 485
- ESA (1997) ESA, 1997, The Hipparcos and Tycho Catalogues, ESA SP-1200
- Fischer & Marcy (1992) Fischer, D. A., & Marcy, G. W. 1991, ApJ, 396, 178
- Geballe et al. (2002) Geballe, T. R., et al. 2002, ApJ, 564, 466
- Gelino, Kulkarni & Stephens (2006) Gelino, C. R., Kulkarni, S. R., & Stephens, D. C. 2006, PASP, 118, 611
- Gizis (2002) Gizis, J. E. 2002, ApJ, 575, 484
- Gizis et al. (2000) Gizis, J. E., Monet, D. G., Reid, I. N., Kirkpatrick, J. D., Liebert, J., & Williams, R. 2000, AJ, 120, 1085
- Gizis et al. (2003) Gizis, J. E., Reid, I. N., Knapp, G. R., Liebert, J., Kirkpatrick, J. D., Koerner, D. W., & Burgasser, A. J. 2003, AJ, 125, 3302
- Golimowski et al. (2004) Golimowski, D. A., et al. 2004, AJ, 127, 3516
- Goto et al. (2002) Goto, M., et al. 2002, 567, L59
- Hawley et al. (1999) Hawley, S. L., Reid, I. N., Gizis, J. E., & Byrne, P. B. 1999, in ASP Conf. Ser. 158, Solar and Stellar Activity: Similarities and Differences, ed. C. J. Butler & J. G. Doyle (San Francisco: ASP), p. 63 in Solar and Stellar Activity: Similarities and Differences, ASP Conf. Ser. 158, ed. C. J. Butler & J. G. Doyle (ASP), p.63
- Hayashi & Nakano (1963) Hayashi, C., & Nakano, T. 1963, Prog. Theo. Physics, 30, 4
- Joergens (2006) Joergens, V. 2006, A&A, 446, 1165
- Kirkpatrick et al. (2001) Kirkpatrick, J. D., Dahn, C. C., Monet, D. G., Reid, I. N., Gizis, J. E., Liebert, J., & Burgasser, A. J. 2001, AJ, 121, 3235
- Kirkpatrick et al. (2000) Kirkpatrick, J. D., Reid, I. N., Liebert, J., Gizis, J. E., Burgasser, A. J., Monet, D. G., Dahn, C. C., Nelson, B., & Williams, R. J. 2000, AJ, 120, 447
- Kirkpatrick et al. (1999) Kirkpatrick, J. D., et al. 1999, ApJ, 519, 802
- Knapp et al. (2004) Knapp, G., et al. 2004, ApJ, 127, 3553
- Koerner et al. (1999) Koerner, D. W., Kirkpatrick, J. D., McElwain, M. W., & Bonaventura, N. R. 1999, ApJ, 526, L25
- Krist (1995) Krist, H. 1995, in ASP Conf. Ser. 77, Astronomical Data Analysis Software and Systems, IV, ed. R. A. Shaw, H. E. Payne, & J. J. E. Hayes (San Francisco: ASP), 349
- Kumar (1962) Kumar, S. S. 1962, AJ, 67, 579
- Lane et al. (2001) Lane, B. F., Zapatero Osorio, M. R., Britton, M. C., Martín, E. L., & Kulkarni, S. R. 2001, ApJ, 560, 390
- Leggett et al. (2000) Leggett, S. K., et al. 2000, ApJ, 536, L35
- Leggett et al. (2002) Leggett, S. K., et al. 2002, ApJ, 564, 452
- Leinert et al. (2001) Leinert, Ch., Jahrei, H., Woitas, J., Zucker, S., Mazeh, T., Eckart, A., & Köhler, R. 2001, A&A, 367, 183
- Liu & Leggett (2005) Liu, M. C., & Leggett, S. K. 2005, ApJ, 634, 616
- Liu et al. (2006) Liu, M. C., Leggett, S. K., Golimowski, D. A., Chiu, K., Fan, X., Geballe, T. R., Schneider, D. P., & Brinkmann, J. 2006, ApJ, in press
- Lodders (1999) Lodders, K. 1999, ApJ, 519, 793
- Lodders & Fegley (2002) Lodders, K., & Fegley, B. 2002, Icarus, 155, 393
- Luhman (2004) Luhman, K. L. 2004, ApJ, 614, 398
- Luhman et al. (2006) Luhman, K. L., Joergens, V., Lada, C., Muzerolle, J., Pascucci, I., & White, R. 2006, in Planets and Protostars V, eds. B. Reipurth, D. Jewitt and K. Keil (Univ. Arizona Press: Tucson), in press
- Marcy & Butler (2000) Marcy, G. W., & Butler, R. P. 2000, PASP, 112, 137
- Marley et al. (1996) Marley, M. S., Saumon, D., Guillot, T., Freedman, R. S., Hubbard, W. B., Burrows, A., & Lunine, J. I. 1996, Science, 272, 1919
- Marley et al. (2002) Marley, M. S., Seager, S., Saumon, D., Lodders, K., Ackerman, A. S., Freedman, R., & Fan, X. 2002, ApJ, 568, 335
- Martín, Brandner & Basri (1999) Martín, E. L., Brandner, W., & Basri, G. 1999, Science, 283, 1718
- Martín et al. (2000) Martín, E. L., Brandner, W., Bouvier, J., Luhman, K. L., Stauffer, J., Basri, G., Zapatero Osorio, M. R., & Barrado y Navascués, D. 2000, ApJ, 543, 299
- Martín et al. (1999) Martín, E. L., Delfosse, X., Basri, G., Goldman, B., Forveille, T., & Zapatero Osorio, M. R. 1999, AJ, 118, 2466
- Matthews & Soifer (1994) Matthews, K., & Soifer, B. T. 1994, in Infrared Astronomy with Arrays: The Next Generation, ed. I. McLean (Dordrecht: Kluwer), 239
- Maxted & Jeffries (2005) Maxted, P. F. L., & Jeffries, R. D. 2005, MNRAS, 326, L45
- Mazeh et al. (1992) Mazeh, T., Goldberg, D., Duquennoy, A., & Mayor, M. 1992, ApJ, 401, 265
- McCaughrean et al. (2004) McCaughrean, M., Close, L. M., Scholz, R.-D., Lenzen, R., Biller, B., Brandner, W., Hartung, M., & Lodieu, N. 2004, A&A, 413, 1029
- Mohanty & Basri (2003) Mohanty, S., & Basri, G. 2003, ApJ, 583, 451
- Mugrauer & Neuhäuser (2005) Mugrauer, M., & Neuhäuser, R. 2005, AN, 326, 701
- Nakajima et al. (1995) Nakajima, T., Oppenheimer, B. R., Kulkarni, S. R., Golimowski, D. A., Matthews, K., & Durrance, S. T. 1995, Nature, 378, 463
- Oppenheimer et al. (1995) Oppenheimer, B. R., Kulkarni, S. R., Matthews, K., & Nakajima, T. 1995, Science, 270, 1478
- Potter et al. (2002) Potter, D., Martín, E. L., Cushing, M. C., Baudoz, P., Brandner, W., Guyon, O., & Neuhäuser, R. 2002, ApJ, 567, L133
- Rayner et al. (2003) Rayner, J. T., Toomey, D. W., Onaka, P. M., Denault, A. J., Stahlberger, W. E., Vacca, W. D., Cushing, M. C., & Wang, S. 2003, PASP, 155, 362
- Rebolo, Martín, & Magazzu (1992) Rebolo, R., Martín, E. L., & Magazzu, A. 1992, ApJ, 389, L83
- Rebolo et al. (1998) Rebolo, R., Zapatero Osorio, M. R., Madruga, S., Béjar, V. J. S., Arribas, S., & Licandro, J. 1998, Science, 282, 1309
- Reid (2003) Reid, N. 2003, MNRAS, 342, 837
- Reid et al. (2001) Reid, I. N., Gizis, J. E., Kirkpatrick, J. D., & Koerner, D. 2001, AJ, 121, 489
- Reid & Gizis (1997) Reid, I. N., & Gizis, J. E. 1997, AJ, 113, 2246
- Reid & Hawley (2000) Reid, I. N., & Hawley, S. L. 2000, New Light on Dark Stars (Chichester: Praxis)
- Reid et al. (2006a) Reid, I. N., Lewitus, E., Allen, P., Cruz, K. L., & Burgasser, A. J. 2006a, ApJ, in press
- Reid et al. (2006b) Reid, I. N., Lewitus, E., Cruz, K. L., & Burgasser, A. J. 2006b, ApJ, 639, 1114
- Ruiz, Leggett, & Allard (1997) Ruiz, M. T., Leggett, S. K., & Allard, F. 1997, ApJ, 491, L107
- Schultz et al. (2005) Schultz, A., et al. 2005, NICMOS Instrument Handbook, Version 8.0, (Baltimore: STScI).
- Skrutskie et al. (2006) Skrutskie, M. F., et al. 2006, AJ, 131, 1163
- Siegler et al. (2005) Siegler, N., Close, L. M., Cruz, K. L., Martín, E. L., & Reid, I. N. 2005, ApJ, 621, 1023
- Simons & Tokunaga (2002) Simons, D. A., & Tokunaga, A. T. 2002, PASP, 114, 169
- Skumanich (1972) Skumanich, A. 1972, ApJ, 171, 565
- Stassun et al. (2006) Stassun, K., Mathieu, R. D., Vaz, L. P. R., Valenti, J. A., & Gomez, Y. 2006, Nature, in press
- Strauss et al. (1999) Strauss, M. A., et al. 1999, ApJ, 522, L61
- Stephens & Leggett (2004) Stephens, D. C., & Leggett, S. K. 2004, PASP, 166, 9
- Stumpf, Bradner & Henning (2006) Stumpf, M. B., Brandner, W., & Henning, Th. 2006, in Planets and Protostars V, eds. B. Reipurth, D. Jewitt and K. Keil (Univ. Arizona Press: Tucson), in press
- Tinney, Burgasser & Kirkpatrick (2003) Tinney, C. G., Burgasser, A. J., & Kirkpatrick, J. D. 2003, AJ, 126, 975
- Tinney et al. (2005) Tinney, C. G., Burgasser, A. J., Kirkpatrick, J. D., & McElwain, M. W. 2005, AJ, 130, 2326
- Tokunaga, Simons & Vacca (2002) Tokunaga, A. T., Simons, D. A., & Vacca W. D. 2002, PASP, 114, 180
- Tsuji (2005) Tsuji, T. 2005, ApJ, 621, 1033
- Tsuji & Nakajima (2003) Tsuji, T., & Nakajima, T. 2003, ApJ, 585, L151
- Tsuji et al. (1996) Tsuji, T., Ohnaka, K., Aoki, W., & Nakajima, T. 1996, A&A, 308, L29
- Vrba et al. (2004) Vrba, F. J., et al. 2004, AJ, 127, 2948
- West et al. (2004) West, A. A., et al. 2004, AJ, 128, 426
- Whitworth et al. (2006) Whitworth, A., Bate, M. R., Nordlund, A., Reipurth, B., & Zinnecker, H. 2006, in Planets and Protostars V, eds. B. Reipurth, D. Jewitt and K. Keil (Univ. Arizona Press: Tucson), in press
- York et al. (2000) York, D. G., et al. 2000, AJ, 120, 1579
- Zapatero Osorio et al. (2004) Zapatero Osorio, M. R., Lane, B. F., Pavlenko, Ya., Mart n, E. L., Britton, M., & Kulkarni, S. R 2004, ApJ, 615, 958
| J2000 CoordinatesbbCoordinates from the 2MASS All Sky Point Source Catalog (Skrutskie et al., 2006). | 2MASS Photometry | ||||||||||
|---|---|---|---|---|---|---|---|---|---|---|---|
| Name | SpTaaNear infrared spectral types from Burgasser et al. (2006a). | Epoch | RefccDiscovery reference in boldface type, followed by references for additional photometric and astrometric data. | ||||||||
| (mag) | (mag) | (mag) | (arcs) | (arcs yr-1) | () | ||||||
| (1) | (2) | (3) | (4) | (5) | (6) | (7) | (8) | (9) | (10) | (11) | (12) |
| SDSS J015141.69+124429.6 | T1 | 01h51m4155 | +1244300 | 1997.70 | 16.570.13 | 15.600.11 | 15.180.19 | 0.0470.003 | 0.7430.004 | 93 | 1,9 |
| SDSS J020742.48+000056.2 | T4.5 | 02h07m4284 | +0000564 | 2000.63 | 16.630.05ddMKO from Leggett et al. (2002) or Knapp et al. (2004). | 16.660.05ddMKO from Leggett et al. (2002) or Knapp et al. (2004). | 16.620.05ddMKO from Leggett et al. (2002) or Knapp et al. (2004). | 0.0350.010 | 0.1560.011 | 96 | 1,9 |
| 2MASS J024313712453298 | T6 | 02h43m1371 | 2453298 | 1998.87 | 15.380.05 | 15.140.11 | 15.220.17 | 0.0940.004 | 0.3550.004 | 234 | 2,9 |
| 2MASS J034807726022270 | T7 | 03h48m0772 | 6022270 | 1999.89 | 15.320.05 | 15.560.14 | 15.600.23 | 0.770.04 | 201 | 3 | |
| 2MASS J041519540935066 | T8 | 04h15m1954 | 0935066 | 1998.87 | 15.700.06 | 15.540.11 | 15.430.20 | 0.1740.003 | 2.2550.003 | 76 | 2,9 |
| SDSS J042348.57041403.5 | T0 | 04h23m4858 | 0414035 | 1998.73 | 14.470.03 | 13.460.04 | 12.930.03 | 0.06590.0017 | 0.3330.003 | 284 | 1,9 |
| 2MASS J051609450445499 | T5.5 | 05h16m0945 | 0445499 | 1998.72 | 15.980.08 | 15.720.17 | 15.490.20 | 0.340.03 | 232 | 3 | |
| 2MASS J051859952828372 | T1p | 05h18m5995 | 2828372 | 1999.01 | 15.980.10 | 14.830.07 | 14.160.07 | 4 | |||
| 2MASS J07271824+1710012 | T7 | 07h27m1824 | +1710012 | 1997.83 | 15.600.06 | 15.760.17 | 15.560.19 | 0.1100.002 | 1.2970.005 | 126 | 2,9 |
| 2MASS J07554795+2212169 | T5 | 07h55m4795 | +2212169 | 1998.83 | 15.730.06 | 15.670.15 | 15.750.21 | 2 | |||
| SDSS J083717.22000018.3 | T1 | 08h37m1721 | 0000180 | 2000.11 | 16.900.05ddMKO from Leggett et al. (2002) or Knapp et al. (2004). | 16.210.05ddMKO from Leggett et al. (2002) or Knapp et al. (2004). | 15.980.05ddMKO from Leggett et al. (2002) or Knapp et al. (2004). | 0.0340.014 | 0.1730.017 | 185 | 5,9 |
| SDSS J092615.38+584720.9 | T4.5 | 09h26m1537 | +5847212 | 2000.22 | 15.900.07 | 15.310.10 | 15.450.19 | 0.3 | 1,7 | ||
| SDSS J102109.69030420.1 | T3 | 10h21m0969 | 0304197 | 1998.94 | 16.250.09 | 15.350.10 | 15.130.17 | 0.0340.005 | 0.1830.003 | 249 | 5,10 |
| SDSS J111010.01+011613.1 | T5.5 | 11h10m1001 | +0116130 | 2000.12 | 16.340.12 | 15.920.14 | 15.1 | 0.340.10 | 110 | 1,11 | |
| 2MASS J12171100311131 | T7.5 | 12h17m1110 | 0311131 | 1999.08 | 15.860.06 | 15.750.12 | 15.9 | 0.0910.002 | 1.05710.0017 | 274 | 6,10 |
| SDSS J125453.90012247.4 | T2 | 12h54m5393 | 0122474 | 1999.07 | 14.890.04 | 14.090.03 | 13.840.05 | 0.07320.0019 | 0.4910.003 | 285 | 5,10 |
| 2MASS J15031961+2525196 | T5 | 15h03m1961 | +2525196 | 1999.39 | 13.940.02 | 13.860.03 | 13.960.06 | 7 | |||
| 2MASS J15530228+1532369 | T7 | 15h53m0228 | +1532369 | 1998.15 | 15.830.07 | 15.940.16 | 15.510.18 | 2 | |||
| SDSS J162414.37+002915.6 | T6 | 16h24m1436 | +0029158 | 1999.31 | 15.490.05 | 15.520.10 | 15.5 | 0.0920.002 | 0.38320.0019 | 270 | 8,12 |
| SDSS J175032.96+175903.9 | T3.5 | 17h50m3293 | +1759042 | 1999.23 | 16.340.10 | 15.950.13 | 15.480.19 | 0.0360.005 | 0.2040.008 | 61 | 1,9 |
| 2MASS J222828894310262 | T6 | 22h28m2889 | 4310262 | 1998.90 | 15.660.07 | 15.360.12 | 15.300.21 | 0.310.03 | 175 | 3 | |
| 2MASS J22541892+3123498 | T4 | 22h54m1892 | +3123498 | 1998.48 | 15.260.05 | 15.020.08 | 14.900.15 | 2 | |||
| 2MASS J23391025+1352284 | T5 | 23h39m1025 | +1352284 | 2000.91 | 16.240.11 | 15.820.15 | 16.150.31 | 0.830.11 | 159 | 2,7 | |
References. — (1) Geballe et al. (2002); (2) Burgasser et al. (2002c); (3) Burgasser, McElwain & Kirkpatrick (2003); (4) Cruz et al. (2004); (5) Leggett et al. (2000); (6) Burgasser et al. (1999); (7) Burgasser et al. (2003b); (8) Strauss et al. (1999); (9) Vrba et al. (2004); (10) Tinney, Burgasser & Kirkpatrick (2003); (11) Tinney et al. (2005); (12) Dahn et al. (2002).
| F090M | F110W | F170M | ||||||
|---|---|---|---|---|---|---|---|---|
| Object | UT Date | aaLimiting magnitude estimated for a 5 flux peak detection. | aaLimiting magnitude estimated for a 5 flux peak detection. | aaLimiting magnitude estimated for a 5 flux peak detection. | Roll AnglebbTelescope roll angle, East from North. | |||
| (s) | (mag) | (s) | (mag) | (s) | (mag) | () | ||
| (1) | (2) | (3) | (4) | (5) | (6) | (7) | (8) | (9) |
| SDSS 0151+1244 | 2003 Nov 3 | 56 | 19.0 | 864 | 22.9 | 1519 | 21.2 | 212.0 |
| SDSS 0207+0000 | 2004 Feb 3 | 48 | 18.4 | 864 | 22.1 | 1519 | 20.9 | 208.1 |
| 2MASS 02432453 | 2004 Feb 15 | 56 | 19.5 | 864 | 23.6 | 1519 | 21.5 | 220.6 |
| 2MASS 03486022 | 2004 May 26 | 88 | 20.2 | 1599 | 22.7 | 3071 | 21.4 | 321.1 |
| 2MASS 04150935 | 2004 Feb 20 | 56 | 19.0 | 864 | 22.6 | 1519 | 21.1 | 214.1 |
| SDSS 04230414 | 2004 Jul 22 | 72 | 19.3 | 816 | 22.6 | 1519 | 21.3 | 15.3 |
| 2MASS 05160445 | 2004 Jul 25 | 48 | 18.6 | 864 | 22.7 | 1519 | 21.1 | 15.9 |
| 2MASS 05182828ccAlso observed at F145M (320 s) and F160W (160 s). | 2004 Sep 7 | 960 | 21.0 | 64 | 19.9 | 416 | 19.9 | 38.9 |
| 2MASS 0727+1710 | 2004 Mar 27 | 56 | 19.5 | 864 | 23.6 | 1519 | 21.1 | 232.7 |
| 2MASS 0755+2212 | 2004 Mar 29 | 56 | 18.6 | 864 | 22.4 | 1519 | 20.9 | 236.9 |
| SDSS 08370000 | 2004 Feb 18 | 48 | 18.6 | 864 | 23.3 | 1519 | 21.7 | 196.5 |
| SDSS 0926+5847 | 2004 Feb 5 | 48 | 19.1 | 960 | 22.7 | 1600 | 21.2 | 319.5 |
| SDSS 10210304 | 2004 May 22 | 48 | 18.9 | 864 | 22.9 | 1519 | 21.0 | 245.9 |
| SDSS 1110+0116 | 2004 May 22 | 48 | 18.9 | 864 | 23.3 | 1519 | 21.5 | 247.1 |
| 2MASS 12170311 | 2004 Apr 26 | 48 | 18.7 | 864 | 22.7 | 1519 | 21.3 | 255.7 |
| SDSS 12540122 | 2004 Feb 13 | 896 | 22.7 | 1519 | 21.1 | 64.9 | ||
| 2MASS 1503+2525 | 2003 Sep 9 | 80 | 18.9 | 791 | 21.9 | 1519 | 20.7 | 216.0 |
| 2MASS 1553+1532 | 2003 Sep 7 | 56 | 19.5 | 864 | 23.5 | 1519 | 21.7 | 226.9 |
| SDSS 1624+0029 | 2003 Sep 9 | 48 | 18.8 | 864 | 22.7 | 1519 | 20.9 | 230.8 |
| SDSS 1750+1759 | 2003 Sep 12 | 56 | 18.6 | 864 | 22.1 | 1519 | 20.9 | 231.8 |
| 2MASS 22284310 | 2004 May 26 | 72 | 19.2 | 912 | 23.0 | 1519 | 21.3 | 37.3 |
| 2MASS 2254+3123 | 2003 Sep 15 | 64 | 19.4 | 864 | 22.8 | 1519 | 21.2 | 299.7 |
| 2MASS 2339+1352 | 2003 Nov 1 | 56 | 18.8 | 864 | 22.6 | 1519 | 20.9 | 218.5 |
| Aperture | |||
|---|---|---|---|
| Radius | F090MaaMeasured from observations of 2MASS 0518-2828. | F110W | F170M |
| (pixels) | (mag) | (mag) | (mag) |
| 2.0 | -0.710.05 | -0.790.02 | -1.0960.009 |
| 2.5 | -0.600.04 | -0.6950.017 | -0.8690.012 |
| 3.0 | -0.470.04 | -0.6370.014 | -0.7570.008 |
| 3.5 | -0.350.04 | -0.5570.011 | -0.7140.008 |
| 4.0 | -0.260.04 | -0.4510.008 | -0.6940.007 |
| 4.5 | -0.220.04 | -0.3490.007 | -0.6580.007 |
| 5.0bbAdopted aperture radius for single sources. | -0.200.05 | -0.2750.005 | -0.5930.006 |
| 5.5 | -0.180.05 | -0.2320.005 | -0.5030.006 |
| 6.0 | -0.170.04 | -0.2110.004 | -0.4100.006 |
| 6.5 | -0.160.04 | -0.1990.003 | -0.3330.006 |
| 7.0 | -0.150.03 | -0.1900.003 | -0.2790.005 |
| 7.5 | -0.140.03 | -0.1810.002 | -0.2470.004 |
| 8.0 | -0.140.03 | -0.17360.0019 | -0.2320.004 |
| 8.5 | -0.140.04 | -0.16810.0015 | -0.2250.004 |
| 9.0 | -0.130.04 | -0.16380.0012 | -0.2190.003 |
| 9.5 | -0.120.04 | -0.15970.0010 | -0.2120.002 |
| 10.0 | -0.120.04 | -0.15490.0007 | -0.20390.0017 |
| 10.5 | -0.110.02 | -0.14980.0006 | -0.19690.0013 |
| 11.0 | -0.1150.012 | -0.14480.0006 | -0.19190.0009 |
Note. — Values include corrections from a reference aperture (11.5 pixels) to an infinitely sized aperture of -0.1136, -0.1393 and -0.1888 mag as given in Schultz et al. (2005).
| Object | SpT | F090M | F110W | F170M | F110W-F170M |
|---|---|---|---|---|---|
| (mag) | (mag) | (mag) | (mag) | ||
| (1) | (2) | (3) | (4) | (5) | (6) |
| SDSS 0151+1244 | T1 | 18.530.09 | 17.260.05 | 15.540.05 | 1.720.04 |
| SDSS 0207+0000 | T4.5 | 19.90.2 | 17.840.05 | 16.870.05 | 0.970.04 |
| 2MASS 02432453 | T6 | 19.50.2 | 16.230.05 | 15.740.06 | 0.490.04 |
| 2MASS 03486022 | T7 | 18.510.09 | 16.110.06 | 16.160.05 | -0.050.05 |
| 2MASS 04150935 | T8 | 19.040.10 | 16.470.05 | 16.670.06 | -0.200.04 |
| SDSS 04230414 | T0 | 16.680.10aaPhotometry measured using a 15-pixel aperture and no aperture correction to incorporate both components. | 15.280.05aaPhotometry measured using a 15-pixel aperture and no aperture correction to incorporate both components. | 13.620.05aaPhotometry measured using a 15-pixel aperture and no aperture correction to incorporate both components. | 1.660.04aaPhotometry measured using a 15-pixel aperture and no aperture correction to incorporate both components. |
| 2MASS 05160445 | T5.5 | 18.960.09 | 16.660.05 | 16.140.05 | 0.520.03 |
| 2MASS 05182828bbAdditional photometry for 2MASS 0518-2828: F145M = 15.860.05, F160W = 15.200.05. | T1p | 18.550.08 | 16.690.07 | 14.920.05 | 1.770.06 |
| 2MASS 0755+2212 | T5 | 18.890.09 | 16.580.05 | 16.080.05 | 0.500.03 |
| SDSS 08370000 | T1 | 18.6 | 17.910.05 | 16.210.05 | 1.700.04 |
| SDSS 0926+5847 | T4.5 | 18.660.09 | 16.570.05 | 15.640.05 | 0.930.03 |
| SDSS 10210304 | T3 | 19.340.15aaPhotometry measured using a 15-pixel aperture and no aperture correction to incorporate both components. | 17.090.05aaPhotometry measured using a 15-pixel aperture and no aperture correction to incorporate both components. | 15.830.05aaPhotometry measured using a 15-pixel aperture and no aperture correction to incorporate both components. | 1.260.04aaPhotometry measured using a 15-pixel aperture and no aperture correction to incorporate both components. |
| SDSS 1110+0116 | T5.5 | 19.150.12 | 17.270.05 | 16.490.05 | 0.780.04 |
| 2MASS 12170311 | T7.5 | 18.910.09 | 16.730.05 | 16.770.05 | -0.040.04 |
| SDSS 12540122 | T2 | 15.660.05 | 14.100.05 | 1.560.03 | |
| 2MASS 1503+2525 | T5 | 16.840.08 | 14.650.05 | 14.180.05 | 0.470.03 |
| 2MASS 1553+1532A | T7 | 19.160.16 | 17.160.05 | 17.010.05 | 0.150.04 |
| 2MASS 1553+1532B | T7: | 19.5 | 17.460.05 | 17.400.05 | 0.060.04 |
| SDSS 1624+0029 | T6 | 18.460.09 | 16.280.05 | 15.960.05 | 0.320.03 |
| SDSS 1750+1759 | T3.5 | 18.800.09 | 17.180.05 | 16.040.05 | 1.140.04 |
| 2MASS 22284310 | T6 | 18.770.09 | 16.360.05 | 16.050.05 | 0.310.03 |
| 2MASS 2254+3123 | T4 | 18.120.10 | 16.050.05 | 15.090.05 | 0.960.04 |
| 2MASS 2339+1352 | T5 | 18.860.09 | 16.910.05 | 16.270.05 | 0.640.03 |
Note. — Aperture photometry derived using an 5-pixel aperture and aperture corrections from Table 2, unless otherwise noted. Values are given on the Arizona Vega system ( = 0.02). Uncertainties include RMS scatter in count rates between individual exposures, aperture correction uncertainties, 5% flux calibration (3% in F110W-F170M color) and 1% sensitivity variation (zeropoint drift).
| Parameter | SDSS 0423-0414 | 2MASS 0518-2828 | SDSS 0926+5847 | SDSS 1021-0304 | 2MASS 1553+1532 | |
|---|---|---|---|---|---|---|
| UT Date | 2004 Jul 22 | 2004 Sep 7 | 2004 Feb 5 | 2004 May 22 | 2003 Sep 7 | 2000 Jul 22 |
| Instrument | HST NICMOS | HST NICMOS | HST NICMOS | HST NICMOS | HST NICMOS | Keck NIRC |
| () | 01640005 | 00510012 | 00700006 | 01720005 | 03490005 | 030002 |
| (AU) | 2.490.07 | 1.80.5 | 2.60.5 | 5.00.7 | 4.20.7 | 3.60.7 |
| () | 19208 | 1898 | 132919 | 244608 | 189904 | 1997 |
| F090M | 0.880.03 | 1.60.4 | 0.210.10 | |||
| F110W | 0.5260.015 | 0.80.5aaEstimated flux ratios including systematic effects; see 4.1. | 0.40.2aaEstimated flux ratios including systematic effects; see 4.1. | 0.060.04 | 0.310.04 | |
| F170M | 0.8200.013 | 0.90.6aaEstimated flux ratios including systematic effects; see 4.1. | 0.40.3aaEstimated flux ratios including systematic effects; see 4.1. | 1.0300.019 | 0.4610.016 | |
| F110W (A) | 15.800.05 | 17.110.18 | 17.140.10 | 17.810.05 | 17.150.05 | |
| (B) | 16.330.05 | 17.90.3 | 17.540.13 | 17.870.05 | 17.470.05 | |
| F170M (A) | 14.040.05 | 15.310.19 | 16.210.13 | 16.190.05 | 16.980.05 | |
| (B) | 14.860.05 | 16.20.4 | 16.610.18 | 17.220.05 | 17.440.05 | |
| F110W-F170M (A) | 1.760.07 | 1.80.3 | 0.930.16 | 1.630.07 | 0.170.07 | |
| (B) | 1.470.07 | 1.70.5 | 0.90.2 | 0.660.07 | 0.030.07 | |
| Est. SpT | L6.5+T2bbBased on spectral decomposition; see 5.3. | L6:+T4:bbBased on spectral decomposition; see 5.3. | T4:+T4: | T1+T5bbBased on spectral decomposition; see 5.3. | T6.5+T7 | |
| 0.720.13 | 0.90.6 | 0.40.2 | 0.490.13 | 0.310.12 | ||
| (A) | 15.770.16 | 16.50.7 | ||||
| (B) | 16.500.16 | 17.00.7 | ||||
| T2/T1 | 0.8470.013 | 0.810.11 | 0.910.05 | 0.8940.015 | 0.9310.014 | |
| Teffccfootnotemark: (K) (A) | 1490100 | 1600 | 1330 | 1260210 | 980 | |
| (B) | 125080 | 1330 | 1330 | 1130190 | 890 | |
| 0.780.02 | 0.740.15 | 0.870.07 | 0.840.02 | 0.900.02 | ||
| Est. MassddBased on Golimowski et al. (2004) Teff/spectral type relation, with the exception of SDSS 0423-0413 and SDSS 1021-0304, where Teffs are derived from measured s and assumed radii of 0.0950.10 R☉. (M☉) (A) | 0.039–0.062 | 0.042–0.077 | 0.029–0.073 | 0.025–0.076 | 0.019–0.065 | |
| (B) | 0.029–0.051 | 0.031–0.074 | 0.029–0.073 | 0.021–0.074 | 0.016–0.061 | |
| Est. PeriodeeAssuming semimajor axes = 1.26 (Fischer & Marcy, 1992). (yr) | 19 | 10 | 18 | 50 | 45 | |
| Object | DistanceaaDistance estimates for objects without parallax measurements are based on apparent 2MASS -band magnitudes and the /spectral type relation of Tinney, Burgasser & Kirkpatrick (2003). | F110W | F110W | |||
|---|---|---|---|---|---|---|
| (pc) | (mag) | (mag) | (AU) | |||
| (1) | (2) | (3) | (4) | (5) | (6) | (7) |
| SDSS 0151+1244 | 21.31.4 | 3.1 | 0.34 | 5.3 | 0.16 | 0.9 |
| SDSS 0207+0000 | 298 | 2.8 | 0.38 | 3.8 | 0.27 | 1.2 |
| 2MASS 02432453 | 10.60.5 | 3.1 | 0.34 | 4.6 | 0.20 | 0.5 |
| 2MASS 03486022 | 7 | 3.1 | 0.34 | 5.4 | 0.15 | 0.3 |
| 2MASS 04150935 | 5.750.10 | 3.2 | 0.33 | 6.0 | 0.12 | 0.2 |
| 2MASS 05160445 | 19 | 3.3 | 0.32 | 5.9 | 0.13 | 0.8 |
| 2MASS 0755+2212 | 20 | 3.5 | 0.29 | 5.8 | 0.13 | 0.9 |
| SDSS 08370000 | 2912 | 3.4 | 0.31 | 3.7 | 0.28 | 1.2 |
| SDSS 1110+0116 | 23 | 3.0 | 0.35 | 5.3 | 0.16 | 1.0 |
| 2MASS 12170311 | 11.00.2 | 3.1 | 0.34 | 5.3 | 0.16 | 0.5 |
| SDSS 12540122 | 13.70.4 | 3.5 | 0.29 | 6.5 | 0.10 | 0.6 |
| 2MASS 1503+2525 | 9 | 3.1 | 0.34 | 6.5 | 0.10 | 0.4 |
| SDSS 1624+0029 | 10.90.2 | 3.1 | 0.34 | 6.0 | 0.12 | 0.5 |
| SDSS 1750+1759 | 284 | 3.0 | 0.35 | 4.6 | 0.20 | 1.2 |
| 2MASS 22284310 | 13 | 3.2 | 0.33 | 5.7 | 0.14 | 0.6 |
| 2MASS 2254+3123 | 19 | 2.9 | 0.36 | 5.3 | 0.16 | 0.8 |
| 2MASS 2339+1352 | 26 | 3.5 | 0.29 | 5.6 | 0.14 | 1.1 |
Note. — Given values are 3 detection limits for a single PSF subtraction from individual calibration images, separated into the core/first Airy ring region () and the background-dominated region (). Mass ratio () limits assume F110W and Eqn. 6.
| Name | Spectral Types | DistanceaaParallax distance measurements from ESA (1997) and Vrba et al. (2004) are given with uncertainties, all others are spectrophotometric distance estimates from the discovery references. | Separation | Period | Note | ||
|---|---|---|---|---|---|---|---|
| (A) | (B) | (pc) | () | (AU) | (yr) | ||
| (1) | (2) | (3) | (4) | (5) | (6) | (7) | (8) |
| SDSS J042348.57041403.5 | L6 | T2 | 15.20.4 | 01640005 | 2.490.07 | 19 | 1,2 |
| 2MASS J051859952828372 | L6: | T4: | 34 | 00510012 | 1.80.5 | 10 | 3,4 |
| 2MASS J08503593+1057156 | L6 | T: | 262 | 0160010 | 4.40.4 | 43 | 5 |
| 2MASS J09201223+3517429 | L6.5 | T: | 21 | 0070010 | 1.50.5 | 6 | 5 |
| Gliese 337C | L8 | T: | 20.50.4 | 053003 | 10.90.7 | 150 | 6,7 |
| SDSS J102109.69030420.1 | T1 | T5 | 294 | 01720005 | 5.00.7 | 48 | 2,4 |
| Epsilon Indi B | T1 | T6 | 3.6260.013 | 07320002 | 2.6540.012 | 15 | 7,8 |
| SDSS J153417.05+161546.1 | T1.5 | T5.5 | 36 | 01100005 | 3.90.6 | 28 | 9 |
| 2MASS J17281150+3948593 | L7 | T: | 23 | 01310003 | 3.00.5 | 35 | 10 |
| 2MASS J22521073-1730134 | L6 | T2: | 143 | 01300002 | 1.80.4 | 9 | 11 |
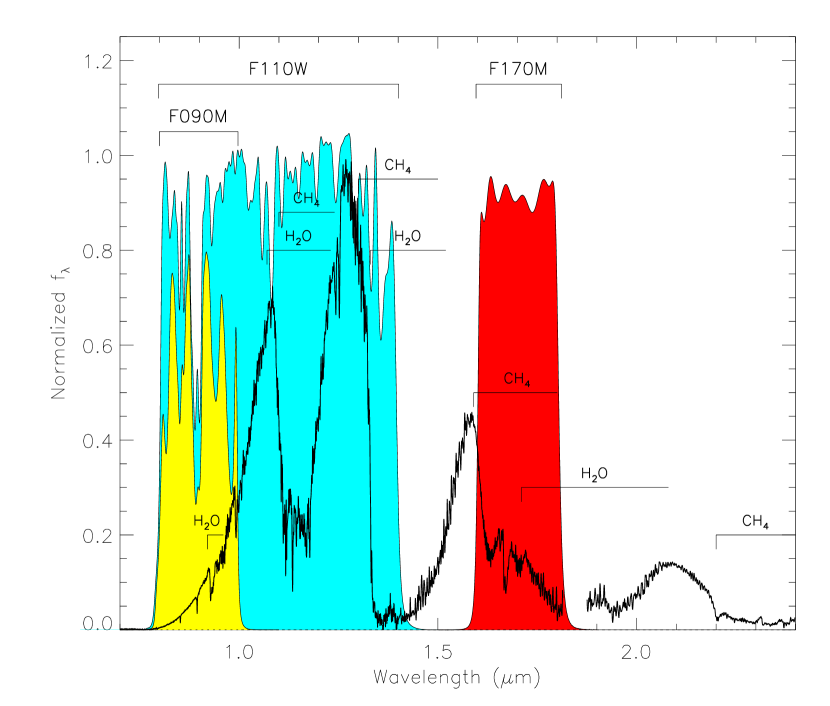
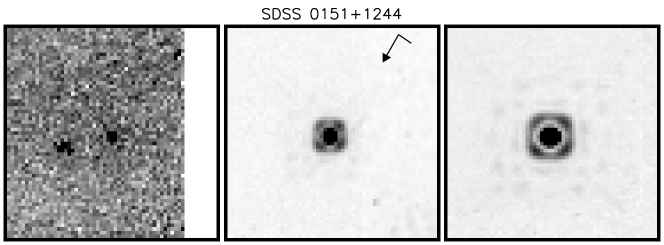
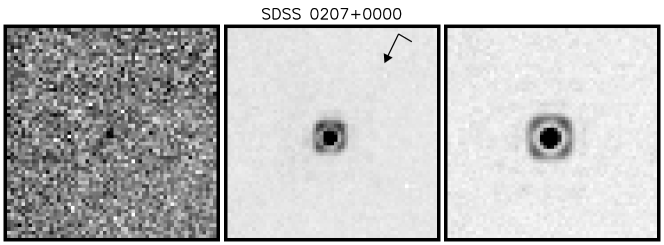
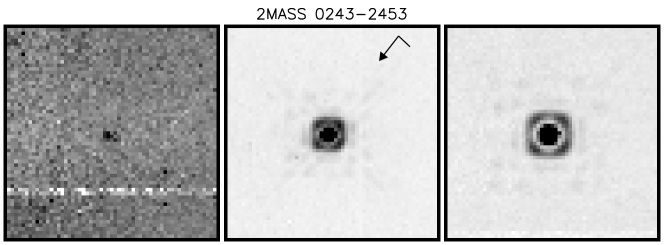
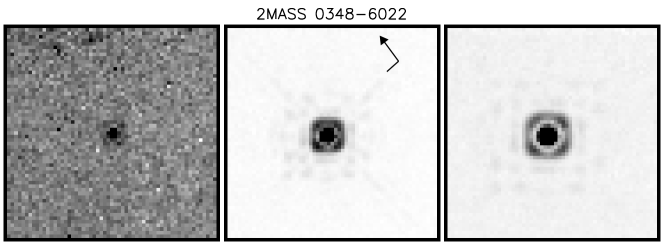
![[Uncaptioned image]](/html/astro-ph/0605577/assets/x6.png)
![[Uncaptioned image]](/html/astro-ph/0605577/assets/x7.png)
![[Uncaptioned image]](/html/astro-ph/0605577/assets/x8.png)
![[Uncaptioned image]](/html/astro-ph/0605577/assets/x9.png)
Fig. 2. — Continued.
![[Uncaptioned image]](/html/astro-ph/0605577/assets/x10.png)
![[Uncaptioned image]](/html/astro-ph/0605577/assets/x11.png)
![[Uncaptioned image]](/html/astro-ph/0605577/assets/x12.png)
![[Uncaptioned image]](/html/astro-ph/0605577/assets/x13.png)
Fig. 2. — Continued.
![[Uncaptioned image]](/html/astro-ph/0605577/assets/x14.png)
![[Uncaptioned image]](/html/astro-ph/0605577/assets/x15.png)
![[Uncaptioned image]](/html/astro-ph/0605577/assets/x16.png)
![[Uncaptioned image]](/html/astro-ph/0605577/assets/x17.png)
Fig. 2. — Continued.
![[Uncaptioned image]](/html/astro-ph/0605577/assets/x18.png)
![[Uncaptioned image]](/html/astro-ph/0605577/assets/x19.png)
![[Uncaptioned image]](/html/astro-ph/0605577/assets/x20.png)
![[Uncaptioned image]](/html/astro-ph/0605577/assets/x21.png)
Fig. 2. — Continued.
![[Uncaptioned image]](/html/astro-ph/0605577/assets/x22.png)
![[Uncaptioned image]](/html/astro-ph/0605577/assets/x23.png)
Fig. 2. — Continued.