Aromatic Features in M101 HII Regions and Starburst Galaxies
Abstract
The behavior of the aromatic features as a function of metallicity/radiation field hardness in M101 HII regions and starburst galaxies is investigated using Spitzer/IRS spectra. These spectra reveal that the 6.2, 7.8+8.6, and 11.3 m aromatics have different dependencies on metallicity/radiation field hardness. Specifically, the 6.2 and 7.8+8.6 m aromatics are weak or absent at a metallicity, 12+log(O/H), of 8.0 while the 11.3 m feature remains relatively strong. These results apply to both the M101 HII regions and starbursts showing that HII regions can indeed be thought of as “mini-starbursts.” Comparison of this work with various candidate materials results in a good match with the annealing behavior in Quenched Carbonaceous Composite (QCC) which is an amorphous, hydrogenated, carbonaceous solid.
Steward Observatory, Univ. of Arizona, Tucson, AZ 85721
The aromatic features are a family of dust emission features seen in many dusty astrophysical environments. The strongest aromatics are seen at 3.3, 6.2, 7.7, 8.6, 11.3, 12.7, and 17.1 m and all the aromatics have been identified with C-H and C-C bending and stretching modes of hydrocarbons containing aromatic rings (Tielens 2005). The shape and strength of the aromatics have been seen to vary in single sources (Werner et al. 2004b), among various Galactic sources (van Diedenhoven et al. 2004), and among galaxies (Engelbracht et al. 2005; Madden et al. 2006; Wu et al. 2006). A number of different materials have been proposed as the carriers of these features since they were first discovered (Gillett et al. 1973) including Hydrogenated Amorphous Carbon (HAC, Duley & Williams 1983), Quenched Carbonaceous Composites (QCC, Sakata et al. 1984), Polycyclic Aromatic Hydrocarbons (PAHs, Allamandola et al. 1985), coal (Papoular et al. 1989), and nanodiamonds (Jones & d’Hendecourt 2000). The leading candidate material for the aromatics is PAH molecules and they are included in the modified “astronomical PAHs” form in dust grain models (Li & Draine 2001; Zubko et al. 2004). The preception that PAHs are the carrier of the aromatics can be seen by the common use of the term “PAH features” to refer to the aromatics. The identification of PAH molecules with the aromatics may be somewhat premature given that laboratory spectrum of a mix of PAHs does not match the observed wavelengths and strengths of the aromatics in detail (Hudgins & Allamandola 2004).
As part of the Multiband Imaging Photometer for Spitzer (MIPS) Guaranteed Time Observations (GTO), two programs were carried out to explore the variations in the infrared (IR) Spectral Energy Distributions (SEDs) of massive star formation as a function of metallicity. The first program targets starburst galaxies with metallicities [12+log(O/H)] between 7.2 to 8.9, with emphasis on the lowest metallicity starbursts (Engelbracht et al. 2005). The second program targets M101 as it is a large, face-on spiral galaxy with HII regions which have metallicities from 7.4 to 8.8 (Zaritsky et al. 1994; van Zee et al. 1998; Kennicutt et al. 2003). The combination of these two programs probe HII regions, the components of starbursts, and entire starbursts.
Understanding the IR SEDs of starbursts and HII regions is important to understanding dust properties as well as the SEDs of redshifted galaxies undergoing massive star formation. Probing how dust emission features vary with physical environment (e.g., metallicity) can give clues to the dust grain materials. Interpreting number counts in deep fields to probe the star formation history of the Universe requires a good understanding of galaxy SEDs; the behavior of the aromatics directly affects models of number counts. For example, the aromatics moves through the MIPS 24 m band at redshifts between 1 and 2, causing a peak in the number counts (Lagache et al. 2004).
Observations
The starburst and M101 HII regions have been observed with all the instruments on the Spitzer Space Telescope (Spitzer Werner et al. 2004a). This paper concentrates on preliminary results from the Infrared Spectrograph (IRS, Houck et al. 2004b). Preliminary results for M101 from the Infrared Array Camera (IRAC, Fazio et al. 2004) and MIPS (Rieke et al. 2004) images were given by Gordon et al. (2005). Preliminary results from the IRAC and MIPS imaging of the starbursts were given by Engelbracht et al. (2005).
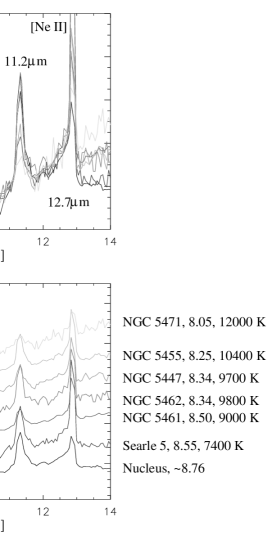
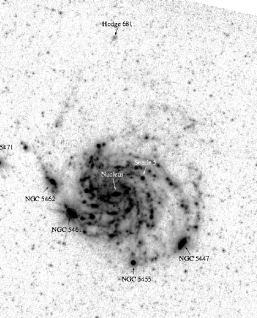
The spectra of the M101 HII regions (Fig. 1) were taken in the spectral mapping mode with full slit width steps perpendicular to the slit. Because the ShortLow and LongLow observations were taken approximately 3 months apart, the orientations of the slits were approximately the same. These spectral mapping observations were reduced with the SSC pipeline (version S12.0.2) and combined using CUBISM (Smith, J.D.T. 2006, in prep.). Spectra were extracted from the cubes for each HII region using an aperture with a radius of 15′′ and sky annuli from 20 to 30′′ referenced at 24 m. The size of the aperture and sky annuli were varied linearly with wavelength to roughly account for the changing diffraction limited PSF. The resulting spectra are shown in Fig. 2.
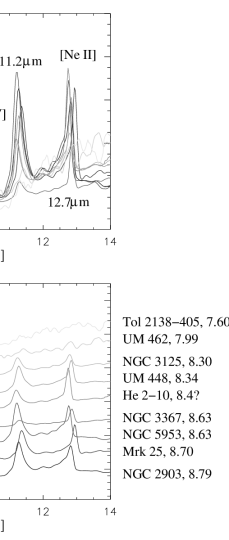
The spectra of the starburst galaxies were taken in staring mode. The reductions were done using the SSC pipeline (version S11.0.2). The redundant observations were combined and the spectra were extracted with a combination of SPICE and IRAF. The extractions were for the full slit, since the galaxies were usually noticeably extended. The final spectra have been re-sampled to a common wavelength scale resulting in some degree of smoothing. The resulting spectra are shown in Fig. 3.
Results
The M101 HII region and starburst spectra shown in Figs. 2 & 3 clearly display the behavior of decreasing strength of the aromatics with metallicity which is easiest to see in the strong 7.8+8.6 m aromatic complex. This is expected from previous Infrared Space Observatory (Madden et al. 2006) and Spitzer (Houck et al. 2004a; Engelbracht et al. 2005; Wu et al. 2006) observations. The spectra presented here allow us to determine how individual features vary as a function of metallicity. From visual inspection of the spectra, the 6.2, 7.8, and 8.6 m features are weak or absent around a metallicity of 8.0 as seen from the strength of these features in NGC 5471 (Fig. 2) and UM 462 and Tol2138-405 (Fig. 3). This is not the case for the 11.3 and 12.7 m features which are seen in all the spectra in both plots except for the lowest metallicity starburst spectra which are too noisy. Thus, different aromatic features seem to display different behaviors with metallicity.
We have quantified the behavior of the aromatics in the M101 HII region spectra by simply measuring the equivalent widths and total flux in the 6.2, 7.8+8.6, and 11.3 m aromatic features/complexes. The measurements were done for these three features/complexes as it is possible to identify continuum on either side of them. In addition to these aromatics, we also measured the fluxes in the [S IV] 10.6 m and [S III] 18.7 m lines as the ratio of these two atomic emission lines is a measure of the hardness of the radiation field.
The equivalent widths and flux ratios of these aromatics are plotted in Fig. 4 normalized to Searle 5, the strongest aromatic emitter, versus the [S IV]/[S III] ratio and metallicity. The weakening of the aromatics seems better correlated with increasing radiation field hardness ([S IV]/[S III]) than metallicity. The plots of the aromatics to the 11.3 m aromatic show that the 11.3 m aromatic weakens at a much slower rate than the 6.2 and 7.8+8.6 m aromatics. In addition, the changing of the aromatic ratios also seems better correlated with radiation field hardness than metallicity.
This preliminary analysis suggests that the weakening of the aromatics is due to the hardening of the radiation field and that the aromatic spectrum changes as the features weaken. The pattern of aromatic spectrum change is not in agreement with the predictions for PAH molecule ionization (Bakes et al. 2001, Fig. 5) which retain the 6.2+7.8+8.6 m complex at higher ionizations, but predicts weak or no 11.3 m aromatic. The aromatic spectrum change does seem to be in qualitative agreement with the annealing behavior of QCC (Sakata et al. 1984, Fig. 2).
A more complete analysis of the M101 HII regions will be published by Gordon et al. (in prep.) including a more accurate decomposition of the aromatics using the PAHFIT program (Smith, J.D.T., in prep.). A more complete analysis of the starburst spectra will be published by Engelbracht et al. (in prep.).
References
- Allamandola et al. (1985) Allamandola, L. J., Tielens, A. G. G. M., & Barker, J. R. 1985, ApJ, 290, L25
- Bakes et al. (2001) Bakes, E. L. O., Tielens, A. G. G. M., & Bauschlicher, C. W. 2001, ApJ, 556, 501
- Duley & Williams (1983) Duley, W. W. & Williams, D. A. 1983, MNRAS, 205, 67P
- Engelbracht et al. (2005) Engelbracht, C. W., et al. 2005, ApJ, 628, L29
- Fazio et al. (2004) Fazio, G. G., et al. 2004, ApJS, 154, 10
- Gillett et al. (1973) Gillett, F. C., Forrest, W. J., & Merrill, K. M. 1973, ApJ, 183, 87
- Gordon et al. (2005) Gordon, K. D., et al. 2005, ASP Conf. Ser., in press
- Houck et al. (2004a) Houck, J. R., et al. 2004a, ApJS, 154, 211
- Houck et al. (2004b) —. 2004b, ApJS, 154, 18
- Hudgins & Allamandola (2004) Hudgins, D. M. & Allamandola, L. J. ASP Conf. Ser. 309: Astrophysics of Dust, ed. , A. N. WittG. C. Clayton & B. T. Draine, 665–+
- Jones & d’Hendecourt (2000) Jones, A. P. & d’Hendecourt, L. 2000, A&A, 355, 1191
- Kennicutt et al. (2003) Kennicutt, R. C., Bresolin, F., & Garnett, D. R. 2003, ApJ, 591, 801
- Lagache et al. (2004) Lagache, G., et al. 2004, ApJS, 154, 112
- Li & Draine (2001) Li, A. & Draine, B. T. 2001, ApJ, 554, 778
- Madden et al. (2006) Madden, S. C., et al. 2006, A&A, 446, 877
- Papoular et al. (1989) Papoular, R., et al. 1989, A&A, 217, 204
- Rieke et al. (2004) Rieke, G. H., et al. 2004, ApJS, 154, 25
- Sakata et al. (1984) Sakata, A., et al. 1984, ApJ, 287, L51
- Tielens (2005) Tielens, A. G. G. M. 2005, The Physics and Chemistry of the Interstellar Medium (The Physics and Chemistry of the Interstellar Medium, by A. G. G. M. Tielens, pp. . ISBN 0521826349. Cambridge, UK: Cambridge University Press, 2005.)
- van Diedenhoven et al. (2004) van Diedenhoven, B., et al. 2004, ApJ, 611, 928
- van Zee et al. (1998) van Zee, L., et al. 1998, AJ, 116, 2805
- Werner et al. (2004a) Werner, M. W., et al. 2004a, ApJS, 154, 1
- Werner et al. (2004b) —. 2004b, ApJS, 154, 309
- Wu et al. (2006) Wu, Y., et al. 2006, ApJ, 639, 157
- Zaritsky et al. (1994) Zaritsky, D., Kennicutt, R. C., & Huchra, J. P. 1994, ApJ, 420, 87
- Zubko et al. (2004) Zubko, V., Dwek, E., & Arendt, R. G. 2004, ApJS, 152, 211