CLEANING UP ETA CARINAE: DETECTION OF AMMONIA IN THE HOMUNCULUS
Abstract
We report the first detection of ammonia in the Homunculus nebula around Carinae, which is also the first detection of emission from a polyatomic molecule in this or any other luminous blue variable (LBV) nebula. Observations of the NH3 (J,K)=(3,3) inversion transition made with the Australia Telescope Compact Array reveal emission at locations where infrared H2 emission had been detected previously, near the strongest dust emission in the core of the Homunculus. We also detect ammonia emission from the so-called “strontium filament” in the equatorial disk. The presence of NH3 around Car hints that molecular shells around some Wolf-Rayet stars could have originated in prior LBV eruptions, rather than in cool red supergiant winds or the ambient interstellar medium. Combined with the lack of any CO detection, NH3 seems to suggest that the Homunculus is nitrogen rich like the ionized ejecta around Car. It also indicates that the Homunculus is a unique laboratory in which to study unusual molecule and dust chemistry, as well as their rapid formation in a nitrogen-rich environment around a hot star. We encourage future observations of other transitions like NH3 (1,1) and (2,2), related molecules like N2H+, and renewed attempts to detect CO.
Subject headings:
astrochemistry — circumstellar matter — ISM: molecules — stars: mass-loss — stars: winds, outflows1. INTRODUCTION
So far, Carinae is the only luminous blue variable (LBV) known to be surrounded by dense molecular gas in its own ejecta nebula (Smith 2006, 2002a; Smith & Davidson 2001). Nearly all other LBV nebulae show bright infrared [Fe ii] emission from dense partially-ionized gas (Smith 2002b; Smith & Hartigan 2006) and many have detectable dust shells (e.g., Clark et al. 2003). This owes to the extreme youth, high density, and extremely high mass (more than 10 M⊙) of the bipolar Homunculus Nebula (Smith et al. 2003). Thus, it is a unique laboratory in which to study the behavior of molecules bathed in FUV radiation (e.g., Ferland et al. 2005).
While red supergiant (RSG) winds are familiar sites for molecule detection, molecular gas in the ejecta of luminous hot stars is rare. Some Wolf-Rayet (WR) stars are surrounded by molecular gas, but its origin is not always clear. The molecular gas traced by H2 and CO in NGC 2359, NGC 6888, and the nebula around WR 134 is thought to be swept-up from the surrounding interstellar medium (St-Louis et al. 1998; Cappa et al. 2001; Rizzo et al. 2003). Several polyatomic molecules have been detected in this swept-up material around NGC2359, including ammonia (Rizzo et al. 2001). The molecular gas surrounding WR 16, WR 18 (NGC 3199) and WR 75 (RCW 104), on the other hand, is thought to have formed from stellar ejecta in a previous RSG evolutionary phase (Marston et al. 1999; Marston 2001; Welzmiller et al. 1998). In particular, HCN, HCO+, CN, and HNC have been detected in the NGC 3199 ring nebula around WR 18 (Marston 2001). The molecular gas in the Homunculus, in stark contrast, is known to have formed out of ejecta from the 19th century outburst. If a WR evolutionary phase will follow the current LBV phase of Car, then its molecular gas may be relevant to the molecular shells around WR stars – i.e., it hints that they may have formed in giant LBV eruptions like Car’s 19th century outburst, not just in RSG winds. Several M⊙ of material is present in these molecular WR nebulae as well as the Homunculus (Marston et al. 1999; Welzmiller et al. 1998; Smith et al. 2003).
Surrounding the Homunculus are the shock-heated “outer ejecta”, which are ionized and well-suited for nebular abundance studies, revealing nitrogen enriched and C+O depleted material with n(N)/n(O) of roughly 20 (Davidson et al. 1982; Dufour et al. 1997; Smith & Morse 2004). The chemical composition of the Humongulus itself, however, is unknown because it is mostly neutral or molecular. No CO has been detected (e.g., Cox & Bronfman 1995), but its near-IR emission lines of H2 are bright (Smith 2002a, 2004, 2006). Therefore, if it is composed of nitrogen-rich CNO ash like the other ejecta around Car, one might expect to find emission from ammonia.
We searched for emission from the NH3 (J,K)=(3,3) inversion transition instead of the (1,1) or (2,2) transitions for two reasons. First, H2 emission in the Homunculus – while narrow at any single position – is spread over velocities of 500 km s-1 (Smith 2002a, 2006). This would blend the (1,1) and (2,2) transitions, as they are separated by only 0.029 GHz or 367 km s-1. Second, the energy above ground for the (3,3) transition (roughly 130 K) is similar to the observed dust temperature of 140 K in the outer H2 skin (Smith 2006; Smith et al. 2003).
| Date | Array | Observing | Cont. Sν | Beam |
|---|---|---|---|---|
| Config. | time | (Jy) | Size | |
| 2004 Oct 30 | 1.5C | 12 h | 4.01 | 0504 |
| 2005 Mar 29 | 6A | 12 h | 2.47 | 0403 |
| 2005 Jul 21 | H75 | 6 h | 7.39 | 21″17″ |
2. OBSERVATIONS
We obtained observations of NH3(3,3) emission toward Carinae using three configurations of the Australia Telescope Compact Array (ATCA) between 2004 October and 2005 June (Table 1). A bandwidth of 128 MHz was centered on 23.870 GHz, close to the rest frequency of the ammonia NH3(3,3) transition ( = 23.870129 GHz), and divided into 64 channels, giving an effective 2-channel velocity resolution of 50 km s-1 and velocity bandwidth of 1200 km s-1. The flux was calibrated by observing PKS B1934–638 and adopting a value of 0.77 Jy. We estimate the final flux calibration to be better than 20%. The bandpass and phase calibrators were PKS 1921-293 and PKS B1045–62, respectively. Data were edited and calibrated using the miriad software package according to standard procedures.
For each individual dataset, continuum was subtracted in the uv plane. The resultant line data were then combined and Fourier-transformed into a data cube (, , ). Each channel image was deconvolved using the clean algorithm and restored with synthesized beams of either 3229 (Fig. 1; natural weighting) or 1007 (Fig. 2; uniform weighting). The rms noise taken from an emission-free channel is 0.4 mJy beam-1 per 25 km s-1.
In the case of the continuum emission, each of the three datasets were Fourier-transformed separately and the images were deconvolved using the clean algorithm. The restoring synthesized beams as well as the values for the measured integrated total emission (within the 10 contour level) are listed in Table 1. The fluxes vary depending on the different array configurations as well as the intrinsic millimeter variability of Car during its 5.5 yr cycle (e.g., White et al. 2005). From the SED of Car, we expect a continuum flux of 2–3 Jy at 12mm (Brooks et al. 2005), which is roughly consistent with the observed values listed in Table 1. We do not expect the ammonia emission or absorption to vary as much as the continuum emission during the 5.5 yr cycle, because the molecular gas is shielded from the weak changing Lyman continuum, and no significant change in the near-IR H2 emission is seen (Smith 2006).
3. RESULTS AND INTERPRETATION
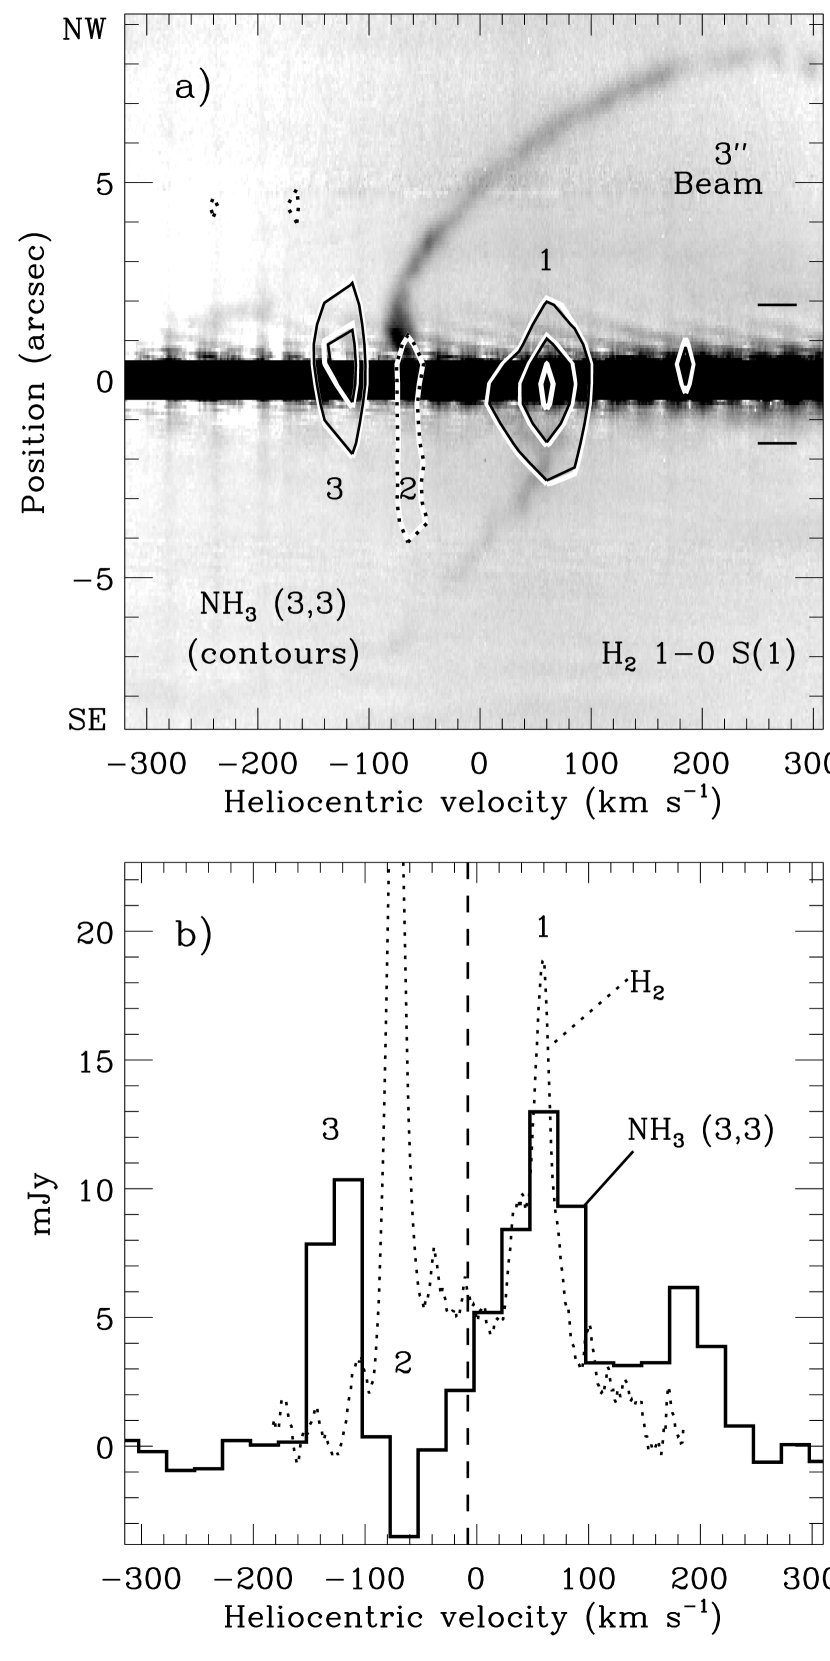
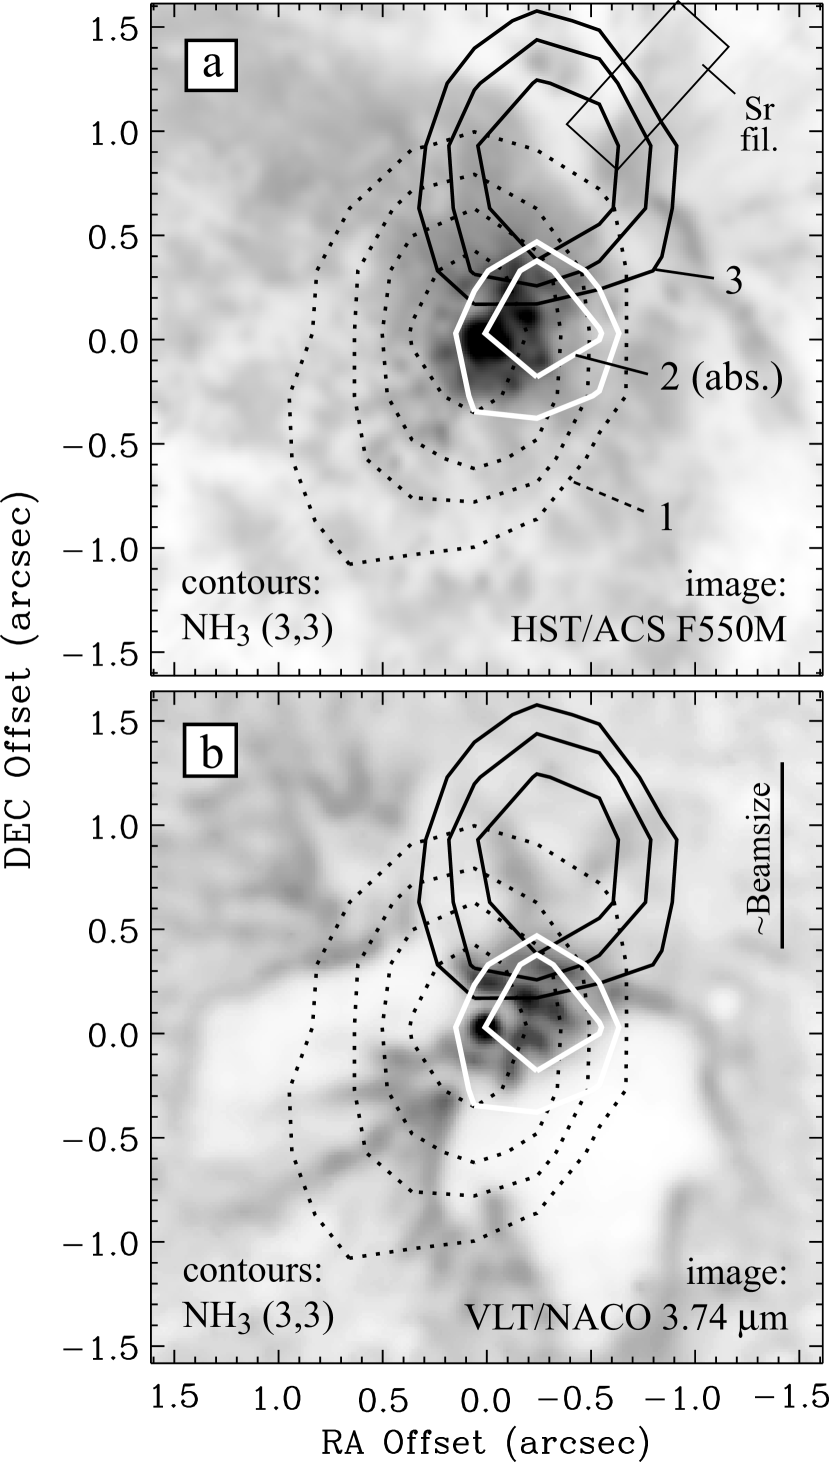
Figure 1 shows a position-velocity diagram and spectral tracings comparing NH3 (3,3) to H2 =1–0 S(1) from Smith (2004). Both lines have been shifted to a heliocentric velocity frame (=+11.6 km s-1). Figure 2 shows the spatial distribution of ammonia compared to optical and IR dust emission (Smith et al. 2004; Chesneau et al. 2005). Our observations are only sensitive to the brightest ammonia emission associated with the warmest dust features near the star. We highlight three main velocity components in NH3 (the numbers below are the numbered features in Figs. 1 and 2):
1) The brightest ammonia emission is found at +56 km s-1 in Figure 1 and centered 02 E/SE of the star in Figure 2, corresponding to the point where the back wall of the approaching SE polar lobe meets the equator in the tightly-pinched waist of the bipolar nebula. The ammonia emission overlaps exactly with the brightest H2 emission in velocity, and is therefore behind the continuum source (see Smith 2006). This indicates that polyatomic molecules can survive very close to the star (within a few hundred AU) in dusty clumps seen in high resolution images (Chesneau et al. 2005; Smith et al. 2004). The required shielding is evidently from a column of 1023 cm-2 and 4 mag (Smith 2006). Chesneau et al. found unusual aluminum-rich dust composition in these blobs, which may be related to their molecular chemistry and the C and O depletion. If this gas is at 140–250 K (see below), then the emission optical depth of this feature is 0.045 to 0.09.
2) The brightest H2 emission is seen at –73 km s-1 and 1″ NW of the star in Figure 1a. It is the blushifted counterpart of component 1. This blueshifted feature is not seen in NH3 emission, but it is seen weakly in absorption at the same velocity. Figure 2 shows that this molecular absorption coincides with the brightest equatorial dust condensations near the star (Chesneau et al. 2005). The ammonia absorption also overlaps spatially with bright ionized blobs called the Weigelt knots (see Smith et al. 2004). These knots are known to be in the equator on the near side of the star. Thus, the ammonia molecules probably absorb the direct 12mm free-free emission from their own ionization fronts. The strength of the absorption feature is about –3.5 mJy (Fig. 1b), which would correspond to an optical depth of about 0.002 if it is absorbing the 2 Jy continuum source. However, the actual optical depth depends on how much of the extended 12mm continuum is covered by the absorbing condensations, which is very uncertain at our spatial resolution. In order for in component 2 to match for component 1, the covering factor would be 4–8%.
3) We also detect a third ammonia feature not seen in H2 emission, located at –110 km s-1 in Figure 1 and 1″ NW of the star in Figure 2. Its velocity clearly does not match the wall of the NW polar lobe seen in H2. Instead, it probably originates from the so-called “strontium filament” (see Fig. 2a and Hartman et al. 2004). Unusual low-ionization atomic emission lines like [Sr ii], [Ca ii], [Ni ii], etc., are seen to be localized at this same position and velocity (Davidson et al. 2001; Smith 2002a; Hartman et al. 2004). The presence of NH3 emission combined with the lack of infrared H2 emission here may give important clues to the excitation of the “strontium filament”. In particular, it indicates that there is warm molecular gas in the equatorial plane that is shielded from the FUV radiation which pumps the Lyman-Werner bands of H2. The fact that the NH3 emission in component 3 is found where the visual-wavelength emission lines from the “strontium filament” seem to end is probably due to our line-of-sight extinction – this coincides with the point where equatorial material closer to the star is blocked by dust in the edge of the SE polar lobe. Figure 1 may indicate a related component at positive velocities as well, at roughly +185 km s-1.
The NH3 data also show a possible absorption feature at –500 to –550 km s-1 along the line of sight to the star (not shown), but it is difficult to judge the reality of this feature since it was near the edge of our observed bandpass. We might expect absorption at that velocity from the approaching wall of the SE polar lobe of the Homunculus (Gull et al. 2005; Smith 2002a, 2006).
4. DISCUSSION: THE RELEVANCE OF AMMONIA
The Homunculus is the only LBV ejecta nebula known to contain molecular gas111There is evidence for CO J=1-0 and 2-1 emission associated with AG Car (Nota et al. 2002) and 2.3 bandhead emission associated with HR Car (McGregor et al. 1988), but in both cases the authors conclude that the CO emission arises in the immediate circumstellar environment of the star, and not in the detached nebulae resolved in optical emission-line images., and our detection of NH3 is the first detection of emission from a polyatomic molecule in the ejecta around any LBV. The detection of ammonia raises interesting questions about how complex molecules can form rapidly in the ejecta of a hot star. Did these molecules grow directly in the gas phase, or did they accumulate on grain surfaces first? Were they expelled from icy grain mantles by shocks? Polyatomic molecules are harder to form than simple diatomic molecules in an extreme irradiated environment, so these molecules likely formed when the ejecta were very dense and self-shielding. The major dust formation episode happened 15 yr after the Great Eruption’s 1843 peak, judging by the sharp drop in the visual brightness. If molecules formed at the same time, then scaling back from the currently-observed density in the H2 skin of the Homunculus (Smith 2006), the density and temperature in the ejecta at that time were 108.5–109 cm-3 and 1000–1500 K.
While bright near-IR emission from H2 has clearly been detected in the Homunculus (Smith 2002a, 2006), CO has never been detected, either in 2.3 bandhead emission (Smith 2002a) or in 12CO J=2–1 (Cox & Bronfman 1995). The abscence of CO combined with a clear detection of NH3 provides a qualitative indication that the molecular gas in the Homunculus is indeed nitrogen rich and has been processed through the CNO cycle. This is not necessarily surprising in light of the other CNO-processed ejecta around Car (Davidson et al. 1982; Dufour et al. 1997; Smith & Morse 2004), but it is the first actual observation that the Homunculus itself is also N-rich because atomic abundances for the neutral Homunculus cannot be obtained easily.
Calculating an ammonia abundance from our current data is frought with uncertainty, which can be reduced with future observations of other ammonia transitions. For component 1 in Figure 1, we measure a total flux integrated over the line of 1.08 Jy km s-1, or a beam-averaged brightness temperature of 11.3 K (with an adopted beam filling factor of 1). The column density of NH3 (3,3) is given by
(e.g., Rohlfs & Wilson 2004) where =2.5610-7 s-1 (Ho & Townes 1983), and =1.99 MHz (25 km s-1). The observed intensity of component 1 indicates N1015 cm-2. With only one transition, we don’t know the gas temperature. However, at cm-3 in the Homunculus walls (Smith 2006; Gull et al. 2005), it is likely that the gas and dust temperatures are in equilibrium, so we take the range of observed dust temperature of 140–250 K (Smith et al. 2003). (We also neglect the possibility of non-thermal amplification.) If we adopt the expression for the partition function given in equation A15 of Ungerechts et al. (1986), we find a total ammonia column density of 1015.7 cm-2 assuming a temperature of 140 K, or 1015.8 cm-2 assuming 250 K. The column density of H2 as we look perpendicularly through a wall of the Homunculus should be several 1022 cm-2 (Smith 2006; Ferland et al. 2005). Taken together, we therefore find a rough estimate for the ammonia abundance of N(NH3)/N(H2)=(1.6–2)10-7. This is almost a factor of 10 higher than ammonia abundances derived recently in a similar way for a sample of infrared dark clouds by Pillai et al. (2006), and our low estimate is higher than the highest value in their sample. Because of differences in beamsize and velocity range, the limits to CO emission given by Cox & Bronfman (1995) are not enough to place meaningful constraints on the N(NH3)/N(CO) abundance when compared with our data; renewed attempts to detect CO in Car would be useful.
Unfortunately, we cannot provide a quantitative estimate of the total nitrogen abundance in the ejecta from ammonia observations alone, as it depends upon grain chemistry, whether or not ammonia has been liberated from icy grain mantles, and the ammonia survival probability at various locations in the nebula. Furthermore, most of the nitrogen in the molecular zones is expected to be locked up in unobservable N2 molecules (Ferland et al. 2005). It will be interesting if future observations of additional transitions with higher sensitivity can constrain the ammonia abundance as a function of position throughout the Homunculus, and if future observations can detect additional molecules that we might expect in nitrogen-rich molecular ejecta. For instance, N2H+ may be expected as part of the path to NH3.
References
- (1)
- (2) Brooks K. J., Garay, G., Nielbock, M., Smith, N., & Cox P. 2005, ApJ, 634, 436
- (3)
- (4) Cappa, C.E., Rubio, M., & Goss, W.M. 2001, AJ, 121, 2664
- (5)
- (6) Chesneau, O., et al. 2005, A&A, 435, 1043
- (7)
- (8) Clark, J.S., Egan, M.P., Crowther, P.A., Mizuno, D.R., Larionov, V.M., & Arkharov, A. 2003, A&A, 412, 185
- (9)
- (10) Cox, P., & Bronfman, L. 1995, A&A, 299, 583
- (11)
- (12) Davidson, K., Walborn, N.R., & Gull, T.R. 1982, ApJ, 254, L47
- (13)
- (14) Dufour, D.G., et al. 1997, in ASP Conf. Ser. 120, 255
- (15)
- (16) Ferland, G., Abel, N., Davidson, K., & Smith, N. 2005, ASP Conf. Ser. 332, The Fate of the Most Massive Stars, ed. R.M. Humphreys & K.Z. Stanek (San Francisco: ASP), 294
- (17)
- (18) Genzel, R., Downes, D., Ho, P.T.P., & Bieging, J. 1982, ApJ, 259, L103
- (19)
- (20) Gull, T.R., Vieira, G., Bruhweiler, F., Nielsen, K.E., & Danks, A. 2005, ApJ, 620, 442
- (21)
- (22) Hartman, H., Gull, T., Johansson, S., Smith, N., and the HST Eta Car Tresury Team 2004, A&A, 419, 215
- (23)
- (24) Ho, P.T.P., & Townes, C.H. 1983, ARAA, 21, 239
- (25)
- (26) Marston, A.P. 2001, ApJ, 563, 875
- (27)
- (28) Marston, A.P., Welzmiller, J., Bransford, M.A., Black, J.H., & Bergman, P. 1999, ApJ, 518, 769
- (29)
- (30) McGregor, P.J., Hillier, D.J., & Hyland, A.R. 1988, ApJ, 334, 639
- (31)
- (32) Nota, A., Pasquali, A., Marston, A.P., Lamers, H.J.G.L.M., Clampin, M., & Schulte-Ladbeck, R.E. 2002, AJ, 124, 2920
- (33)
- (34) Pillai, T., Wyrowski, F., Carey, S.J., & Menten, K.M. 2006, A&A, 450, 569
- (35)
- (36) Rizzo, J.R., Martin-Pintado, J., & Desmurs, J.F. 2003, in IAU Symp. 212, A Massive Star Odessey, from Main Sequence to Supernova, ed. K.A. van der Hucht, A. Herrero, & C. Esteban (San Francisco: ASP), 740
- (37)
- (38) Rizzo, J.R., Martin-Pintado, J., & Henkel, C. 2001, ApJ, 553, L181
- (39)
- (40) Rohlfs, K., & Wilson, T.L. 2004, Tools of Radio Astronomy (Heidelberg: Springer)
- (41)
- (42) Smith, N. 2002a, MNRAS, 337, 1252
- (43)
- (44) Smith, N. 2002b, MNRAS, 336, L22
- (45)
- (46) Smith, N. 2004, MNRAS, 351, L15
- (47)
- (48) Smith, N. 2006, ApJ, in press, astro-ph/0602464
- (49)
- (50) Smith, N., & Davidson, K. 2001, ApJ, 551, L101
- (51)
- (52) Smith, N., & Hartigan, P. 2006, ApJ, 638, 1045
- (53)
- (54) Smith, N., & Morse, J.A. 2004, ApJ, 605, 854
- (55)
- (56) Smith, N., Gehrz, R.D., Hinz, P.M., Hoffmann, W.F., Hora, J.L., Mamajek, E.E., & Meyer, M.R. 2003, AJ, 125, 1458
- (57)
- (58) Smith, N., et al. 2004, ApJ, 605, 405
- (59)
- (60) St-Louis, N., Doyon, R., Chagnon, F., & Nadeau, D. 1998, AJ, 115, 2475
- (61)
- (62) Welzmiller, J., Marston, A.P., & Black, J. 1998, BAAS, 30, 895
- (63)
- (64) White, S., Duncan, R.A., Chapman, J.M., & Koribalski, B. 2005, ASP Conf. Ser. 332, The Fate of the Most Massive Stars, ed. R.M. Humphreys & K.Z. Stanek (San Francisco: ASP), 126
- (65)