Spitzer Space Telescope IRAC and MIPS Observations of the Interacting Galaxies IC 2163 and NGC 2207: Clumpy Emission
Abstract
IC 2163 and NGC 2207 are interacting galaxies that have been well studied at optical and radio wavelengths and simulated in numerical models to reproduce the observed kinematics and morphological features. Spitzer IRAC and MIPS observations reported here show over 200 bright clumps from young star complexes. The brightest IR clump is a morphologically peculiar region of star formation in the western arm of NGC 2207. This clump, which dominates the H and radio continuum emission from both galaxies, accounts for % of the total 24m flux. Nearly half of the clumps are regularly spaced along some filamentary structure, whether in the starburst oval of IC 2163 or in the thin spiral arms of NGC 2207. This regularity appears to influence the clump luminosity function, making it peaked at a value nearly a factor of 10 above the completeness limit, particularly in the starburst oval. This is unlike the optical clusters inside the clumps, which have a luminosity function consistent with the usual power law form. The giant IR clumps presumably formed by gravitational instabilities in the compressed gas of the oval and the spiral arms, whereas the individual clusters formed by more chaotic processes, such as turbulence compression, inside these larger-scale structures.
1 Introduction
IC 2163 and NGC 2207 are interacting galaxies at a distance of 35 Mpc (Elmegreen et al. 1995a, hereafter Paper I). IC 2163 has an unusual bright oval of star formation shaped like an eyelid (“ocular” structure) at mid-radius that was predicted to be the result of large-scale gaseous shocks in simulations of grazing prograde encounters (Elmegreen et al. 1991; Sundin 1993). Several ocular or post-ocular galaxies and their companions have been observed and modeled in detail by our group (Kaufman et al. 1997; Kaufman et al. 1999; Kaufman et al. 2002). The IC 2163/NGC 2207 pair was observed at optical (Elmegreen et al. 2000, hereafter Paper III; 2001, hereafter Paper IV), millimeter (Thomasson 2004), and radio wavelengths (Paper I; Elmegreen et al. 1995b, hereafter Paper II). HST WFPC2 observations were used to measure the properties of compact star clusters, many of which satisfy the criteria for super star clusters (SSC; Paper IV), and to determine the opacities of dust clouds in the foreground screen provided by NGC 2207 (Paper IV). The HST observations also showed that the clusters and stellar groupings in five major star-forming regions are hierarchically distributed and that the fractal dimensions of the star fields are comparable to the fractal dimension of interstellar gas (Elmegreen & Elmegreen 2001). Also, HST PC images of the central region of NGC 2207 revealed what appears to be acoustic turbulence (Elmegreen et al. 1998; Montenegro, Yuan & Elmegreen 1999; for other examples, see Martini et al. 2003).
Detailed numerical simulations have reproduced over two dozen dynamical and structural details of the IC 2163/NGC 2207 pair (Paper II; Paper III; Struck et al. 2005, hereafter Paper V). The simulations suggest that NGC 2207 is moving prograde in the plane of IC 2163, causing tidal forces that initially compressed and stretched IC 2163 so that the stars were jarred into caustic patterns and the gas was shocked into bright star-forming ridges. Tidal forces in NGC 2207 were perpendicular to its disk, causing perpendicular oscillations and possible warping (Paper II). There is widespread high velocity dispersion in the HI gas in these galaxies, commonly reaching km s-1 in otherwise normal-looking regions. These dispersions have since been found in all the ocular interactions (see references above) and in other near collisions (e.g., Irwin 1994). Because of the extraordinarily large HI clouds ( M⊙) that are also present (as observed also in other close encounters – Irwin 1994; Smith 1994), the observed velocity dispersions promoted the idea that tidal dwarf galaxies can form because of super-size gravitational instabilities in the gas (Elmegreen, Kaufman, & Thomasson 1993; Wetzstein & Burkert 2005). An even larger cloud located at the tip of the far-western arm in NGC 2207 and containing M⊙ appeared to be triggered by the interaction as well; tidal forces can accumulate outer disk material at this point (Mirabel, Dottori, & Lutz 1992; Elmegreen et al. 1993; Duc, Bournaud, & Masset 2004).
NGC 2207 contains a peculiar region of intense emission at H and radio continuum wavelengths (hereafter called Feature i, following the nomenclature in Paper III). Feature i is located on a spiral arm in the western outer disk. Supernova 1999ec occurred just south of this region, near two other small IR clumps (see Fig. 10 below). The H luminosity of Feature i, spanning 6 arcsec in diameter, is equivalent to that of 30 Dor in the Large Magellanic Cloud. The radio continuum emission comes from a arcsec core with times the luminosity of Cas A at 6-20 cm (Vila et al. 1990), and an extended component ( kpc diameter) with times the luminosity of Cas A (Paper II). HST reveals an unusual dust cloud elongated for pc perpendicular to the local spiral arm and containing M⊙ of gas with magnitudes of optical extinction (Paper IV). HST also shows a red V-shaped feature extending for pc in the opposite direction to the dust cloud (Paper III). Between the dust cloud and the red V is a very red region that may contain several massive clusters. Perhaps Feature i is a young star cluster that formed with such a high density that the central stars combined into a black hole, as in models by Ebisuzaki et al. (2001).
Spitzer Space Telescope (SST) observations of other galaxies reveal old and young stars at the shortest wavelength (m) in the Infrared Array Camera (IRAC, see Fazio et al. 2004), and PAH emission and heated dust continuum at the longer IRAC wavelengths (m, m, and m; e.g., Helou et al. 2004; Willner et al. 2004). The 8m band in IRAC and the longer wavelength bands in the Multiband Imaging Photometer (MIPS; Rieke et al. 2004) tend to show more filamentary structures, such as those seen in M81 (Gordon et al. 2004a).
Here we present IRAC and MIPS observations of IC 2163/NGC 2207 with the SST in order to consider the distribution and properties of clumpy emission at IR wavelengths. The HST data showed the presence of many super star clusters (SSCs), with the most massive having comparable luminosities to the most massive clusters in the Antennae galaxies (Zhang & Fall 1999). This is peculiar for IC 2163/NGC 2207 because the total number of clusters is 100 times smaller than in the Antennae. Generally, larger samples of clusters have brighter brightest members, with a near-linear relation between brightest luminosity and number of members for an luminosity () distribution function (Whitmore 2002). The similarity of the brightest members in IC 2163/NGC 2207 compared with the much more prolific Antennae galaxy suggests that the cluster luminosity function in IC 2163/NGC 2207 is either a flatter power law than what is seen in the Antennae, or it is peaked at the high mass end. The most massive clusters are in the eyelid part of IC 2163, which, according to our models, is a galactic shock front caused by the sudden radial motion of disk gas responding to tidal torques. Many other clusters have formed in filamentary shocks as well.
The SST images are not resolved well enough to separate individual star clusters within a clump. The clumps that can be observed are the equivalent of star complexes, which are collections of OB associations and dense clusters ranging in size from several hundred parsecs to a kpc (Efremov 1995). In contrast, our HST observations gave luminosities for individual clusters. We compare these two data sets here. The extended IR emission that was observed with SST will be the subject of a forthcoming paper (Kaufman et al. 2005).
2 Data and Overall Emission
Observations were made with the Spitzer Infrared Array Camera on February 22, 2005 and the Multiband Imaging Photometer on March 11, 2005. For the IRAC observations at 3.6, 4.5, 5.8, and 8m, the full array readout mode was used, with high dynamic range. The frame time was 30 sec, using a cycling dither pattern with 9 positions. The images have a scale of 1.2 arcsec pixel-1, corresponding to pc at 35 Mpc. For the MIPS observations, the large field size was used for m and 160m, and the small field size for 70 m. For 24m, the exposure time was 30 sec. For 70m, a raster map was made with a 3x3 raster and a step size of 1/2, with a 10 sec exposure time. For 160m, 4 cycles were used, with 10 sec per cycle. The image scales are 2.45 arcsec pixel-1, 4.0 arcsec pixel-1, and 8.0 arcsec pixel-1 for the m, m, and 160m bands, respectively. The corresponding point-spread functions are 2.0 - 2.4 arcsec (FWHM) for the IRAC images and 5.9 arcsec, 18 arcsec, and 40 arcsec, respectively, for the MIPS bands.
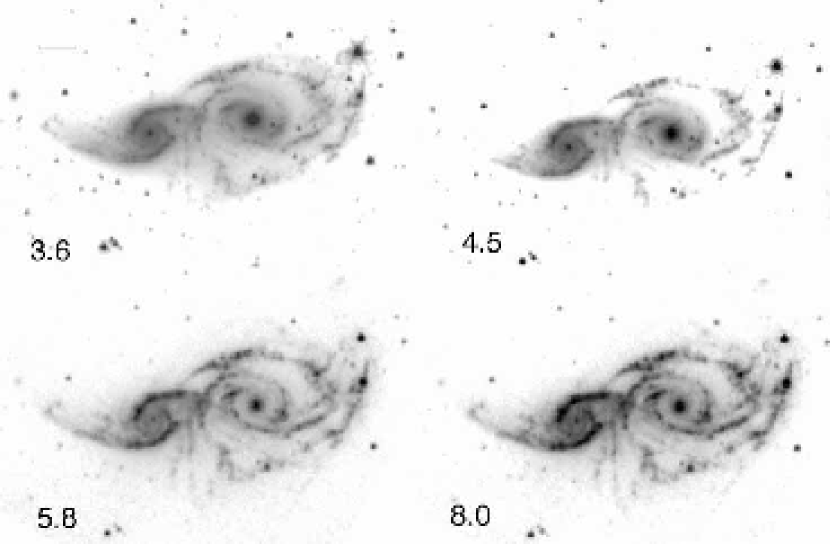
The Basic Calibrated Data images are shown in Figure 1, with each band represented separately for IRAC and MIPS. For comparison, a B-band HST WFPC2 image is also shown (from Paper IV). The line in the upper left shows a scale of 30 arcsec, which corresponds to 5100 pc at the distance of 35 Mpc. The clumps and spiral arms in the IRAC bands match the HST optical features well. There is a semi-circular shell 1600 pc in diameter in the southern arm of NGC 2207 (marked in Figure 2 below) that is not obvious in the optical images but partially coincides with an H feature (Fig. 3 below) and a dust arc.
Feature i stands out in all IRAC and MIPS images as an intense source in the western outermost arm of NGC 2207. The central 2 pixels of Feature i are saturated in the 24m image. The eyelid region of IC 2163 is also prominent in all IRAC and MIPS bands; it dominates the 160m image, although it is unresolved. The MIPS 70m image is similar to the 20 cm radio continuum image (shown in Paper I). A detailed comparison between MIPS, HI, and radio continuum emissions will be made in a second paper (Kaufman et al. 2005).
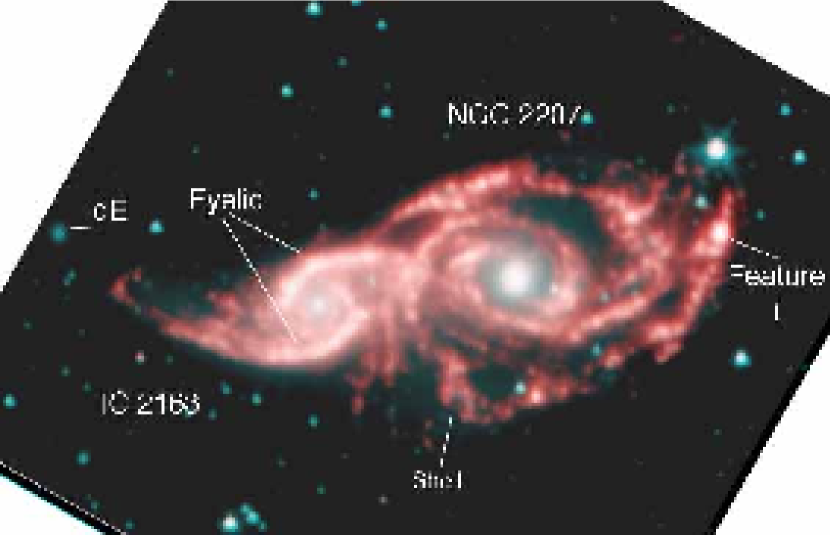
Figure 2 shows a color composite image of the four IRAC bands, with colors ranging from blue for the short wavelength band to red for the long wavelength band. The prominent features discussed in this paper are identified. The spiral arms in NGC 2207 are clearly segmented into regularly spaced beads of emission. The same is true for the oval in IC 2163, although the individual beads are difficult to see with the contrast level in this color image (they show up better in Figs. 4 and 15 below).
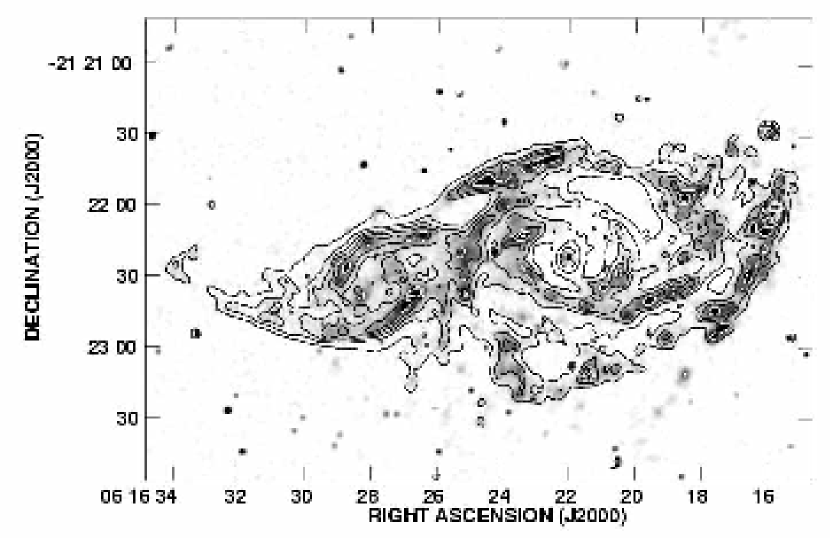
Figure 3 is an overlay of 8m contours on an H emission image (from the ground-based continuum-subtracted H image in Paper IV). The bright 8m clumps match the HII regions well. A generally good match between m and H was also found for NGC 300 by Helou et al. (2004). Kennicutt (2005) noted that 95% of the infrared clumps in nearby galaxies of the Spitzer Infrared Nearby Galaxy Survey (SINGS – Kennicutt et al. 2003) have associated HII regions, and that this implies star-forming regions take less than 1 Myr to become optically visible.
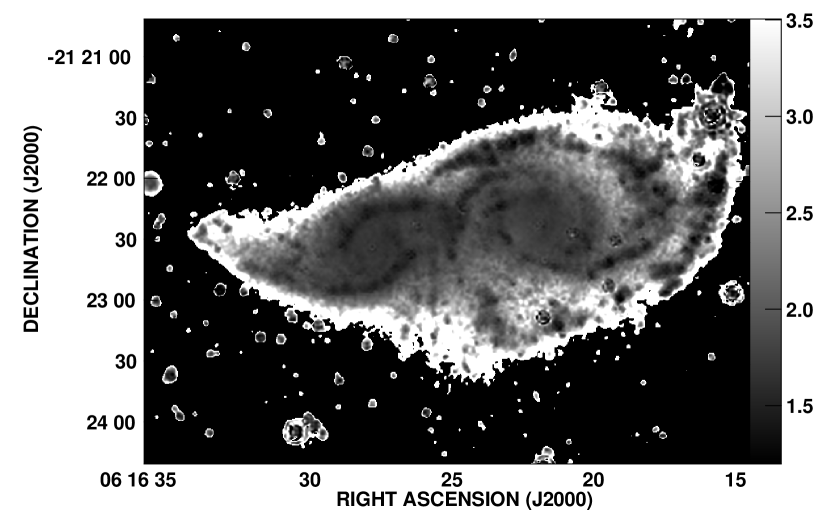
A map made by dividing the 3.6m image by the 4.5m image is shown in Figure 4. The nuclei disappear and the star-forming clumps become more prominent. Evidently, the [3.6]/[4.5] ratio is about constant everywhere outside the clumps. This implies that the mixture of field stars and diffuse hot dust emission is uniform outside the clumps. Inside the clumps, the [3.6]/[4.5] ratio is low (black in the image). This low ratio may be the result of an excess of H Br at m from ionization inside the clumps (Churchwell et al. 2004; Whitney et al. 2004); the hot and bright stars which contribute to this ionization are not prominent at either m or m. Figure 5 shows scans through both nuclei out to the galaxy edges in 3.6m and 4.5m and in the ratio [3.6]/[4.5]. The uniformity of the interclump [3.6]/[4.5] ratio is also evident here. Clumps at the far right of the scan (west in the image) break this uniformity with low values of [3.6]/[4.5].
The total flux densities in IRAC and MIPS were determined for the combined galaxies, the eyelid and interior region of IC 2163, and Feature i. We used the imstat routine in the Image Reduction and Analysis Facility (IRAF) to measure the total flux inside a box with a fixed size for each region. Backgrounds determined from neighboring boxes were subtracted. The results are given in Table 1. For Feature i, the box size was , which is 3 times the MIPS m pixel scale.
3 Clumpy Emission
3.1 IRAC colors
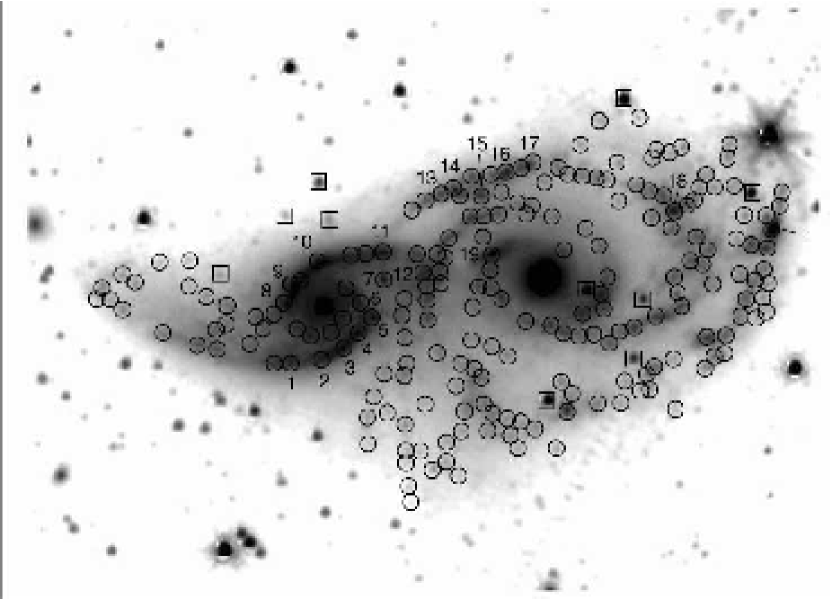
Photometry for 225 IRAC clumps, identified by eye in the 3.6m image, was done in all possible passbands using phot in IRAF. All the measured clumps are circled in Figure 6; stars are denoted by squares. The clumps also show up in the other passbands (Fig 1) but the longer wavelengths show the more filamentary, gaseous structures. The brightest clumps in the figure are numbered and Feature i is indicated; their properties are listed in Table 2, including H flux. The positions and IRAC fluxes of all the measured clumps are presented in Table 3.
The photometry was performed using a fixed aperture 3 pixels in radius with background determined from an annulus 5 pixels in width, separated from the aperture by 5 pixels. The IRAC counts in MJy/ster were converted to flux densities by multiplying by the areas of the pixels, and then converted to magnitudes using the zeropoints given in the online IRAC tables of the Data Handbook111http://ssc.spitzer.caltech.edu/irac/dh, Chapter 5. The photometric accuracy of the IRAC images is better than 0.1 mag. We find that the measurement uncertainties are 0.2 to 0.5 mags for different regions because of varying sky backgrounds and variations within the clumps. The faintest clump was 18.7 mag at 3.6m, which corresponds to an absolute magnitude of at a distance of 35 Mpc.
Color-magnitude diagrams for all measured IRAC clumps are shown on the left in Figure 7. Different symbols correspond to different locations in the galaxies: inner regions (triangles), eyelid or middle (squares), and outer regions (circles). Open symbols are for IC 2163 and filled symbols are for NGC 2207. The rms scatter in color increases as the clumps get fainter. We judged that the color errors start to be significant for [3.6] and [4.5] magnitudes fainter than 16, [5.8] magnitudes fainter than 14, and [8.0] magnitudes fainter than 12.5. Complete removal of any object with at least one passband fainter than these limits led to 116 remaining clumps, which we will refer to as the low-noise group; the other clumps will be referred to as the high-noise group. The color-magnitude diagrams for the 116 low-noise clumps are shown on the right of Figure 7. The brightest object in all diagrams is Feature i in NGC 2207. The next brightest objects are in the eyelid of IC 2163, most of which are 1-2 mag brighter at 3.6m than any other clump.
Figures 8 and 9 show color-color plots of the 116 low-noise clumps. They all cluster in a narrow region on these plots, indicating some uniformity to the properties of the interstellar medium. There are no obvious trends between color and location. In Figure 8, the colors of dust (Li & Draine 2001) and G0-M5 stars (Jones et al. 2005) are shown by a plus symbol and diamond, respectively (from Smith et al. 2005; Whitney et al. 2004). In Figure 9, the plus symbol shows the dust again, but the G0-M5 stars would be off scale at [4.5]-[5.8] and [5.8]-[8.0]. The nuclei of both galaxies are shown by X symbols in both figures; they have essentially the same colors as G0-M5 stars (Jones et al. 2005). The [3.6]-[4.5] colors of the clumps are redder than G0-M5 stars by mag, signifying populations with average ages younger than A0V stars (e.g., Pahre et al. 2004a). The [4.5]-[5.8] colors are redder than G0-M5 stars by mag, again indicating young ages.
Several studies have considered whether IR emission from a given region is starlight-dominated, PAH-dominated, or blackbody emission in certain passbands. Engelbracht et al. (2005) examined IR spectra, IRAC, and MIPS data of spiral galaxies, compared them with stellar evolution models, and showed a clear division between sources containing PAH emission and sources not containing PAH emission based on the ratio of starlight subtracted 4.5m flux density to 8m flux density; a ratio less than 0.05 corresponds to the presence of PAH emission. They assumed that the 3.6m emission is dominated by old starlight (e.g., Helou 2004). Following their method, we subtracted a scaled 3.6m emission (with a factor 0.57 which they based on Starburst 99 models from Leitherer et al. 1999) from the 4.5m emission for each clump; the ratio of this reduced 4.5m emission to the 8m emission fell below 0.05 for 215 out of the 225 clumps, indicating that these clumps should contain PAH emission. Such PAH emission is expected to contribute mostly to 5.8 m and 8m bands (e.g. Helou et al. 2004, Wang et al. 2004). Sajina, Lacy, & Scott (2005) showed that PAH’s are located in a different region of versus than starlight (see their Fig. 6). Our clumps are almost all in the range of to 1, to 1.5 for these flux ratios, which falls within the PAH regime of the diagram. Also, our clump color distribution for [5.8]-[8] peaks between 1.6 and 2.2, which is consistent with PAH-dominated emission at these wavelengths, as modeled by Li & Draine (2001).
In other SST observations of interacting galaxies, Arp 107, at a distance of 138 Mpc, was found to have numerous clumps in a ring-like distribution with a 1.3 mag azimuthal variation of [4.5]-[5.8] colors indicating a stellar age gradient, as matched by numerical simulations (Smith et al. 2005). The clumps studied in Arp 107 were divided into brighter and fainter ones. The brighter clumps had slightly redder [4.5]-[5.8] and [5.8]-[8.0] colors (by about 0.5 mag) than the fainter clumps. Smith et al. interpret the redder clumps as having a higher proportion of young to old stars. Our clumps on average have about the same [3.6]-[4.5] colors as all of their clumps, -0.2 to 0.3, with colors that are about 0.5 mag redder than their bright clumps in [4.5]-[5.8] and similar to their bright clumps in [5.8]-[8.0]. These redder colors suggest that our regions are slightly younger on average than theirs.
Spitzer IRAC observations of the Antennae galaxy pair NGC 4038/4039, at a distance of 21 Mpc, reveal clumpy star formation and extensive PAH emission (Wang et al. 2004). Their average [5.8]-[8.0] clump color is mag, which is consistent with our clump colors. M51 also has prominent star-forming clumps and bright filaments in SST images (Calzetti et al. 2005). IRAC and MIPS observations of M81 (Gordon et al. 2004a) and M31 (Gordon et al. 2004b) show that the prominent clumpy UV, 8m, and 24m features correspond well to one another.
The alignment between IRAS clumps and H emission in IC2163/NGC 2207, the color-color distribution of the IRAC clumps, and the likely presence of PAH emission from them, all suggest that these regions are relatively young. Precise age estimates are not possible without better calibrations of the relative contributions to the IRAC bands from young and old stars, dust, free-free emission, PAHs, and other possible emission sources. Nevertheless, the young ages found here are consistent with the ages derived by more conventional techniques using HST data, which are up to several years (Paper IV).
3.2 Sample Comparisons with HST emission
Each IRAC clump is composed of numerous smaller clusters and associations that are individually visible with HST. The super star clusters found with HST, for example, are inside the IRAC clumps, although these IRAC clumps do not appear to be more luminous or special in any way.
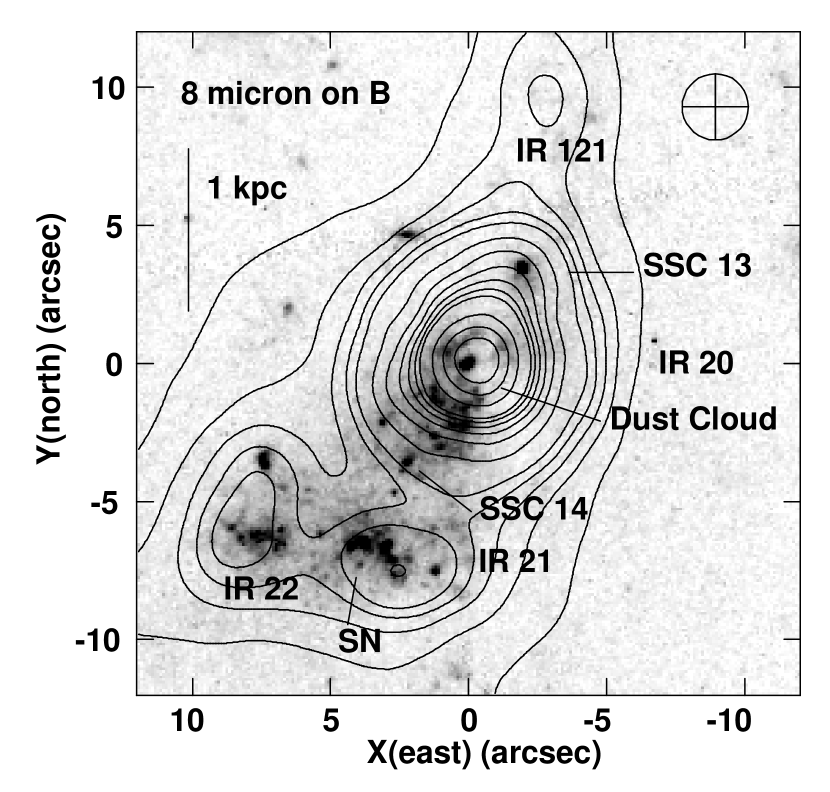
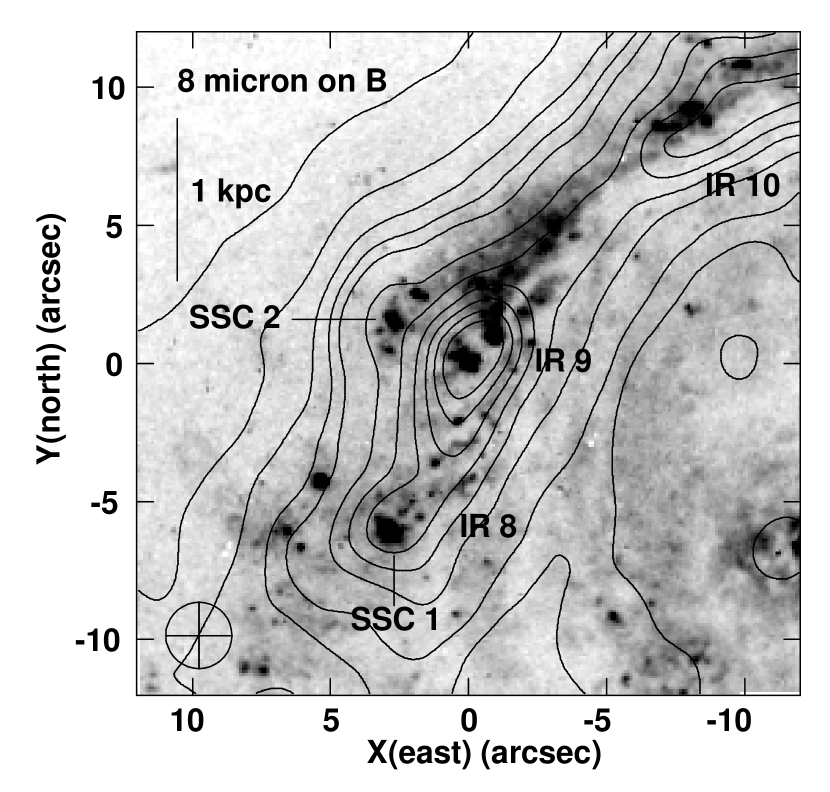
Figure 10 shows two IRAC star forming regions in detail; Feature i is on the left and clump IR 9 from the eyelid region is on the right. The contours are m emission at 2.2 arcsec resolution and the gray scale is the optical emission at 0.13 arcsec resolution. In the vicinity of Feature i, there are two M⊙ super star clusters (SSC) from the catalog of Paper IV, many other clusters and associations, four IRAC sources from Table 3, an optical supernova source, and a dust streak to the southwest of a very red cluster near the center of the large m source. In the vicinity of IR 9, there are 2 super star clusters and 2 other IRAC sources.
3.3 Comparison with H emission
The luminosities of HII regions were calculated in Paper IV based on ground-based H images. The H resolution is similar to the IRAC resolution. For individual clumps there is a correlation between the H luminosity, which ranges from L⊙ to L⊙, and the passband-combined IRAC luminosity, which ranges from L⊙ to L⊙ (using erg s-1). There is a scatter around this correlation of mag, which is most likely the result of slight age and extinction differences. The luminosities are compared in Figure 11. The brightest feature in both passbands is again Feature i. For the individual clumps, the average ratio of H to 3.6m is . For Arp 107, this ratio averages 0.04 (Smith et al. 2005). For Hm, our average ratio is and for Arp 107, the ratio ranges from 0.006 to 0.05.
For the combined galaxies, the ratio of H to 3.6m luminosity is 0.009. This ratio is slightly less than that in Arp 107, where it is 0.012 for the large galaxy and 0.025 for the small galaxy (Smith et al. 2005). It is also slightly less than in NGC 7331, where it is 0.013 (Regan et al. 2004). The ratio of H to m for the combined IC 2163/NGC 2207 pair is 0.007, which is slightly less than 0.0083 and 0.025 for Arp 107, and 0.030 for NGC 7331.
3.4 Spectral energy distributions
The IRAC SEDs for the clumps in Table 2 are shown in Figure 12, with the log of the wavelength times flux density, , versus the log of the wavelength. The B, V, and I flux densities from HST are also plotted. They were measured in the HST images using apertures 36 pixels in radius to correspond to the apertures used for the IRAC images. Some of the SEDs dip down toward the blue, presumably because of extinction in these optical bands (see Paper IV). All of the clumps show a dip at 4.5m.
The brightest clump is Feature i, which is represented twice in Figure 12: once as an IRAC flux like the other clumps and again as a flux from all passbands inside a box, including MIPS images. The line with open circles indicates the IRAC values using the usual pixel size of this instrument, with photometry done in an aperture of 3 pixel radius, as for the other clumps. The flux inside the box is indicated by a dotted line and x-marks; it has the background subtracted as determined from neighboring boxes. The two curves for Feature i are similar at short wavelengths because the 3-pixel central source dominates the emission inside the box. The combined light from IC 2163 and NGC 2207 is shown in Figure 12 as the long solid line. The eyelid plus interior of IC 2163 is shown as a long dashed line.
The integrated SEDs from other galaxies observed in the SINGS survey are similar to the integrated SED in Figure 12. Dale et al. (2005) show SEDs for galaxies spanning a wide range of Hubble types. Our combined-galaxy SED resembles the integrated SEDs for the Seyfert I galaxy NGC 1566 (SABbc), the HII galaxy NGC 2403 (SABcd), and the LINER galaxies NGC 1097 (SBb), NGC 7552, and NGC 3190 (SAap). These galaxies all have a dip at 4.5m, a local peak at 5.8 or 8m, a trough at m, and a rise to m or m, like IC2163/NGC 2207 combined. There are also other galaxies in Dale et al. (2005) that are qualitatively similar; many of them are LINERs or Seyferts.
Theoretical curves in Dale et al. (2005) fit the region from m to m with continuum emission from dust. We determined dust temperatures from MIPS data for the combined galaxies, the eyelid and interior regions of IC 2163, and Feature i. They are based on the flux densities in Table 1. Because there can be different dust components contributing to the short and long wavelength bands of MIPS, we calculated blackbody temperatures from both the m/m ratio and the m/m ratio. Dust temperatures were not determined for individual clumps because of the lack of resolution in the long wavelength bands. For these three regions, the dust temperatures from the short wavelength ratios were approximately 50K, 52K, and 58K, respectively. Similarly, the dust temperatures from the long wavelength flux ratios were 25K, 24K, and 36K, respectively. The uncertainties in our flux densities are about 20% based on the MIPS Data Handbook222http://ssc.spitzer.caltech.edu/mips/dh/mipsdatahandbook3.1.pdf. This would give a temperature range of 3K for the above measurements. Thus, the temperatures for the combined galaxies and the eyelid are essentially the same, but the temperature in Feature i is slightly warmer. This is also evident from the SED in Figure 12, which shows a downturn from m to m for Feature i, unlike the other SEDs.
3.5 IRAC Luminosity Functions
Clump luminosities were determined from the IRAC bands. The MIPS bands contain diffuse ISM emission that is unrelated to star complexes (Haas et al. 2002), and they are also poorer resolution, so we do not include them here. For the IRAC bands we integrated the flux density over wavelength,
| (1) |
where the bandwidths for the 4 bands are m, m, m, and m333http://ssc.spitzer.caltech.edu/documents/som/irac60.pdf, page 82; corresponds to m, corresponds to m, etc., and is the flux density in Jy per micron ( with cgs units for speed of light and wavelength ). For this equation, is the distance of 35 Mpc, evaluated in cm.
Figure 13 shows the IRAC luminosity functions for the three main regions of each galaxy (inner, middle, and outer, as in Figs. 7-9). The bar-chart histograms are counts in bins of width 0.5 in the log of the luminosity (in ) for the low-noise clumps. The open squares are counts for all the clumps, including the high-noise clumps. The x-marks on the abscissae are the sensitivity limits, L⊙, defined by an integration over the separate limits mentioned in reference to Figure 7: 16th mag for [3.6] and [4.5], 14th mag for [5.8], and 12.5 mag for [8].
The smooth curves in Figure 13 calculate the luminosity distribution in a different way, this time including both the low-noise group (116 clumps, plotted with solid-line curves) and the combined low and high-noise groups ( clumps, plotted with dashed curves). In this method, we add a Gaussian distribution for each clump with an area equal to unity and a dispersion equal to the uncertainty in the luminosity obtained from the uncertainty in the photometry measurement (as calculated by phot in IRAF). This error is low for the brighter clumps (0.16 of a magnitude at log L) and relatively high for the faintest clumps (0.3 of a magnitude at log L, which is the limiting sensitivity). In this way, the fainter clumps can be included with their high uncertainties. The resultant summed distributions were then multiplied by 4 to give them a height in Figure 13 comparable to the histogram. The Gaussian-sum distributions resemble the binned distributions for the low-noise clumps (the dotted histograms), and extend to lower luminosity for the high-noise clumps, resembling the counts shown by open squares. The dots in the Gaussian-sum curves represent the centers of the bins used for counting.
The combined luminosity functions for all of the IRAC sources are presented in Figure 14. The panel on the left is for the sum of the IRAC bands, and the panel on the right is for the 3.6 m band only, calculated as and converted to cgs. As in the previous figure, the solid curves are for the low-noise sources and the dashed curves are for all the sources including those with high-noise. Dots on the curves denote the centers of the counting bins. Feature i is the single peak on the right in the left panel; it appears only in the combined luminosity function. The open squares are counts for all the sources in intervals of 0.5 mag. The two sensitivity limits are shown as x-marks on the abscissae.
The combined IRAC luminosity function (Fig. 14) is steeper than the usual power law with a slope of on such a log-log plot. In Paper IV we also found that the HII region luminosity function has a steep drop-off at the upper end.
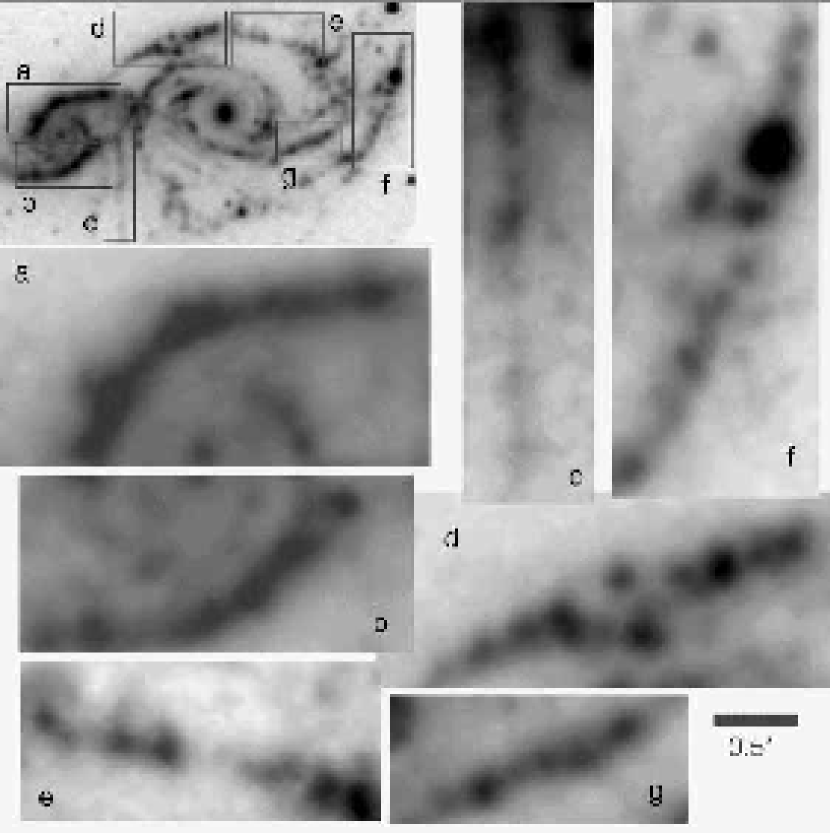
A high fraction of clumps are in thin filaments, including the whole eyelid region and many of the arcs of spiral arms. In these regions, the complexes look like regular beads on a string (e.g., Figs. 2 and 4). Figure 15 illustrates several of the regions where the clumps appear evenly spaced. The 8m logarithmic image is shown because this band has a particularly good correspondence with star-forming regions, as noted earlier. The top left of Figure 15 shows the whole image, with boxes indicating the strings of clumps that are shown enlarged below the galaxies. There are other smaller strings evident in the figure too. This beading phenomenon is fairly common here: 110 out of the 225 measured IRAC clumps are in more-or-less regular strings of three or more members. The scale of 0.5 arcmin indicated in the figure is for the expanded images; it corresponds to kpc. The average spacing of the clumps in strings is kpc, and the typical clump diameter is kpc. Figure 16 shows histograms of the clump luminosities in each of the strings in Figure 15, including Feature i in string f.
3.6 Model Luminosity Functions
Random power-law luminosity functions were made for comparison with the galaxy data. The intrinsic function ranged between the observed lower limit, L⊙, and an arbitrary upper limit of L⊙, and was of the form , as typically observed (corresponding to a slope of -1 when binning in , as in Figs. 13 and 14). To make a Gaussian contribution to the distribution function for each model clump, i.e., having a width given by the uncertainty in the luminosity and an area equal to unity, the model noise for each model luminosity was determined from the empirical relationship between the observed luminosity and the observed uncertainty in luminosity (which ultimately came from the magnitudes and rms errors in magnitude given by phot). Figure 17 shows the resultant model distribution functions. The left column of panels in Figure 17 is for three random trials with clump numbers of , , and . The top two panels on the right are for different random trials with 116 clumps each, as in the low-noise distribution functions for our combined galaxies. The bottom right panel shows 10 random trials (shifted successively upward for clarity) with only clumps, which is the number observed in the eyelid region. Each curve is normalized to have the same area; dots show the sampling interval for the histograms.
Figure 17 suggests that the single bright clump found at high luminosity in the galaxy data, which is Feature i, is not unusual when the number of clumps brighter than L⊙ in IRAC is as small as 116. The distribution functions at high luminosity are ragged in our models, commonly giving a single bright clump somewhat removed from the next brightest clump. We also see from Figure 17 that all of the model functions with total numbers exceeding show traces of the intrinsic power law distribution extending down to the sensitivity limit. The gradual drop-off below this limit is from the finite Gaussian widths. Even random models with very low numbers of complexes, 11 in these cases, have peaks in the distribution functions close to the sensitivity limit. This differs from the observed distributions for clumps in some strings, particularly in the eyelid region. Secondary peaks may occur at larger luminosities because of low-number statistics, as in Figure 17, but in the models, there is always a prominent peak close to the limit.
The random-clump models reinforce our impression from Figures 13 and 16: the distribution function for the eyelid region of IC 2163 drops off too fast at low luminosity to be the result of an intrinsic power law that extends below the sensitivity limit. The same may be true for other clump strings, but the statistical sampling is too poor to be sure. Also, the combined luminosity function for all 116 bright clumps (Fig. 14) appears to drop off too fast at intermediate-to-high luminosity to be derived from an intrinsic function unless feature i is considered a member of the sample. Indeed, the IRAC luminosity of Feature i is not so unusual for an function: most of the models with 100 or more clumps had the equivalent of a stand-out Feature i. As noted before, there are other unusual aspects of Feature i as evident from its peculiar morphology, but apparently not the mass or luminosity alone.
Feature i would appear more unusual if the intrinsic luminosity function fell significantly more rapidly than the assumed power law at high luminosity. If the distribution function is , then the probability of finding an object with is . For as above, the probability of finding a source with L⊙ when L⊙ is 1.8%, so among 116 objects, two Feature-i like sources might be expected, as discussed above. If is log-normal like the halo globular clusters, for with at the peak, , and (cf. Fig. 14), then the probability that a source is more than times brighter than the peak is . Taking as in Figure 14 gives a probability of 4.6%, which amounts to five Feature-i like sources among 116 total objects. In either case, Feature i does not appear to be unusual considering the other bright clusters in these galaxies.
One explanation for the lack of a power law luminosity function in the eyelid region is that the complexes could be so old that fading and evaporation have depleted the low-mass members. This is unlikely because the eyelid is a transiently compressed region triggered by the recent interaction. The clumps also appear to be young because of their H emission and IRAC colors (Sect. 3.1). In that case, we expect little disruption and fading during their short lives, and a resulting luminosity function for the brightest clumps that resembles the initial clump mass function.
Another explanation for the peaked luminosity function is that the clumps in the strings formed by regular gravitational instabilities which gave them a characteristic size and mass. This differs from the usual model where small clusters form in a turbulent gas with hierarchical structure and an power law (Elmegreen & Efremov 1997). The clump separations observed here are about the same as those observed for star complexes in the spiral arms of many grand design galaxies (Elmegreen & Elmegreen 1983). The formation process of these complexes is most likely a gravitational instability in the spiral shock, which has locally low shear and a high enough density to be unstable during the arm residence time (Elmegreen 1994; see simulations in Kim & Ostriker 2002). In this explanation, what makes the IRAC luminosity function unusual (compared to the expected power-law) is that IRAC measures whole star complexes and not individual (small) clusters. The luminosity functions of young beads on a string in grand design spiral galaxies could have the same peaked shape. This is in contrast to the overall distribution of HII complexes in galaxies, which have luminosity functions consistent with a power law (Elmegreen & Salzer 1999).
The most peculiar IRAC luminosity function in Figure 13 is for the clumps in the eyelid region. We measured the V and I band magnitudes of 165 individual star clusters in this region (to deeper limits than in Paper IV) using our HST data and 3-pixel apertures for the photometry. Clusters could be distinguished from stars by their positions on a V-I versus I-band color-magnitude diagram and by the relatively high cluster luminosities. The resulting cluster I-band luminosity function is shown as the histogram in Figure 18. The luminosity function of the sum of the cluster luminosities in each SSC clump along the eyelid is shown by the dashed line. These are the luminosities for emission only in the I-band filter and are therefore less than the bolometric cluster luminosities. The dotted line has a slope of , which is the typical power law slope for clusters on a log-log plot. The high-luminosity part of the cluster function does not follow any clear power law, but it is close enough to the typical slope to be considered normal. The peak in the histogram is close to the faintness limit where measurement errors become important and fainter clusters start to be lost in the noise. The summed-luminosity function is significantly above the detection limit and is peaked at a value of L⊙; this shape supports the IRAC observation that the luminosity function for large clumps in the eyelid is not a power law.
The eyelid luminosity function for IRAC clumps in Figures 13 and 16, combined with the eyelid luminosity function for individual HST clusters in Figure 18, suggest that only the star complexes, representing the blended large-scale regions of many young clusters, might be considered to have a characteristic luminosity and a peaked luminosity function. Individual clusters which comprise these complexes appear to be more scale-free.
The peaked luminosity functions for IRAC clumps in the eyelid region of IC 2163 and in several of the beaded strings of NGC 2207 are analogous to the inferred peaked initial mass function for bright clusters in the B region of starburst galaxy M82 (de Grijs, Parmentier, & Lamers 2005). The M82 region is much older ( Gy) than the spiral and ocular filaments in IC2163/NGC 2207, however, so corrections for cluster dissolution had to be applied in that study.
The distinction between power law and peaked mass distributions for individual clusters and star complexes may have important implications for the formation of globular clusters in the early Universe. Old globular clusters currently have Gaussian distribution functions for their magnitudes, unlike young clusters and super star clusters, which have power laws. One solution is that the low mass halo globulars have evaporated by now (Okazaki & Tosa 1995; Baumgardt 1998), but this implies there should be a correlation between the peak in the globular cluster luminosity function and the galactocentric distance (Vesperini 2000a,b), because clusters closer to the center should evolve faster. Such a correlation is not observed (Kundu et al. 1999; see review in Fall & Zhang 2002). Parmentier & Gilmore (2005) recently simulated an evolving population of clusters and concluded that the halo population started with a Gaussian mass function rather than a power law. One explanation for this Gaussian could be that halo globulars form as a result of an instability with a dominant scale (e.g., Fall & Rees 1985). This explanation is supported somewhat by the present observations, although the geometry and instability are different here. Nevertheless, it seems reasonable that different circumstances can give different cluster mass distribution functions. Perhaps some halo globular clusters formed by regular instabilities in the spiral arms of interacting young disk galaxies.
4 MIPS emission
The total IR luminosity () of a region can be estimated from MIPS emission using the method of Dale & Helou (2002):
| (2) |
To determine the luminosity for both galaxies combined, we used imstat to define a box outlining them and subtracted sky background. The luminosity for both galaxies is =8.1 L⊙. The for the whole inner region of IC 2163, including the eyelid, is L⊙, or about 25% of the total from both galaxies. The from a region in diameter surrounding Feature i is L⊙, or 4.5% of the total. Replacing the 2 saturated pixels in Feature i at 24m by the same values as the surrounding pixels or using double the surface brightness at the FWHM resulted in an insignificant change in its flux. Feature i is extraordinary at m, accounting for 12% of the total emission in this passband. All of these results use the values in Table 1.
The total star formation rate can be estimated by multiplying the infrared luminosity (in cgs units) by a conversion factor of , giving year (Kennicutt 1998). This conversion was initially based on IRAS results. Detailed UV, IR, and H properties of star-forming clumps in M51 by Calzetti et al. (2005) indicate that MIPS emission (particularly 24m) is a good star formation indicator, but that there are variations by a factor of several from one galaxy to another because of different possible sources of MIPS emission. The result using is a star formation rate of 14.5 M⊙ yr-1 for the combined galaxies. For the eyelid, the star formation rate is 3.6 M⊙ yr-1, and for Feature i, it is 0.7 M⊙ yr-1. The eyelid and Feature i contain intense star formation considering their small sizes. In Paper IV, we found 15 star-forming regions on the HST WFPC2 images in the vicinity of Feature i included in the SST photometry. Their sizes ranged from unresolved to a few dozen parsecs. Based on their absolute V magnitudes and [V-I] colors and a comparison with Starburst 99 evolution models (Leitherer et al. 1999), the masses of these individual regions range from to with ages of a few million years. These values are consistent with the MIPS star formation rate.
The H luminosities correlate with m and m luminosities in star-forming galaxies (Wu et al. 2005). Based on their conversions, we get a total star formation rate from m in the combined galaxies equal to M⊙ yr-1; from m, it is M⊙ yr-1. These rates are similar to those calculated above.
5 Conclusions
IC 2163 and NGC 2207 contain several hundred clumps of IR emission strung out along thin spiral or oval-like arcs. One star-forming region, called Feature i in our previous HST study, dominates the short-wavelength MIPS images; it accounts for 12% of the total 24m emission from the two galaxies. The next brightest regions are in the eyelid of IC 2163, where galaxy-scale shocks formed from the recent interaction with NGC 2207. All of these regions appear to be young ( yr) based on their optical and IRAC colors, and their association with H emission. The SED for the IC 2163/NGC 2207 pair matches that of other late-type galaxies observed by SINGS.
The luminosity distribution function of the IRAC clumps in the eyelid region of IC 2163 shows significant deviations from a power law. The prevalent clump morphology of beads on a string in this region and in the spiral arms of NGC 2207 suggests the clumps formed by regular gravitational instabilities, in which case the luminosity function is consistent with a characteristic mass from the instability. This is unlike the usual situation for individual clusters in galaxy disks where the gas and associated turbulent motions produce hierarchical structure and power-law mass distributions. The IRAC clumps are much larger than individual star clusters. Our peaked distribution for the IRAC clumps should be compared with the luminosity or mass distributions of giant star complexes in grand design galaxy spiral arms. The HST cluster luminosity function in the eyelid region of IC 2163 is in fact closer to the standard power law, even though the IRAC clumps there have a peaked distribution with a characteristic luminosity of L⊙.
We gratefully acknowledge support from NASA JPL/Spitzer grant RSA 1264471 to M.K. and RSA 1264582 to D.M.E. for Cycle 1 observations. We thank Bev Smith for helpful discussions and an anonymous referee for useful comments. Deidre Hunter kindly provided the H image, based on observations at Lowell Observatory.
References
- (1) Baumgardt, H. 1998, A&A, 330, 480
- (2) Calzetti, D. et al. 2005, ApJ, 633, 871
- (3) Churchwell, B.A. et al., 2004, ApJS, 154, 322
- (4) Dale, D.A. et al. 2005, ApJ, 633, 857
- (5) Dale, D.A., & Helou, G. 2002, ApJ, 576, 159
- (6) de Grijs, R., Parmentier, G., & Lamers, H.J.G.L.M. 2005, MNRAS, 364, 1054
- (7) Duc, P.-A., Bournaud, F., & Masset, F. 2004, A&A, 427, 803
- (8) Ebisuzaki, T. et al. 2001, ApJ, 562, L19
- (9) Efremov, Y.N. 1995, AJ, 110, 2757
- (10) Elmegreen, B.G. 1994, ApJ, 433, 39
- (11) Elmegreen, B.G., & Elmegreen, D.M. 1983, MNRAS, 203, 31
- (12) Elmegreen, B.G., Kaufman, M., & Thomasson, M. 1993, ApJ, 412, 90
- (13) Elmegreen, B.G., & Efremov, Y.N. 1997, ApJ, 480, 235
- (14) Elmegreen, B.G., Elmegreen, D.M., Brinks, E., Yuan, C., Kaufman, M., Klari c, M., Montenegro, L., Struck, C., & Thomasson, M. 1998, ApJ, 503, L119
- (15) Elmegreen, B.G., Kaufman, M., Struck, C., Elmegreen, D.M., Brinks, E., Thomasson, M., Klari c, M., Levay, Z.,English, J., Frattare, L. M., Bond, H. E., Christian, C.A., Hamilton, F., & Noll, K. 2000, AJ, 120, 630 (Paper III)
- (16) Elmegreen, B.G., Sundin, M., Kaufman, M., Brinks, E., & Elmegreen, D.M. 1995b, ApJ, 453, 139 (Paper II)
- (17) Elmegreen, B.G., & Elmegreen, D.M. 2001, AJ, 121, 1507
- (18) Elmegreen, D.M., Kaufman, M., Brinks, E., Elmegreen, B.G., & Sundin, M. 1995a, ApJ, 453, 100 (Paper I)
- (19) Elmegreen, D.M., & Salzer, J.J. 1999, AJ, 117, 764
- (20) Elmegreen, D.M., Kaufman, M., Elmegreen, B.G., Brinks, E., Struck, C., Klari c, M., & Thomasson, M. 2001, AJ, 121, 182 (Paper IV)
- (21) Elmegreen, D.M., Sundin, M., Elmegreen, B.G., & Sundelius, B. 1991 A&A, 244, 52
- (22) Engelbracht, C., Gordon, K., Rieke, G., Werner, M., Dale, D., & Latter, W. 2005, ApJ, 628, L29
- (23) Fall, S.M., & Rees, M.J. 1985, ApJ, 298, 18
- (24) Fall, S.M., & Zhang, Q. 2002, in Extragalactic Star Clusters, IAU Symposium 207, eds. D. Geisler, E.K. Grebel, & D. Minniti. San Francisco: Astronomical Society of the Pacific, 566
- (25) Fazio, G.G. et al. 2004, ApJS, 154, 10
- (26) Gordon, K.D. et al. 2004a, ApJS, 154, 215
- (27) Gordon, K.D. et al. 2004b, BAAS, 205, 141
- (28) Haas, M., Klaas, U., & Bianchi, S. 2002, A&A, 385, L23
- (29) Helou, G. et al. 2004, ApJS, 154, 253
- (30) Irwin, J.A. 1994, ApJ, 429, 618
- (31) Jones, T., Woodward, C., Boyer, M., Gehrz, R., & Polomski, E. 2005, ApJ, 620, 731
- (32) Kaufman, M., Brinks, E., Elmegreen, D.M., Thomasson, M., Elmegreen, B.G., Struck, C., & Klaric, M. 1997, AJ, 114, 2323
- (33) Kaufman, M., Brinks, E., Elmegreen, B.G., Elmegreen, D.M., Klaric, M., Struck, C., Thomasson, M., & Vogel, S., 1999, AJ, 118, 1577
- (34) Kaufman, M., Sheth, K., Struck, C., Elmegreen, B G., Thomasson, M., Elmegreen, D.M., Brinks, E. 2002, AJ, 123, 702
- (35) Kaufman, M., Sheth, K., Brinks, E., Struck, C., Elmegreen, B G., Thomasson, M., Elmegreen, D.M. 2005, in preparation
- (36) Kennicutt, R.C. 1998, ARAA, 36, 189
- (37) Kennicutt, R.C., et al. 2003, PASP, 115, 928
- (38) Kennicutt, R.C. 2005, Island Universes: Structure and Evolution of Disk Galaxies, ed. R.S. de Jong (Bonn: Springer), in press
- (39) Kim, W.-T., & Ostriker, E.C. 2002, ApJ, 570, 132
- (40) Kundu, A., Whitmore, B.C., Sparks, W.B., Macchetto, F.D., Zepf, S.E., & Ashman, K.M. 1999, ApJ, 513, 733
- (41) Leitherer, C. et al. 1999, ApJS, 123, 3
- (42) Li, A., & Draine, B.T. 2001, ApJ, 554, 778
- (43) Martini, P., Regan, M.W. Mulchaey, J.S. & Pogge, R.W. 2003, ApJ, 589, 774
- (44) Mirabel, I.F., Dottori, H., & Lutz, D. 1992, A&A, 256, L19
- (45) Montenegro, L., Yuan, C., & Elmegreen, B. G. 1999, ApJ, 520, 592
- (46) Okazaki, T., & Tosa, M. 1995, MNRAS, 274, 48
- (47) Pahre, M.A., Ashby, M.L.N., Fazio, G.G., & Willner, S.P. 2004a, ApJS, 154, 229
- (48) Pahre, M.A., Ashby, M.L.N., Fazio, G.G., & Willner, S.P. 2004b, ApJS, 154, 235
- (49) Parmentier, G., & Gilmore, G. 2005, MNRAS, 363, 326
- (50) Regan, M.W. et al., 2004, ApJS, 154, 204
- (51) Rieke, G.J. et al. 2004, ApJS, 154, 25
- (52) Sajina, A., Lacy, M., & Scott, D. 2005, ApJ, 621, 256
- (53) Smith, B.J. 1994, AJ, 107, 1695
- (54) Smith, B.J., Struck, C., Appleton, P., Charmandaris, V., Reach, W., & Eitter, J. 2005, AJ, 130, 2117
- (55) Struck, C., Kaufman, M., Brinks, E., Thomasson, M., Elmegreen, B., & Elmegreen, D. 2005, MNRAS, 364, 69 (Paper V)
- (56) Sundin, M. 1993, Ph.D. dissertation, Chalmers U. of Technology, Goteburg, Sweden
- (57) Thomasson, M. 2004, ASP Conference: The Neutral ISM in Starburst Galaxies, eds. S. Aalto, S. Huttemeister, & A. Pedlar, 320, 81
- (58) Vesperini, E. 2000a, MNRAS, 318, 841
- (59) Vesperini, E. 2000b, MNRAS, 322, 247
- (60) Vila, M. B., Pedlar, A., Davies, R. D., Hummel, E., & Axon, D. J. 1990, MNRAS, 242, 379
- (61) Wang, Z., Fazio, G.G., Ashby, M.L.N., Huang, J.-S., Pahre, M.A., Smith, H.A., Willner, S.P., Forrest, W.J., Pipher, J.L., & Surace, J.A. 2004, ApJS., 154, 193
- (62) Wetzstein, M., & Burkert, A. 2005, astroph/0510821
- (63) Whitmore, B.C. 2002, in Extragalactic Star Clusters, IAU Symposium 207, ed. D. Geisler, E.K. Grebel, & D. Minniti, San Francisco: Astronomical Society of the Pacific, p.367
- (64) Whitney, B.A., et al. 2004, ApJS, 154, 315
- (65) Willner, S. et al. 2004, ApJS, 154, 222
- (66) Wu, H., Cao, C., Hao, C.-N., Liu, F.-S., Wang, J.-L., Xia, X.-Y., Deng, Z.-G., & Young, C. 2005, ApJL, 632, 79
- (67) Zhang, Q., & Fall, S.M. 1999, ApJ, 527, L81
| Region | S3.6 | S4.5 | S5.8 | S8.0 | S24 | S70 | S160 |
|---|---|---|---|---|---|---|---|
| mJy | mJy | mJy | mJy | mJy | mJy | mJy | |
| IC 2163 eyelidaaIncludes eyelid and all of the region interior. | 88.0 | 59.1 | 177 | 476 | 506 | 5115 | 11000 |
| Feature ibbAll passbands were measured for a box. | 2.8 | 2.5 | 13.2 | 38 | 248 | 1210 | 561 |
| Combined Galaxies | 350 | 174 | 1150 | 1130 | 2000 | 24500 | 40000 |
| No. | RA (J2000) | Dec (J2000) | S3.6 | S4.5 | S5.8 | S8.0 | S24aaPixel sizes for m () and m () emissions are much larger than for the IRAC bands, which are all . A direct comparison of tabulated IRAC and MIPS flux densities, to give colors for example, should not be made. | S70aaPixel sizes for m () and m () emissions are much larger than for the IRAC bands, which are all . A direct comparison of tabulated IRAC and MIPS flux densities, to give colors for example, should not be made. | L(H) |
|---|---|---|---|---|---|---|---|---|---|
| mJy | mJy | mJy | mJy | mJy | mJy | ||||
| IC 2163 eyelid | |||||||||
| 1 | 0.80 | 0.64 | 3.54 | 10.36 | 11.38 | - | 38.9 | ||
| 2 | 1.09 | 0.78 | 3.95 | 11.92 | 9.89 | - | 38.5 | ||
| 3 | 1.05 | 0.80 | 4.33 | 13.48 | 18.53 | - | 39.0 | ||
| 4 | 0.95 | 0.73 | 4.12 | 12.54 | 18.82 | - | 39.6 | ||
| 5 | 0.90 | 0.68 | 2.99 | 8.16 | 16.48 | - | 39.8 | ||
| 6 | 0.48 | 0.36 | 1.62 | 5.47 | 8.35 | - | - | ||
| 8 | 1.16 | 0.81 | 3.61 | 10.25 | 14.67 | - | 39.1 | ||
| 9 | 1.72 | 1.33 | 6.47 | 19.34 | 50.61 | 333.55 | 39.6 | ||
| 10 | 1.46 | 1.13 | 5.14 | 15.03 | 29.80 | - | 39.3 | ||
| 11 | 1.01 | 0.77 | 3.95 | 11.16 | 18.72 | - | 39.5 | ||
| NGC 2207 inner | |||||||||
| 19 | 1.14 | 0.82 | 4.16 | 11.52 | 19.05 | - | 39.8 | ||
| NGC 2207 middle | |||||||||
| 12 | 0.56 | 0.42 | 2.16 | 6.09 | 3.00 | 240.4 | 39.2 | ||
| NGC 2207 outer | |||||||||
| 13 | 0.44 | 0.34 | 1.76 | 4.97 | 11.67 | - | 39.4 | ||
| 14 | 0.69 | 0.52 | 2.61 | 6.91 | - | - | 39.6 | ||
| 15 | 0.30 | 0.28 | 1.76 | 4.69 | 4.80 | - | 39.1 | ||
| 16 | 0.73 | 0.58 | 3.40 | 9.35 | 19.32 | - | 39.6 | ||
| 17 | 0.50 | 0.42 | 2.33 | 6.17 | 11.64 | - | 39.8 | ||
| 18 | 0.80 | 0.64 | 3.48 | 9.79 | 24.41 | - | 39.7 | ||
| 20bbFeature i | 2.70 | 2.46 | 12.16 | 35.09 | 277.48 | 1628.64 | 40.2 |
| ID | RA (J2000) | Dec (J2000) | S3.6 | S4.5 | S5.8 | S8.0 |
|---|---|---|---|---|---|---|
| mJy | mJy | mJy | mJy | |||
| 1 | 28.907 | 0.80 | 0.64 | 3.54 | 10.36 | |
| 2 | 27.825 | 1.09 | 0.78 | 3.95 | 11.92 | |
| 3 | 27.484 | 1.05 | 0.80 | 4.33 | 13.48 | |
| 4 | 27.115 | 0.95 | 0.73 | 4.12 | 12.54 | |
| 5 | 26.633 | 0.90 | 0.68 | 2.99 | 8.16 | |
| 6 | 27.062 | 0.48 | 0.36 | 1.62 | 5.47 | |
| 7 | 26.410 | 0.33 | 0.21 | - | - | |
| 8 | 29.001 | 1.16 | 0.81 | 3.61 | 10.25 | |
| 9 | 28.803 | 1.72 | 1.33 | 6.47 | 19.34 | |
| 10 | 28.151 | 1.46 | 1.13 | 5.14 | 15.03 | |
| 11 | 26.471 | 1.01 | 0.77 | 3.95 | 11.16 | |
| 12 | 16.496 | 0.56 | 0.42 | 2.16 | 6.09 | |
| 13 | 24.883 | 0.44 | 0.34 | 1.76 | 4.97 | |
| 14 | 24.484 | 0.69 | 0.52 | 2.61 | 6.91 | |
| 15 | 23.800 | 0.30 | 0.28 | 1.76 | 4.69 | |
| 16 | 23.091 | 0.73 | 0.58 | 3.40 | 9.35 | |
| 17 | 22.465 | 0.50 | 0.42 | 2.33 | 6.17 | |
| 18 | 18.582 | 0.80 | 0.64 | 3.48 | 9.79 | |
| 19 | 23.421 | 1.14 | 0.82 | 4.16 | 11.52 | |
| 20aaFeature i | 15.900 | 2.70 | 2.46 | 12.16 | 35.09 | |
| 21 | 16.096 | 0.54 | 0.39 | 1.86 | 5.25 | |
| 22 | 16.496 | 0.44 | 0.32 | 1.54 | 4.51 | |
| 23 | 16.320 | 0.22 | 0.17 | 1.04 | 2.93 | |
| 24 | 16.631 | 0.29 | 0.24 | 1.25 | 3.56 | |
| 25 | 17.139 | 0.27 | 0.21 | 1.19 | 3.09 | |
| 26 | 17.594 | 0.54 | 0.38 | 2.08 | 5.65 | |
| 27 | 18.340 | 0.38 | 0.28 | 1.80 | 5.05 | |
| 28 | 18.709 | 0.42 | 0.31 | 1.81 | 5.05 | |
| 29 | 18.709 | 0.48 | 0.33 | 1.63 | 4.93 | |
| 30 | 19.619 | 0.43 | 0.37 | 2.02 | 5.91 | |
| 31 | 20.273 | 0.29 | 0.21 | 1.13 | 3.21 | |
| 32 | 21.529 | 0.46 | 0.29 | 1.42 | 4.76 | |
| 33 | 23.215 | 0.31 | 0.20 | 1.42 | 4.39 | |
| 34 | 24.025 | 0.35 | 0.27 | 1.46 | 3.59 | |
| 35 | 23.683 | 0.23 | 0.17 | 0.62 | 1.32 | |
| 36 | 23.341 | 0.12 | 0.10 | 0.77 | 1.53 | |
| 37 | 25.253 | 0.31 | 0.22 | 1.33 | 3.67 | |
| 38 | 24.002 | 0.42 | 0.32 | 1.27 | 3.50 | |
| 39 | 21.694 | 0.11 | 0.07 | 0.57 | 1.79 | |
| 40 | 21.038 | 0.14 | 0.09 | 0.78 | 2.36 | |
| 41 | 20.639 | 0.15 | 0.11 | 0.82 | 2.29 | |
| 42 | 20.382 | 0.06 | 0.04 | 0.41 | 1.09 | |
| 43 | 19.526 | 0.22 | 0.15 | 0.78 | 2.39 | |
| 44 | 19.211 | 0.32 | 0.22 | 1.16 | 3.32 | |
| 45 | 19.211 | 0.40 | 0.31 | 1.70 | 4.84 | |
| 46 | 19.151 | 0.14 | 0.10 | 0.57 | 1.95 | |
| 47 | 18.607 | 0.19 | 0.13 | 0.85 | 2.26 | |
| 48 | 17.865 | 0.30 | 0.22 | 0.58 | 1.78 | |
| 49 | 17.607 | 0.26 | 0.20 | 1.01 | 2.63 | |
| 50 | 18.118 | 0.24 | 0.18 | 0.82 | 2.56 | |
| 51 | 18.544 | 0.21 | 0.15 | 0.63 | 1.60 | |
| 52 | 21.047 | 0.42 | 0.33 | 0.99 | 2.66 | |
| 53 | 21.872 | 0.42 | 0.26 | 0.75 | 2.68 | |
| 54 | 23.831 | 0.26 | 0.27 | 1.12 | 2.88 | |
| 55 | 23.571 | 0.20 | 0.14 | 0.57 | 1.62 | |
| 56 | 24.112 | 0.22 | 0.15 | 0.75 | 2.08 | |
| 57 | 25.208 | 0.33 | 0.23 | 1.14 | 3.04 | |
| 58 | 25.182 | 0.40 | 0.31 | 1.59 | 4.31 | |
| 59 | 29.363 | 0.68 | 0.50 | 2.28 | 6.67 | |
| 60 | 30.876 | 0.23 | 0.16 | 0.76 | 2.08 | |
| 61 | 31.418 | 0.36 | 0.24 | 0.97 | 2.93 | |
| 62 | 23.844 | 0.21 | 0.14 | 0.75 | 2.01 | |
| 63 | 23.501 | 0.11 | 0.08 | 0.43 | 1.07 | |
| 64 | 30.935 | 0.03 | 0.04 | 0.27 | 0.53 | |
| 65 | 30.625 | 0.00 | 0.00 | 0.02 | 0.07 | |
| 66 | 30.478 | 0.00 | 0.00 | 0.06 | 0.32 | |
| 67 | 29.624 | 0.04 | 0.02 | 0.00 | 0.00 | |
| 68 | 29.854 | 0.04 | 0.08 | 0.51 | 1.38 | |
| 69 | 31.875 | 0.21 | 0.12 | 0.67 | 2.14 | |
| 70 | 32.417 | 0.20 | 0.13 | 0.62 | 1.89 | |
| 71 | 28.998 | 0.00 | 0.00 | 0.00 | 0.00 | |
| 72 | 29.369 | 0.25 | 0.15 | 0.45 | 1.48 | |
| 73 | 28.824 | 0.00 | 0.00 | 0.11 | 0.52 | |
| 74 | 28.397 | 0.00 | 0.00 | 0.35 | 1.60 | |
| 75 | 28.111 | 0.11 | 0.02 | 0.27 | 1.58 | |
| 76 | 28.884 | 0.24 | 0.15 | 0.01 | 0.67 | |
| 77 | 27.459 | 0.00 | 0.00 | 0.00 | 0.00 | |
| 78 | 27.032 | 1.13 | 0.76 | 2.25 | 7.89 | |
| 79 | 27.206 | 0.93 | 0.54 | 1.69 | 5.67 | |
| 80 | 27.892 | 0.96 | 0.67 | 3.67 | 10.93 | |
| 81 | 27.069 | 0.82 | 0.60 | 3.48 | 9.59 | |
| 82 | 31.682 | 0.06 | 0.02 | 0.02 | 0.05 | |
| 83 | 31.197 | 0.07 | 0.05 | 0.10 | 0.29 | |
| 84 | 30.829 | 0.23 | 0.18 | 1.20 | 3.19 | |
| 85 | 33.418 | 0.06 | 0.04 | 0.16 | 0.51 | |
| 86 | 33.934 | 0.13 | 0.09 | 0.50 | 1.26 | |
| 87 | 33.451 | 0.03 | 0.03 | 0.03 | 0.22 | |
| 88 | 33.108 | 0.06 | 0.05 | 0.27 | 0.79 | |
| 89 | 23.489 | 0.54 | 0.41 | 2.03 | 6.01 | |
| 90 | 22.720 | 0.53 | 0.43 | 2.34 | 6.32 | |
| 91 | 18.241 | 0.24 | 0.20 | 1.07 | 2.82 | |
| 92 | 17.776 | 0.16 | 0.12 | 0.80 | 2.23 | |
| 93 | 20.311 | 0.49 | 0.31 | 0.98 | 2.59 | |
| 94 | 20.572 | 0.23 | 0.14 | 0.75 | 2.37 | |
| 95 | 21.002 | 0.09 | 0.07 | 0.28 | 0.88 | |
| 96 | 21.859 | 0.13 | 0.08 | 0.27 | 0.82 | |
| 97 | 22.344 | 0.08 | 0.06 | 0.21 | 0.74 | |
| 98 | 22.431 | 0.08 | 0.06 | 0.17 | 0.63 | |
| 99 | 22.686 | 0.11 | 0.07 | 0.39 | 1.17 | |
| 100 | 22.830 | 0.06 | 0.04 | 0.23 | 0.97 | |
| 101 | 24.899 | 0.35 | 0.26 | 1.10 | 2.95 | |
| 102 | 24.929 | 0.56 | 0.41 | 1.89 | 5.37 | |
| 103 | 24.731 | 0.20 | 0.16 | 0.84 | 2.35 | |
| 104 | 24.932 | 0.59 | 0.40 | 2.12 | 6.30 | |
| 105 | 24.620 | 0.33 | 0.24 | 1.87 | 4.93 | |
| 106 | 25.892 | 0.10 | 0.05 | 0.74 | 2.07 | |
| 107 | 24.889 | 0.07 | 0.05 | 0.22 | 0.66 | |
| 108 | 25.827 | 0.12 | 0.08 | 0.48 | 1.38 | |
| 109 | 25.791 | 0.06 | 0.04 | 0.13 | 0.29 | |
| 100 | 23.036 | 0.05 | 0.03 | 0.15 | 0.32 | |
| 111 | 22.471 | 0.27 | 0.20 | 0.90 | 2.89 | |
| 112 | 23.476 | 0.08 | 0.04 | 0.68 | 1.83 | |
| 113 | 18.484 | 0.17 | 0.10 | 0.17 | 0.77 | |
| 114 | 21.432 | 0.51 | 0.40 | 2.08 | 5.69 | |
| 115 | 19.242 | 0.23 | 0.20 | 0.78 | 1.98 | |
| 116 | 19.015 | 0.16 | 0.11 | 0.66 | 1.70 | |
| 117 | 17.477 | 0.25 | 0.19 | 0.80 | 2.18 | |
| 118 | 17.647 | 0.16 | 0.13 | 0.53 | 1.44 | |
| 119 | 17.249 | 0.14 | 0.10 | 0.60 | 1.46 | |
| 120 | 18.013 | 0.29 | 0.23 | 1.22 | 3.43 | |
| 121 | 15.704 | 0.19 | 0.15 | 0.90 | 2.60 | |
| 122 | 15.649 | 0.10 | 0.09 | 0.54 | 1.61 | |
| 123 | 16.742 | 0.18 | 0.13 | 0.83 | 2.14 | |
| 124 | 16.122 | 0.17 | 0.12 | 0.78 | 1.95 | |
| 125 | 20.578 | 0.13 | 0.10 | 0.49 | 1.31 | |
| 126 | 22.285 | 0.11 | 0.08 | 0.29 | 0.79 | |
| 127 | 26.817 | 0.08 | 0.05 | 0.25 | 0.68 | |
| 128 | 24.251 | 0.09 | 0.06 | 0.00 | 0.00 | |
| 129 | 24.649 | 0.08 | 0.05 | 0.24 | 0.64 | |
| 130 | 24.703 | 0.10 | 0.08 | 0.26 | 0.91 | |
| 131 | 25.044 | 0.16 | 0.10 | 0.03 | 0.03 | |
| 132 | 21.579 | 0.20 | 0.16 | 0.26 | 0.62 | |
| 133 | 23.926 | 0.10 | 0.08 | 0.14 | 0.56 | |
| 134 | 28.593 | 0.06 | 0.12 | 1.19 | 2.93 | |
| 135 | 28.138 | 0.57 | 0.47 | 2.19 | 5.83 | |
| 136 | 25.65 | 0.18 | 0.15 | 0.62 | 1.67 | |
| 137 | 16.073 | 0.65 | 0.40 | 0.62 | 3.29 | |
| 138 | 17.136 | 0.19 | 0.16 | 0.39 | 1.04 | |
| 139 | 17.474 | 0.13 | 0.11 | 0.04 | 0.00 | |
| 140 | 17.618 | 0.12 | 0.08 | 0.40 | 1.05 | |
| 141 | 16.719 | 0.14 | 0.10 | 0.40 | 1.03 | |
| 142 | 25.501 | 0.44 | 0.33 | 0.99 | 0.00 | |
| 143 | 25.240 | 0.21 | 0.13 | 0.50 | 1.83 | |
| 144 | 29.003 | 1.09 | 0.79 | 3.04 | 10.04 | |
| 145 | 28.371 | 0.47 | 0.28 | 1.05 | 1.32 | |
| 146 | 25.727 | 0.13 | 0.10 | 0.30 | 1.02 | |
| 147 | 15.963 | 0.13 | 0.08 | 0.37 | 1.22 | |
| 148 | 16.132 | 0.10 | 0.12 | 0.31 | 0.84 | |
| 149 | 16.016 | 0.06 | 0.03 | 0.09 | 0.28 | |
| 150 | 16.314 | 0.04 | 0.04 | 0.06 | 0.00 | |
| 151 | 20.720 | 0.22 | 0.16 | 0.42 | 1.78 | |
| 152 | 20.420 | 0.71 | 0.48 | 1.30 | 5.24 | |
| 153 | 21.100 | 0.11 | 0.08 | 0.58 | 1.59 | |
| 154 | 20.744 | 0.07 | 0.05 | 0.39 | 1.49 | |
| 155 | 21.099 | 0.11 | 0.06 | 0.02 | 0.00 | |
| 156 | 20.065 | 0.08 | 0.04 | 0.02 | 0.00 | |
| 157 | 20.608 | 0.04 | 0.03 | 0.06 | 0.23 | |
| 158 | 22.106 | 0.05 | 0.04 | 0.05 | 0.32 | |
| 159 | 21.462 | 0.38 | 0.19 | 0.00 | 0.00 | |
| 160 | 33.661 | 0.05 | 0.05 | 0.21 | 0.57 | |
| 161 | 34.047 | 0.11 | 0.07 | 0.16 | 0.37 | |
| 162 | 23.070 | 0.10 | 0.06 | 0.00 | 0.23 | |
| 163 | 22.656 | 0.09 | 0.06 | 0.15 | 0.64 | |
| 164 | 22.911 | 0.10 | 0.06 | 0.21 | 0.57 | |
| 165 | 22.766 | 0.10 | 0.08 | 0.06 | 0.06 | |
| 166 | 26.354 | 0.09 | 0.07 | 0.30 | 0.79 | |
| 167 | 26.566 | 0.02 | 0.00 | 0.05 | 0.28 | |
| 168 | 26.278 | 0.07 | 0.05 | 0.00 | 0.00 | |
| 169 | 26.412 | 0.03 | 0.03 | 0.22 | 0.50 | |
| 170 | 26.611 | 0.00 | 0.00 | 0.00 | 0.00 | |
| 171 | 26.622 | 0.05 | 0.02 | 0.23 | 0.54 | |
| 172 | 26.893 | 0.00 | 0.00 | 0.15 | 0.31 | |
| 173 | 27.136 | 0.02 | 0.02 | 0.07 | 0.33 | |
| 174 | 26.672 | 0.03 | 0.02 | 0.08 | 0.15 | |
| 175 | 26.360 | 0.01 | 0.01 | 0.05 | 0.06 | |
| 176 | 25.716 | 0.06 | 0.04 | 0.12 | 0.51 | |
| 177 | 25.743 | 0.03 | 0.01 | 0.09 | 0.19 | |
| 178 | 25.374 | 0.06 | 0.06 | 0.08 | 0.07 | |
| 179 | 25.668 | 0.05 | 0.03 | 0.10 | 0.41 | |
| 180 | 25.609 | 0.04 | 0.02 | 0.00 | 0.00 | |
| 181 | 24.330 | 0.05 | 0.04 | 0.02 | 0.00 | |
| 182 | 23.469 | 0.14 | 0.09 | 0.23 | 0.78 | |
| 183 | 23.425 | 0.11 | 0.06 | 0.26 | 0.73 | |
| 184 | 23.567 | 0.17 | 0.12 | 0.53 | 1.39 | |
| 185 | 24.400 | 0.06 | 0.04 | 0.10 | 0.29 | |
| 186 | 22.723 | 0.11 | 0.09 | 0.07 | 0.10 | |
| 187 | 24.019 | 0.00 | 0.00 | 0.00 | 0.00 | |
| 188 | 21.135 | 0.08 | 0.06 | 0.28 | 0.61 | |
| 189 | 24.044 | 0.22 | 0.15 | 0.62 | 1.77 | |
| 190 | 23.933 | 0.13 | 0.08 | 0.39 | 1.08 | |
| 191 | 24.274 | 0.07 | 0.07 | 0.31 | 0.75 | |
| 192 | 25.846 | 0.02 | 0.03 | 0.03 | 0.00 | |
| 193 | 25.390 | 0.07 | 0.04 | 0.11 | 0.02 | |
| 194 | 25.413 | 0.05 | 0.05 | 0.18 | 0.56 | |
| 195 | 25.295 | 0.06 | 0.06 | 0.11 | 0.09 | |
| 196 | 21.711 | 0.13 | 0.06 | 0.07 | 0.28 | |
| 197 | 23.236 | 0.05 | 0.04 | 0.09 | 0.28 | |
| 198 | 23.922 | 0.05 | 0.04 | 0.09 | 1.12 | |
| 199 | 26.790 | 0.12 | 0.09 | 0.34 | 0.64 | |
| 200 | 19.993 | 0.06 | 0.05 | 0.22 | 0.62 | |
| 201 | 19.868 | 0.07 | 0.06 | 0.21 | 0.41 | |
| 202 | 18.496 | 0.08 | 0.06 | 0.15 | 0.00 | |
| 203 | 19.468 | 0.08 | 0.05 | 0.00 | 0.05 | |
| 204 | 19.183 | 0.14 | 0.10 | 0.04 | 0.30 | |
| 205 | 18.531 | 0.09 | 0.07 | 0.18 | 0.37 | |
| 206 | 17.107 | 0.06 | 0.03 | 0.15 | 1.62 | |
| 207 | 16.766 | 0.12 | 0.08 | 0.44 | 0.00 | |
| 208 | 16.882 | 0.11 | 0.06 | 0.00 | 0.00 | |
| 209 | 16.643 | 0.18 | 0.10 | 0.03 | 0.00 | |
| 210 | 16.932 | 0.09 | 0.07 | 0.31 | 0.88 | |
| 211 | 17.858 | 0.16 | 0.12 | 0.46 | 1.35 | |
| 212 | 17.109 | 0.14 | 0.12 | 0.21 | 0.59 | |
| 213 | 18.320 | 0.21 | 0.12 | 0.04 | 0.04 | |
| 214 | 18.633 | 0.05 | 0.05 | 0.21 | 0.55 | |
| 215 | 18.947 | 0.04 | 0.04 | 0.15 | 0.26 | |
| 216 | 19.173 | 0.07 | 0.06 | 0.23 | 0.61 | |
| 217 | 20.042 | 0.17 | 0.12 | 0.06 | 0.00 | |
| 218 | 19.550 | 0.06 | 0.06 | 0.05 | 0.06 | |
| 219 | 20.561 | 0.09 | 0.06 | 0.20 | 0.64 | |
| 220 | 23.187 | 0.08 | 0.05 | 0.29 | 1.03 | |
| 221 | 21.508 | 0.12 | 0.09 | 0.53 | 1.25 | |
| 222 | 23.652 | 0.24 | 0.19 | 1.12 | 2.84 | |
| 223 | 26.410 | 1.38 | 0.82 | 0.25 | 0.03 | |
| 224 | 31.657 | 0.05 | 0.04 | 0.00 | 0.00 | |
| 225 | 32.427 | 0.05 | 0.03 | 0.02 | 0.01 |