11email: tigmov@web.am, tigmag@sci.am, elena@bao.sci.am 22institutetext: Centro de Astrofísica da Universidade do Porto, Rua das Estrelas, 4150 – 762 Porto, Portugal
22email: khtig@astro.up.pt 33institutetext: Max-Planck Institut für Astronomie, Königstuhl 17, D-69117 Heidelberg, Germany 44institutetext: Gemini Observatory, 670 N. Aohoku Place, Hilo, HI 96720
44email: caa@gemini.edu,tbeck@gemini.edu 55institutetext: Special Astrophysical Observatory, N.Arkhyz, Karachaevo-Cherkesia, 369167 Russia
55email: moisav@sao.ru 66institutetext: Armagh Observatory, College Hill, Armagh BT61 9DG, Northern Ireland, United Kingdom
66email: mds@arm.ac.uk 77institutetext: Centre for Astrophysics and Planetary Science, University of Kent, CT2 7NR, United Kingdom
An Outbursting Protostar of the FU Orionis type in the Cygnus OB7 Molecular Cloud††thanks: Based on observations collected at the Byurakan Astrophysical Observatory (Armenia), Special Astrophysical Observatory (Russia), German-Spanish Astronomical Centre, Calar Alto, (Spain) operated by the Max-Planck-Institut für Astronomie and on observations obtained at the Gemini Observatory, which is operated by the Association of Universities for Research in Astronomy, Inc., under a cooperative agreement with the NSF on behalf of the Gemini partnership: the NSF (United States), the PPARC (United Kingdom), the NRC (Canada), CONICYT (Chile), the ARC (Australia), CNPq (Brazil) and CONICET (Argentina).
Abstract
Context. To follow the early evolution of stars we need to understand how young stars accrete and eject mass. It is generally assumed that the FU Orionis phenomenon is related to the variations in the disk accretion, but many questions remain still open, in particular because of the rarity of FU Ori type stars.
Aims. We explore here the characteristics of the outburst and of the environment of one new object, discovered recently in the in the active star formation region containing RNO 127, within the Cygnus OB7 dark cloud complex.
Methods. We present an extensive optical and near-infrared study of a new candidate of FU Orionis object, including its direct imaging, spectroscopy and scanning Fabry-Pérot interferometry.
Results. The source, associated with the variable reflection nebula, underwent prodigious outburst. The ”Braid” nebula, which appeared in 2000, as is indicated by its name, consists of two intertwined features, illuminated by the outburst. Subsequent NIR observations revealed the bright source, which was not visible on 2MASS images, and its estimated brightening was more than 4 magnitudes. Optical and infrared spectral data show features, which are necessary for the system to be referred to as a FUor object. The bipolar optical flow directed by the axis of nebula also was found. Various estimates give the November/December 1999 as the most probable date for the eruption.
Key Words.:
ISM – Stars: formation – ISM: jets and outflows – ISM: clouds1 Introduction
| Date (UT) | Band Name | Obs. Mode | Origin | Pixel scale() | Seeing() | Exposure(sec) | |
|---|---|---|---|---|---|---|---|
| 24.Aug.1990 | R | Imaging | POSS-II | 5400Å | 1.00 | 2.0 | 4200 |
| 21.Jun.1999 | Ks | Imaging | 2MASS | 2.17m | 1.00 | 3.5 | 7.8 |
| 22.Aug.2000 | I | Imaging | 2.6m | 8200Å | 0.65 | 2.0 | 600 |
| 09.Dec.2000 | Ks | Imaging | 3.5m | 2.196m | 0.39 | 1.7 | 710 |
| 21.Apr.2001 | I | Imaging | 2.6m | 8200Å | 0.42 | 2.0 | 600 |
| 07.Nov.2001 | V | Imaging | 2.6m | 5300Å | 0.42 | 2.0 | 600 |
| 07.Nov.2001 | R | Imaging | 2.6m | 6400Å | 0.42 | 2.0 | 600 |
| 07.Nov.2001 | I | Imaging | 2.6m | 8200Å | 0.42 | 2.0 | 600 |
| 27.Nov.2002 | H | Fabry-Pérot | 6.0m | 6560Å | 0.56 | 1.0 | 36180 |
| 22.Aug.2003 | K | Imaging | Gemini North | 2.2m | 0.12 | 0.6 | 30 |
| 26.Sep.2003 | - | Spectr. | 2.6m | 3900-7200Å | 0.42 | 1.5 | 4800 |
| 08.Sep.2004 | - | Spectr. | 6.0m | 6100-7200Å | 0.18 | 3.0 | 4200 |
| 06.Sep.2005 | - | Spectr. | IRTF | 1.3-4.1m | 0.15 | 0.8 | 1200 |
There is now strong evidence that the FU Orionis (FUor) outburst phenomenon is closely related to the earliest stages of stellar evolution (Herbig et al. 2003). However, the mechanism by which these eruptions occur is still poorly understood although an integral link to accretion and the circumstellar accretion disk is established (Reipurth & Aspin 2004; Hartmann et al. 2004). It is also clear that the creation of collimated outflows is intimately linked to the presence of accretion disks even though it is not yet understood whether FUor events trigger directed outflows. This link is difficult to establish given the rarity of known ‘classical’ FUors i.e. those that have been observed to display large brightness increases on short timescales coupled with significant changes in spectral characteristics (Herbig 1977). FUors are characterized by sudden brightness increases of 5–6 magnitudes on a timescale of as little as 6 months to as long as 15 years. After the eruption, they start to fade on timescales of many decades to even centuries. Their optical spectra after outburst are composite in that they display A-type stellar features in UV and blue, and F to G-type stellar in red. A very low surface gravity is implied by the optical features present similar to those found in super-giant atmospheres. They typically have a complex H profiles with a P Cygni shape indicating fast outflowing neutral gas with velocities up to 1000 km s-1. In the near-IR their spectrum is dominated by late M-type stellar features, in particular, deep CO band-heads. They are found to be associated with dark cloud complexes and exhibit prominent reflection nebulae.
Several FUor-like objects have recently been discovered e.g. PP13 S (Sandell & Aspin 1998), and NGC 2264 AR 6ab (Aspin & Reipurth 2003). These are termed FUor-like since the original outburst and large brightness increase were not documented. At least some of these FUor-like objects are probably also FUors. Since it is unclear whether all FUor events possess similar characteristics such as, for example, rise and decay timescales, and changes in photometric and spectroscopic signatures, more searches for new FUors are urgently required. In total, 15 FUor-like objects are currently known (Vittone & Errico 2005). Only by quantifying these and other parameters over a statistical sample of objects will enable us to understand the nature of the eruptions and the resultant effects.
We present here an optical and near-infrared (NIR) investigation of a new FUor-like outburst recently discovered in an active star formation region surrounding RNO 127, located in the Cygnus OB7 dark cloud complex (Movsessian et al. 2003) (henceforth MKMSN03). In this region, several new cometary nebulae, Herbig-Haro objects and outflows/jets were found (MKMSN03). The detection of a new NIR reflection nebula in this region immediately brought our attention to the possibility of its creation by a FUor outburst. This nebula, designated ‘IR-Neb’ in MKMSN03, has already been described in detail in that paper. Here, we bring together all available evidence on the nature of the optical and NIR nebulosity and the underlying young star with the aim of determining whether the associated young star has undergone a FUor outburst. Before we can proceed with the description of this object, we have decided to name it based on its physical appearance - the “Braid” nebula. This is to avoid confusion since the nebula was originally detected in the optical and has many similarities with other known nebulae (e.g. Chameleon IR Neb) also called “IR-Neb”.
2 Observations and analysis
Table 1 provides the log of observed and archive data. The first column lists the UT date of the observations, the second column gives the names of the band where applicable, and the third column indicates the observing mode (imaging or spectroscopy). The fourth column lists the origin of the data, the fifth column gives the central wavelength of the band or the spectral range in case of spectroscopy, the sixth column lists the pixel scale of the detector used while the seventh and eighth columns give the seeing and exposure values, respectively.
2.1 Optical investigations
2.1.1 Imaging
Direct optical images of the region containing RNO 127 (RA=21 00 31.8, Decl.=+52 29 17, J2000) were obtained with the 2.6m telescope of the Byurakan Observatory, Armenia, during several epochs starting from August 2000 with the ByuFOSC-2 (Movsessian et al. 2000) camera at prime focus. A Thomson 10601028 CCD detector was used working in ‘half obscured mode’ with a resultant image size of 1060514 pixel (see Movsessian et al. 2000, for mode explanation). The field of view was 11.5′5.5′ at a pixel size of 0.65″. From November 2001 all observations were performed using the multi-mode SCORPIO111It’s brief description can be found via the link http://www.sao.ru/moisav/scorpio/scorpio.html camera with a Lick 20632058 pixel CCD detector. This camera provides a field of view of 14′14′ with 0.42″ pixel-defined resolution.
In addition to our direct imaging at the Byurakan Observatory, we have used the POSS-II222The Second Palomar Observatory Sky Survey (POSS-II) was made by the California Institute of Technology with funds from the National Science Foundation, the National Geographic Society, the Sloan Foundation, the Samuel Oschin Foundation, and the Eastman Kodak Corporation. r-band image of the same region for a comparative study. Details are summarized in Table 1. Data reduction was described in our previous paper (MKMSN03).
2.1.2 Spectroscopy
Long-slit optical spectroscopy of the brightest section of the Braid nebula was performed with the SCORPIO camera, equipped with the same CCD detector as described §2.1.1, on the 2.6m Byurakan Observatory telescope. The disperser employed was a 600 lines/mm grism providing 10Å resolution. The long-slit was 2″ wide and 6′ long oriented EW.
In addition, a spectrum with higher spectral resolution was obtained on the 6m telescope of the Special Astrophysical Observatory (Russia) using a similar SCORPIO device (Afanasiev & Moiseev 2005) equipped with a 20482048 pixel EEV CCD detector. A dispersing holographic grism with 1800 lines/mm was used, which gave a resolution of about 2.5Å in the red spectral range. The same brightest region in the Braid nebula was again observed.
Again dates, spectral range and observing conditions are listed in Table 1. Data reduction was performed in a standard manner using routines written under IDL environment developed by V. Afanasiev (see short description in Afanasiev & Moiseev 2005). The standard star HD217086 was used to calibrate the spectra.
2.1.3 Scanning Fabry-Pérot interferometry
Observations were carried out at the prime focus of the 6m SAO telescope (see Table 1). We used a scanning Fabry-Pérot interferometer (IFP) placed in the parallel telescope beam of the SCORPIO focal reducer. The SCORPIO capabilities in IFP observations are described by Moiseev (2002). The detector was a Tektronix 10241024 pixel CCD array. The observations were performed with 22 pixel binning to reduce the readout time, and so 522 522 pixel images were obtained in each spectral channel. A field-of-view of 4.8′ square was observed with a scale of 0.56″ per pixel. An interference filter with FWHM=15Å centered on the H line was used for pre-monochromatization.
We used a Queensgate ET-50 interferometer operating in the 501st order at the wavelength of H which provided a spectral resolution of FWHM0.8Å (equivalent to 40 kms-1) for a range of =13Å ( 590 km s-1) free from order overlapping. The number of spectral channel images obtained was 36 with the size of a single channel being 0.36Å ( 16 km s-1).
We reduced our interferometric observations by using the IDL-based software developed at the SAO (Moiseev 2002). After the primary data reduction, the subtraction of night-sky lines, and wavelength calibration, the observations were represented by a “data cube” in which each point in the 522522 pixel field contains a 36 channel spectrum. We performed optimal data filtering e.g. Gaussian smoothing over the spectral coordinate with a FWHM=1.5 channels and spatial smoothing by a two-dimensional Gaussian with a FWHM=2–3 pixels. This was achieved using the ADHOC software package333The ADHOC software package was developed by J. Boulestex (Marseilles Observatory) and is publicly available from http://www-obs.cnrs-mrs.fr/adhoc/adhoc.html..
2.2 Near-infrared exploration
2.2.1 Imaging
For the NIR images we first used the Omega Prime (Bizenberger et al. 1998) camera at the Calar Alto 3.5m telescope, Spain (see Table 1). Observations were done using Full MPIA double correlated read mode (see Bizenberger et al. 1998, for full description), which has a minimum detector integration time (DIT) of 1.677 s. By using this method each ‘individual frame’ was constructed from 47 co-added DITs resulting in about 79 s of integration. In this way, 9 frames were taken with a standard 5-point jittering. The data reduction and analysis are described in MKMSN03.
Additional NIR K band images of the Braid nebula were obtained at the “Fredrick C. Gillett” Gemini North Telescope on Mauna Kea, Hawaii (see Table 1). The facility near-IR imager NIRI (Hodapp et al. 2003) was used for the observations with a K-band filter. The total exposure time for the images was 30 seconds. A small dither sequence was applied keeping the IR object on the image in all spatial positions. These images were taken to attempt to see high spatial resolution outflow structure close to the bright IR object and compare the point-spread function of the IR object to that of nearby stellar sources. Since the data were not photometric (due to variable cloud cover), we reduced the image by subtracting adjacent frames with the object located at different positions on the detector. This yielded first-order flat-field corrections and allowed us to study the morphology of the object in detail.
Finally, we utilized the 2MASS Sky Atlas4442MASS Sky Atlas Image obtained as part of the Two Micron All Sky Survey (2MASS), a joint project of the University of Massachusetts and the Infrared Processing and Analysis Center/California Institute of Technology, funded by the National Aeronautics and Space Administration and the National Science Foundation. to study the region at an earlier epoch (see Table 1). The 2MASS images were used to calibrate the Calar Alto NIR images using several 2MASS Point Source Catalog objects in the field. Zero-points (ZP) were determined and magnitudes where assigned for the source using the aperture photometry tool in GAIA (see §3.4 on used apertures).
2.2.2 Spectroscopy
The NIR spectroscopy of the stellar source associated with the nebula was obtained at the NASA Infrared Telescope Facility (IRTF) 3m Observatory on Mauna Kea, Hawaii (Table 1). The facility infrared spectrograph “SpeX” (Rayner et al. 2003) was used in the short and long wavelength cross-dispersed settings for R1400 resolution spectra over the full 1.3 - 4.1 m region. The data were acquired using 7.5″ beam-switched nods (ABBA) along the 15″ slit. We used individual exposure times of 30s and 60s for the short and long wavelength modes, respectively. The nod pattern was repeated multiple times for total on-source integration times of 1200s in each setting. The facility data reduction package “Spextool” (Cushing et al. 2004) was used to combine, extract, telluric correct, merge the cross dispersed orders and clean the spectra for bad pixels. The Hipparchos A0 Star HIP 104127 (Ks=7.51) was used for the telluric correction and flux calibration of the data; the photospheric hydrogen absorption features in this star were removed using the deconvolution technique incorporated into the Spextool package (Vacca et al. 2003).
3 Results
3.1 Optical imaging and photometry
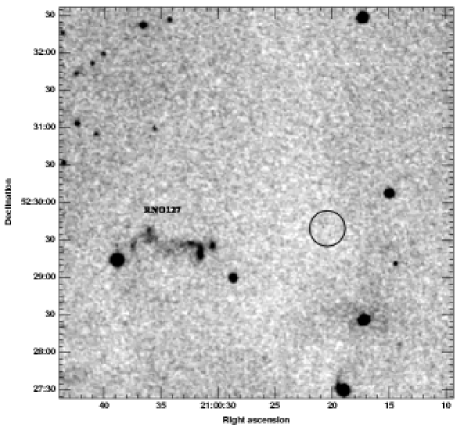
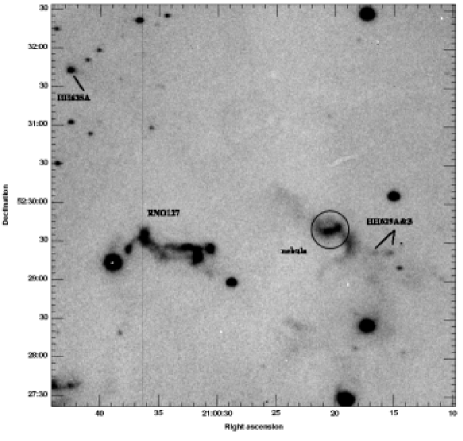
In Fig.1a we show the region of Cygnus OB7 containing RNO 127 and the Braid nebula. This image is from the Digital Sky Survey POSS-II plates and is in the R-band. The plate was taken on 24 August 1990 and does not show any optical nebulosity associated with the Braid nebula. The location of the optical nebula seen in our more recent CCD images is marked in Fig.1a by a black circle. Comparing the POSS-II plate to our R-band CCD image from MKMSN03 (Fig.1b) we see that the optical nebula is, at this time (19 November 2001), well detected. In fact, RNO 127 is visible in both the POSS-II plate and our CCD image (lower-left quadrant) and its detection in both suggests that if the optical nebulosity associated with the Braid nebula was present in 1990 at the same brightness as in 2001, it should have been detected.
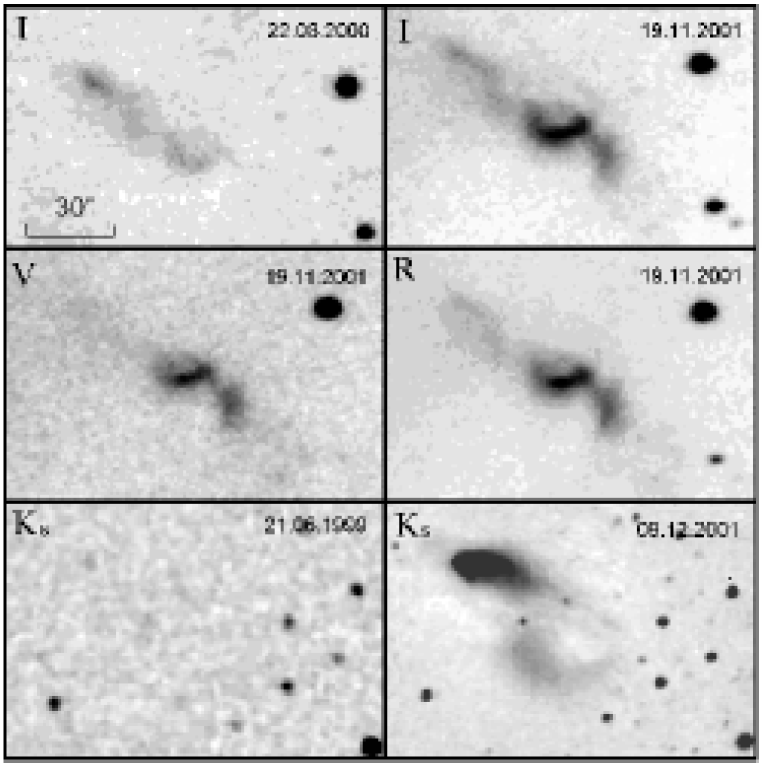
Fig.2 upper and middle panels show the extent of the optical nebulosity in the I, R and V broad bands. Our optical images, shown here and in MKMSN03, clearly show an approximately linear progression of nebulous knots extending from the location of the Braid nebula. Images in the same passbands taken at different epochs after April 2001 do not show any significant changes in the structure of the nebula nor in its brightness. Upon closer inspection, the linear structure resembles a series of curving or possibly helical filaments and, since it is seen in all passbands, it should be mainly of a reflection origin.
We have attempted to estimate the optical colors of the nebula by measuring its surface brightness in the brightest region. Photometry in V, R and I bands was performed for the data obtained in 2002 and 2004, calibrated using the NGC7790 cluster (2002) and M92 cluster (2004). Very similar values were obtained in two epochs, i.e. VR = 1.16; RI = 1.02 in 2002 and VR = 1.21; RI = 1.06 in 2004. This is consistent with there being no major changes in nebula illumination/excitation after the initial brightening and between the two epochs. In principle, these colors could allow us to estimate the spectral type of the illuminating source but since we do not know i) the amount of overlying dust extinction/reddening between the nebula and us (reddening the observed colors), ii) the extinction/reddening between the source and the nebula (again, reddening the observed colors), and iii) the real effect of scattering and emission in the nebula (probably making the observed colors more blue), any estimate is unreliable. We note, however, that the observed colors of the nebula would correspond to a K5–M1 dwarf star.
3.2 Optical spectroscopy


Our low spectral resolution optical spectrum of the brightest knot of the optical nebula has a S/N3 and only an H absorption line can be identified (see Fig.4) in addition to the rising red continuum. This makes the optical spectrum of Braid nebula similar to that of FU Orionis itself (Reipurth et al. 2006) and another known FUor, BBW 76 (Reipurth et al. 2002).
A higher spectral resolution spectrum (Fig.5) confirms the presence of these features in the spectrum of the optical nebulosity. We detect strong and wide ( 600 km s-1) H absorption with a small redshifted emission component. The BaII absorption blend is also present.
One noteworthy point is the asymmetry in the H absorption profile. It is clear that the blue wing of absorption is more extensive than the corresponding red wing. The radial velocity corresponding to the H deepest absorption is km s-1, and its blue wing can be traced out to km s-1. Such a profile is usually considered as evidence of high mass loss in the form of a stellar wind and is a typical characteristic of FUors. The velocity of a probable emission component is low: km s-1 and may correspond to ongoing and active accretion. On the whole, this profile is quite similar to the spectra of classic FUors (Herbig et al. 2003).
3.3 Fabry-Pérot interferometry
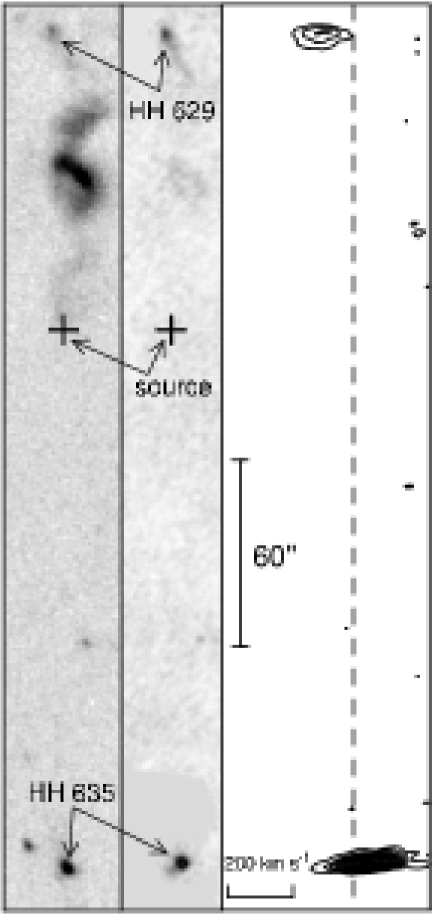
Two HH objects are aligned with the axis of the optical reflection nebula: HH 629 107″ to the south-west and HH 635A 173″ north-east of the Braid nebula (MKMSN03). In [SII] emission, HH 629 is resolved into two close knots, A and B (also identified in Fig.1) while in H it appears more diffuse and extended.
MKMSN03 suggested that HH 629 and HH 635A, as well as several other more distant faint HH objects, are associated with a bipolar outflow driven from the protostar associated with the Braid nebula. This suggestion is supported kinematically by our Fabry-Pérot scanning interferometry of this region. HH 629 has a negative radial velocity of 92 km s-1 while HH 635A has a positive velocity of +38 km s-1. We show in Fig.6 the monochromatic image of the region including the HH objects, which was extracted from the Fabry-Pérot data. The position-velocity diagram along the HH flow, which clearly shows the bipolarity, is also presented in this figure. It should also be noted that the redshifted HH 635A has a significant velocity gradient: its leading edge has a radial velocity of only +16 km s-1 while its trailing edge reaches +73 km s-1. In contrast, HH 629 has no such obvious velocity gradient.
The Fabry-Pérot datacube also confirms that the optical nebula is purely reflective in nature with no trace of any emission lines such as H emission along its extent.
3.4 Near infrared imaging and photometry
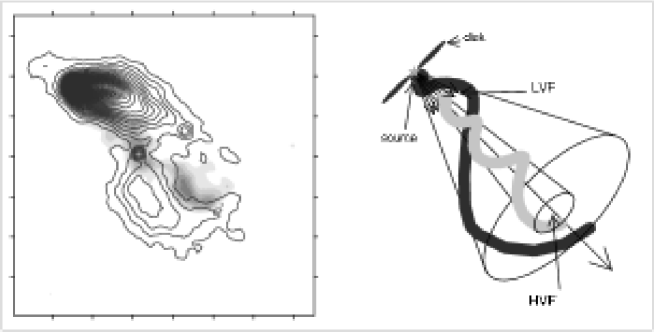
In the NIR Ks band image shown in Fig.2 (lower row, right panel) the source appears dramatically different from the optical. At 2 microns we observe a cometary reflection nebula with a very bright core. The nebula is 1′ in total extent and again exhibits a curving morphology.
Two years earlier, the same region was imaged as part of the 2MASS survey and is displayed in the left panel of the lower row in Fig.2. Clearly, dramatic changes have occurred in the object at NIR wavelengths. We also note that it is possible to discern a faint counter-fan structure, extending to the north-east from the brightest point of the nebula (see lower row, right panel of the Fig.2).
Photometry of the Braid nebula was also performed. In 1999, the object is barely visible and has an mk=15.1 (0.5). In 2001, 17 months later, the object has an mk=10.45 (0.5). Both values were measured in the same elliptical aperture of 4020. Hence, we have observed a near-IR brightening of at least 4 magnitudes.
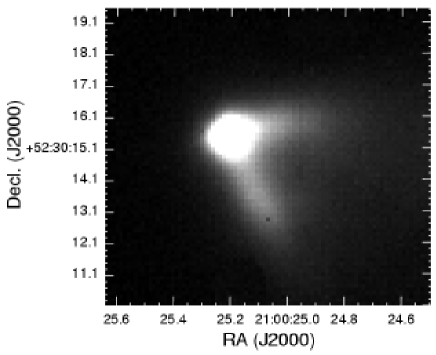
If we look at the star-like object at higher spatial resolution from our Gemini NIRI image (Fig.3), we see that at low contrast the star is resolved into a point-like source with linear extensions protruding to the south-west and west. We interpret this as direct detection of inner regions of the outflow cavity from the young star. The full-width half-maximum (FWHM) of the stellar profile is 0.8″ in this image while other stellar sources in the region have a FWHM of 0.55″.
3.5 Near-infrared spectroscopy
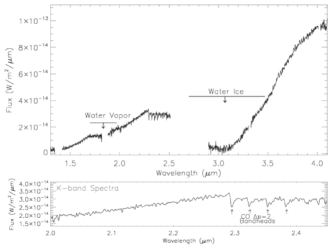
The full 1.3 – 4.1 m spectrum of the NIR point source associated with the nebulosity is displayed in the upper panel of Fig. 7, and a zoomed view of the K-band spectrum (2.0 – 2.45 m) is shown in the lower panel. The spectrum shows steeply rising continuum emission in the 1 – 4 m region. No atomic or molecular absorption features characteristic of the photospheres of young stars are detected, but the shape of the NIR spectrum is affected by absorption features that probably arise from material in a disk. This supports our suggestion from §3.4 that we are not seeing the stellar photosphere even at 2 m. Weak water vapor absorption is detected in the 1.8 – 2.0 m region, and strong CO v=2 bandhead absorption is detected at 2.28 – 2.38 m. Although they are typically found in cool stars with low photospheric temperatures, water vapor features are also seen in the infrared spectra of many FUors (Greene & Lada 1996). Additionally, such deep CO bandhead absorption arises from warm gas in the inner regions of circumstellar disks and is often a characteristic of variable young stars (Reipurth & Aspin 1997). We conclude, therefore, that the emission from the inner regions of the circumstellar disk around this young star probably dominates the flux output in the NIR.
The continuum level of the IR source at wavelengths longward of 2.8 m is strongly affected by the broad water ice absorption centered at 3.05 m. This feature arises from the stretch-mode oscillation of O-H bonds in water molecules that are frozen onto dust grains in interstellar and circumstellar environments (Cohen 1975; Whittet et al. 1988). The shape of the absorption profile is known to be temperature dependent, and a broad, rounded water feature as seen in our spectrum suggests that the ices are in a cold environment with T80K. The water absorption feature seen toward the IR source could arise from: i) - ices on grains in cold material in an extended circumstellar disk or envelope encircling the central star, ii) - from the ambient cloud material, or iii) - from a combination of both. Regardless of the origin of the ice absorption, the presence of the feature reveals that a significant amount of dust and ice obscures our line of sight to the star.
4 Discussion
We conclude that the variable optical nebula is illuminated by the source associated with the bright NIR object. NIR photometry has additionally discovered that the source has undergone an increase in brightness of over 4 magnitudes between pre- and post-outburst phases. We did not directly observe the process of the brightening of the object. Nevertheless, we can obtain an estimate of the time of the outburst using a light propagation method. The length of the optical nebula in April 2001 was 84″ while at the earlier date of August 2000 it was only 61″. After April 2001 (i.e. 19th of November 2001 in Fig.2), there were no further changes in the length of the nebula. This implies that radiation from the illuminating source had already traversed the available physical dust structure. This suggests that the outburst radiation traversed 23″ in less than 200 days. Extrapolating back to the Braid nebula star-like object then indicates that the outburst would have occurred a maximum of an additional 530 days earlier, i.e. in or after January 1999. This implies that the outburst could have occurred before the 2MASS non-detection but, more plausibly, that the radiation traversed the scattering jet structure in considerably less time. Unfortunately we do not have observations between August 2000 and April 2001 to set a more precise time when the propagation terminated.
Another constraint can be placed by assuming that the brightening of the object took place after the 21st of June 1999 (the 2MASS observation date) and that the light-wave travelled the angular distance, , of 61″ in under days. Given a distance D to the Braid nebula, then the inclination angle of the jet structure to the plane of the sky is . In MKMSN03 it is stated that the distance of this star formation complex can be 800 pc although this estimate is rather uncertain. If we assume this distance for the nebula, then either its inclination angle is about 48° (which is definitely too large value) or the outburst took place more recently than the 21st of June 1999 (which is much more probable).
In addition, we can make estimations using the kinematical properties of the bipolar optical HH-flow associated with the Braid nebula. If we assume that the real velocity of the HH outflow is about 300 km s-1 (in accordance with the velocity of the absorption component of the P Cyg type profile of the H line (Fig. 5) and the mean observed absolute value of radial velocity is 70 km s-1, then the angle to the plane of the sky will be only 13°.
Now we can assume that our estimates of the distance and inclination of the Braid nebula do not contradict the available data. In this case, assuming 800 pc and about 20° for these values, one can easily calculate that if in August 2000 the length of the visible nebula was about 61″, the light should have travelled this distance in approximately 290 days, i.e. the outburst most likely occurred in November/December 1999.
An interesting feature of the reflection nebula, already mentioned in MKMSN03, is its quite different appearance in the optical and NIR ranges. Morphologically, both images have some indications of spiral structure but with different opening angle and step (i.e. the physical separation between successive loops). To our best knowledge this is the first such example; however, there are other cases, when we see probable helical arms on the walls of the nebular cones. One of the best illustrations is the RNO 124 nebula (Movsessian et al. 2004), where two helical arms were detected. Among other examples one can remember some evidences of the spiral structure in the famous NGC 2261 nebula (Lightfoot 1989; Close et al. 1997).
It can be suggested that the wider arm of the Braid nebula, seen in NIR, represents the dust illuminated by outer parts of the circumstellar disk, while the narrow one reflects the direct stellar light. Their shape poses another problem. As was already mentioned in §3.4, it is very probable that there exists a cavity near the star (its opening angle is about 60°), created by the outflowing material along the axis of the nebula. If we indeed see two helices enclosing one another, then the pure schematic presentation of this structure can look like in Fig.8. The formation of helical “density waves” on the dust walls can be, perhaps, related with the instabilities on the interface surface between the flow and the surrounding medium. The formation of two helices can be understood if two components with significantly different velocities exist in the outflow; each component would be responsible for the formation of a distinct helix. Of course, these are only the preliminary speculations which need to be tested by modelling and observations.
Another significant point is that the Braid nebula source represents a still rare case of the FUor phenomenon with an optically detected outburst, which also is a source of a bipolar outflow. As in other similar cases: e.g., V346 Nor (Graham & Frogel 1985) and probable FUors Z CMa (Hartmann et al. 1989) and Re 50 (Reipurth 1989), the kinematical age of the outflow (more than 2000 years for the distance between HH 635A and the source) is much greater than the time of the outburst. In fact, the kinematical age can be two times greater if more distant HH 635B and HH 635C also belong to this outflow. This brings two possibilities: either each FUor outburst adds new HH condensations into the flow (thus such outbursts must be recurrent), or these two phenomena are not directly related.
To sum up, it may be said that the brightening of the object together with its optical and NIR spectrum leads to the conclusion that the illuminating star of the Braid nebula could well be another example of the rare class of eruptive objects named FUors.
Acknowledgements.
The authors wish to thank the anonymous referee for comments which substantially improved this manuscript. This work was mainly supported by INTAS grants 00-00287 and 03-51-4838, and by grant of CRDF/NFSAT AS 062-02/CRDF 12009. T.Yu.M. and T.A.M. thank the administration of Gemini Observatory for the support of their visits in 2003 and 2005. We also thank V.Afanasiev for obtaining the spectrum of Braid Nebula with 6m telescope. We would like to acknowledge the data analysis facilities provided by the Starlink Project which is run by CCLRC / Rutherford Appleton Laboratory on behalf of PPARC. In addition, the following Starlink packages have been used: CCDPACK, KAPPA and GAIA.References
- Afanasiev & Moiseev (2005) Afanasiev, V. L. & Moiseev, A. V. 2005, Astronomy Letters, 31, 194
- Aspin & Reipurth (2003) Aspin, C. & Reipurth, B. 2003, AJ, 126, 2936
- Bizenberger et al. (1998) Bizenberger, P., McCaughrean, M. J., Birk, C., Thompson, D., & Storz, C. 1998, in Proc. SPIE Vol. 3354, p. 825-832, Infrared Astronomical Instrumentation, Albert M. Fowler; Ed., 825–832
- Close et al. (1997) Close, L. M., Roddier, F., Hora, J. L., et al. 1997, ApJ, 489, 210
- Cohen (1975) Cohen, M. 1975, MNRAS, 173, 489
- Cushing et al. (2004) Cushing, M. C., Vacca, W. D., & Rayner, J. T. 2004, PASP, 116, 362
- Graham & Frogel (1985) Graham, J. A. & Frogel, J. A. 1985, ApJ, 289, 331
- Greene & Lada (1996) Greene, T. P. & Lada, C. J. 1996, AJ, 112, 2184
- Hartmann et al. (2004) Hartmann, L., Hinkle, K., & Calvet, N. 2004, ApJ, 609, 906
- Hartmann et al. (1989) Hartmann, L., Kenyon, S. J., Hewett, R., et al. 1989, ApJ, 338, 1001
- Herbig (1977) Herbig, G. H. 1977, ApJ, 217, 693
- Herbig et al. (2003) Herbig, G. H., Petrov, P. P., & Duemmler, R. 2003, ApJ, 595, 384
- Hodapp et al. (2003) Hodapp, K. W., Jensen, J. B., Irwin, E. M., et al. 2003, PASP, 115, 1388
- Lightfoot (1989) Lightfoot, J. F. 1989, MNRAS, 239, 665
- Lis et al. (1999) Lis, D. C., Menten, K. M., & Zylka, R. 1999, ApJ, 527, 856
- Moiseev (2002) Moiseev, A. V. 2002, Bull. Special Astrophys. Obs., 54, 74
- Movsessian et al. (2000) Movsessian, T., Boulesteix, J., Gach, J.-L., & Zaratsian, S. 2000, Baltic Astronomy, 9, 652
- Movsessian et al. (2003) Movsessian, T., Khanzadyan, T., Magakian, T., Smith, M. D., & Nikogosian, E. 2003, A&A, 412, 147
- Movsessian et al. (2004) Movsessian, T. A., Magakian, T. Y., Boulesteix, J., & Amram, P. 2004, A&A, 413, 203
- Rayner et al. (2003) Rayner, J. T., Toomey, D. W., Onaka, P. M., et al. 2003, PASP, 115, 362
- Reipurth (1989) Reipurth, B. 1989, A&A, 220, 249
- Reipurth & Aspin (1997) Reipurth, B. & Aspin, C. 1997, AJ, 114, 2700
- Reipurth & Aspin (2004) Reipurth, B. & Aspin, C. 2004, ApJ, 606, L119
- Reipurth et al. (2006) Reipurth, B., Aspin, C., Herbig, G., et al. 2006, in prep.
- Reipurth et al. (2002) Reipurth, B., Hartmann, L., Kenyon, S. J., Smette, A., & Bouchet, P. 2002, AJ, 124, 2194
- Sandell & Aspin (1998) Sandell, G. & Aspin, C. 1998, A&A, 333, 1016
- Vacca et al. (2003) Vacca, W. D., Cushing, M. C., & Rayner, J. T. 2003, PASP, 115, 389
- Vittone & Errico (2005) Vittone, A. A. & Errico, L. 2005, Memorie della Societa Astronomica Italiana, 76, 320
- Whittet et al. (1988) Whittet, D. C. B., Bode, M. F., Longmore, A. J., et al. 1988, MNRAS, 233, 321