11email: [schilke, ccomito, sthorwirth, wyrowski, kmenten, guesten]@mpifr-bonn.mpg.de 22institutetext: European Southern Observatory, Alonso de Cordova 3107, Vitacura, Casilla 19001, Santiago, Chile
22email: [pbergman, lnyman]@eso.org
Submillimeter spectroscopy of southern hot cores:
NGC6334(I) and G327.3-0.6
Abstract
Context. High-mass star-forming regions are known to have a rich molecular spectrum from many species. Some of the very highly excited lines are emitted from very hot and dense gas close to the central object(s).
Aims. The physics and chemistry of the inner cores of two high mass star forming regions, NGC6334(I) and G327.3-0.6, shall be characterized.
Methods. Submillimeter line surveys with the APEX telescope provide spectra which sample many molecular lines at high excitation stages.
Results. Partial spectral surveys were obtained, the lines were identified, physical parameters were determined through fitting of the spectra.
Conclusions. Both sources show similar spectra that are comparable to that of the only other high mass star forming region ever surveyed in this frequency range, Orion-KL, but with an even higher line density. Evidence for very compact, very hot sources is found.
Key Words.:
Astrochemistry, Line: Identification, ISM: Molecules1 Introduction
Unbiased spectral line surveys are a unique way of characterizing astronomical sources. However, they are very time consuming, and the data analysis is not easy, so the number of line surveys has been very limited (see Comito et al. 2005 and references therein), both in numbers of sources (but see MacDonald et al. 1996; Hatchell et al. 1998; Thompson & MacDonald 1999; Thompson & Macdonald 2003) and in frequency range covered. There is only one source for which all sub-THz atmospheric windows have been surveyed from the ground, Orion-KL. However, with the advent of more sensitive instruments with larger bandwidths, and with more sophisticated analysis methods, the situation is slowly changing, and even seemingly unlikely targets such as solar-mass protostars can be targeted (Castets et al. 2005). However, the submillimeter spectral regime, shortward of 800 m, is still relatively unexplored, apart from Orion-KL.
At the location of APEX111This publication is based on data acquired with the Atacama Pathfinder EXperiment (APEX). APEX is a collaboration between the Max-Planck-Institut für Radioastronomie, the European Southern Observatory, and the Onsala Space Observatory. (Güsten et al. 2006, this volume), the site quality is so superior to any other site at which large submillimeter telescopes reside, that exploring the submillimeter regime on a more regular basis has become a possibility. Hence, we have started submillimeter line surveys toward two very promising southern high-mass star forming regions (see Tab. 1 for a description), NGC6334(I) and G327.3-0.6.
| Object | (J2000) | (J2000) | Dist. | Mass | Lum. |
|---|---|---|---|---|---|
| kpc | |||||
| NGC6334(I) | 17:20:53.4 | -35:47:01 | 1.7 | 200 | 2.6 |
| G327.3-0.6 | 15:53:08.8 | -54:37:01 | 2.9 | 500 | 0.5-1.5 |
NGC6334(I) has been the target of a millimeter line survey Thorwirth et al. (2003), which showed a plethora of lines from many molecules. Earlier observations (Bachiller & Cernicharo 1990; McCutcheon et al. 2000) already proved that this source is a chemically rich hot core. G327.3-0.6 had been studied by Bergman (1992), and part of its molecular content has been sampled by Gibb et al. (2000), who found that complex organic molecules are more abundant here than in any other Galactic object, including Orion-KL and SgrB2(N). In this Letter we give a first account of the kind of results one can expect from submillimeter surveys of chemically rich sources. More observations are planned, which will give a more complete census of the molecules present, and will allow a more rigorous determination of the physical parameters.
2 Observations
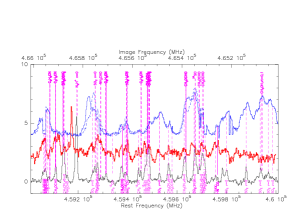
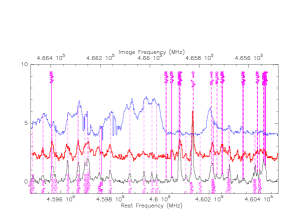
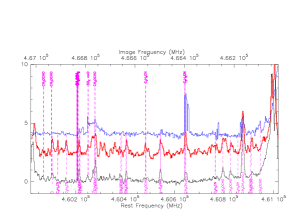
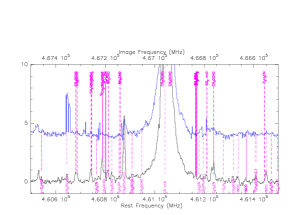
The line survey was started in June 2005, using the FLASH instrument on APEX (Heyminck et al. 2006, this volume) and the FFTS as backend (Klein et al. 2006, this volume). For NGC6334(I), we had both the 460 and the 810 GHz bands available, with beam sizes of 14′′ and 8′′, respectively; for G327.3-0.6, we only took 460 GHz spectra due to technical reasons. Following the recommendations of Comito & Schilke (2002), we sampled the spectra with a redundancy of 2, using irregular sampling, i.e. at 1 GHz bandwidth, the frequency separation between adjacent LO settings was about (but not exactly) 500 MHz. Due to time constraints, only 2.5 GHz in NGC6334(I) was covered in each band, and only 2 GHz in G327.3-0.6 (see Fig. 1 for spectra). Pointing was performed on the continuum of the sources themselves. For G327.3-0.6, this resulted in an offset, because the nominal source position was inaccurate (Wyrowski et al. 2006, this volume), but the pointing procedure ensured that the observations were performed on the true source position.

3 Analysis
The frequency coverage of the dataset is not large enough for sideband deconvolution, so our analysis was carried out on double side band (DSB) spectra. Since the frequency range surveyed is very small, we do not detect lines from all molecules expected to be seen in these source, and for some molecules the lines in our bands are not the best suited for temperature or column density determination. Our physical parameter determinations have therefore to be regarded as preliminary in many cases, and will be superseded once a larger data set is available. Nonetheless, the spectra of some molecules are well sampled, and our dataset allows an assessment of particularly the high excitation regime, which dominate the submillimeter spectra discussed here.
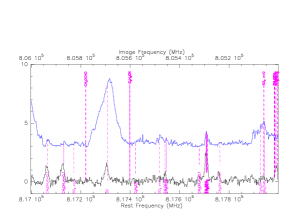
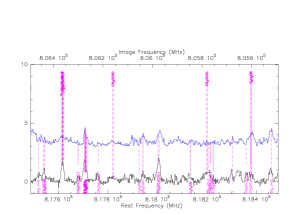
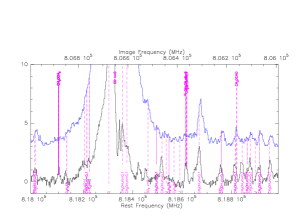
In Fig. 1 we show an overview of the data. For comparison, we have produced DSB spectra with the same LO setting as our data of Orion-KL in the same frequency ranges, using the published SSB survey data of (White et al. 2003) and (Comito et al. 2005) in the 460 GHz and 850 GHz range, respectively. Note that the signal-to-noise ratio of our data matches that of the Orion data, although the Orion lines are a between 10 and 20 times stronger, because Orion at 450 pc is much closer. This is partly due to the better receivers we employ, but mostly reflects the superior site quality.
At first glance, the spectra of NGC6334(I) and G327.3-0.6 look very similar to each other, although the lines of G327.3-0.6 are somewhat broader than the lines toward NGC6334(I). The line density seems to be higher in G327.3-0.6. The spectra measured toward Orion-KL, on the other hand, look very different, as shown particularly in Fig. 1, top panels. Closer inspection reveals that the difference is mostly due to lines of sulphur bearing species, SO and SO2, which are known to be exceptionally strong and wide in this source. Outside of these bands, Orion-KL shows markedly fewer features than the other sources. The absence of N2H+(5–4) in the Orion spectra can be accounted for if we consider the difference in coupling to the beam by the three objects: due to its proximity (450 pc), the angular size of Orion-KL is such that APEX sees mostly the emission from the hot core, whereas toward NGC6334(I) and G327.3-0.6 (1.7 and 2.9 kpc distance, respectively), the more quiescent gas around the hot cores contributes significantly to the emission collected by the APEX beam. However, most of the other lines which are absent in Orion are genuine hot core lines, emphasizing the fact that Orion-KL’s claim to fame is mostly based on its close distance, but not to being truly exceptional. In fact, it is located on the low end of the luminosity and low spectrum of hot cores.
The analysis of the data was carried out with the xclass program (discussed in Comito et al. 2005), which uses molecular data compiled from the CDMS (Müller et al. 2001, 2005) and JPL (Pickett et al. 1998) databases and an LTE model to produce synthetic spectra, which are then compared to the observations. The parameters defining the synthetic spectrum are, for each molecular species: source size (to take beam coupling into account), rotation temperature, column density, velocity width and velocity offset (with respect to the systemic velocity of the object). Several velocity components, which are supposed to be non-interacting (i.e. the intensities add up linearly) can be used, although in the present case we restricted the model to two components, given the small amount of data. The source size is degenerate with temperature in the case of completely optically thick lines, and with column density for completely optically thin lines, in the sense that degenerate parameters cannot be determined independently. The advantages are that, since all species are fitted simultaneously, blending is taken into account, which otherwise presents a severe problem. It is also possible to fit molecules simultaneously with their isotopologues.
Error ranges for the various parameters can be estimated by a analysis, although this can only give errors within the assumptions of the model (finite number of homogeneous components, LTE), but cannot assess errors due to these assumptions. On the other hand, densities in hot cores usually are in a range which makes LTE a reasonable assumption (although this argument is weaker for some of the very high excitation lines present in the spectra, which do require either very high densities or IR pumping to be excited). Most importantly, more sophisticated radiative transfer modeling would suffer from missing collision rates for many of the species present here, and from too many free parameters describing the source structure, which for the cores in question is less well known than for northern, better studied cores.
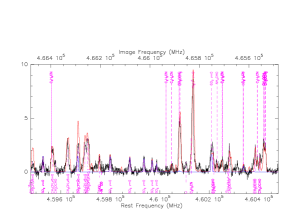
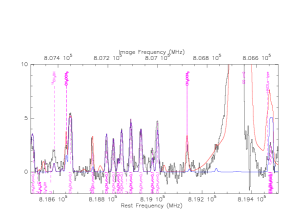
The results in Tab. 2 were derived as follows: the source sizes were determined whenever possible (i.e. when some of the lines were optically thick). In the remaining cases, the source was assumed to be extended, i.e. the beam averaged column density is given. Similarly, we determined a value the temperature whenever possible, otherwise a canonical value of 150 K was assumed, except for N2H+, which is known to be absent in hot gas, and where 50 K were used. Examples of the fits are shown in Fig. 2. Without an error analysis, the results have to be consider preliminary, but a more rigorous treatment of data analysis will be presented once larger ranges have been surveyed.
| Line | Size | (mol) | Comment | ||
| ′′ | K | cm-2 | km s-1 | ||
| NGC6334(I) | |||||
| c-C2H4O | ext | 150 | 4.0 (14) | 3.0 | 1 |
| C2H5CN | ext | 150 | 2.0 (15) | 5.0 | 2 |
| CH3CN | 1.5 | 200 | 1.5 (17) | 4.0 | 3, 4 |
| ext | 50 | 1.0 (15) | 4.0 | ||
| CH3OCH3 | 1.2 | 200 | 2.0 (18) | 3.0 | 4 |
| ext | 50 | 1.5 (16) | 5.0 | ||
| CH3OCHO | 1.5 | 200 | 1.0 (18) | 3.0 | 4 |
| CH3OH | 1.5 | 150 | 5.0 (18) | 3.0 | 4 |
| ext | 50 | 3.0 (16) | 5.0 | ||
| CS | ext | 150 | 2.5 (15) | 3.0 | 1, 5 |
| HNCO | 1.5 | 200 | 5.0 (16) | 5.0 | 1 |
| N2H+ | ext | 50 | 5.0 (13) | 5.0 | 1 |
| NH2CHO | ext | 150 | 1.0 (14) | 3.0 | |
| SO | ext | 150 | 1.0 (15) | 5.0 | 1 |
| SO2 | 1.5 | 150 | 2.0 (17) | 3.0 | 4 |
| G327.3-0.6 | |||||
| c-C2H4O | ext | 150 | 8.0 (14) | 5.0 | 1 |
| C2H5CN | 1.5 | 200 | 3.0 (17) | 3.0 | |
| ext | 50 | 8.0 (15) | 3.0 | ||
| CH3CN | 1.1 | 300 | 5.0 (17) | 4.0 | 3, 4 |
| ext | 50 | 5 (14) | 4.0 | ||
| CH3OCH3 | ext | 200 | 1.0 (16) | 3.0 | 2 |
| CH3OCHO | 1.5 | 150 | 2.0 (18) | 3.0 | 2 |
| CH3OH | ext | 50 | 2.0 (17) | 5.0 | 1 |
| HNCO | ext | 150 | 1.0 (15) | 5.0 | 1 |
| N2H+ | ext | 50 | 3.0 (14) | 5.0 | 1 |
| NH2CHO | ext | 150 | 3.0 (14) | 5.0 | 2 |
| SO2 | 1.0 | 250 | 2.0 (18) | 8.0 | 4 |
| (1) Based on one or a few lines only. | |||||
| (2) Based on weak or partially blended lines only. | |||||
| (3) Includes lines of the vibrationally excited state. | |||||
| (4) Includes optically thick lines. | |||||
| (5) Based on C34S assuming 32S/34S=23. | |||||
4 Discussion
We refrain from providing a list of all identified transitions in the spectra, but discuss each species individually. Lower frequency data of NGC6334(I) were obtained by Nummelin et al. (1998) [N98] and Gibb et al. (2000) [G00].
c-C2H4O
Ethylene oxide was already found by N98 in both sources. We detect only one line, with a lower energy level corresponding to 170 K, thus tracing hotter gas than was traced by N98. Indeed, we are unable to fit our one line with the low excitation temperatures of 38 K or 27 K (for NGC6334(I) and G327.3-0.6, respectively) that N98 derive, so we assume a temperature of 150 K to derive the column density.
CH3CN
For methyl cyanide, we observe enough highly excited lines, including from the vibrationally excited state, to determine source sizes and temperatures quite reliably. This is particularly remarkable in G327.3-0.6, where the ground state lines become very optically thick, and point to a very small, hot central source. The high temperature we derive comes from the need to fit the lines, which are about 900 K above ground, but the exact temperature is difficult to determine, due to the high optical depth even in the state. The evidence for an extended, cooler component in G327.3-0.6 is weak, and is only suggested by an excess emission in the low energy components.
CH3OCH3
Dimethyl ether displays in our frequency range transitions originating from both low and high level energies, the latter particularly in the 810 GHz band toward NGC6334(I). As as the case with methyl cyanide, the temperatures and source sizes are quite well determined, and agree with N98, who also find it necessary to fit two components. In G327.3-0.6, due to the absence of the 810 GHz lines, the source can be modeled by one hot, optically thin component.
CH3OCHO
Methyl formate has mostly highly excited lines in the survey range, so the temperature and size of the compact component are quite well determined in NGC6334(I). N98 do not observe this molecule, so we cannot compare. In G327.3-0.6, the lines tend to be weak and/or blended, so the determination of column densities is not very accurate, but a compact, hot component with many optically thick lines seems likely, in agreement with the results from G00.
CH3OH
Methanol displays a plethora of high-excitation lines at 820 GHz, but only one fairly low-excitation line in the 460 GHz band. Consequently, for NGC6334(I), we can establish the presence of a hot, compact component. N98 also find a hot component, but with a lower temperature than we do. The reason is probably that N98 only had access to lines coming from much lower energies than our survey. In G327.3-0.6, the 460 GHz line is only sensitive to the extended, less excited gas, but does not exclude the existence of a hot, compact component, which in this source has been found by G00.
HNCO
In NGC6334(I), HNCO is observed in the states of the transition. The lines are pumped by FIR radiation at 300 m () and 110 m (), as shown by Churchwell et al. (1986). The lines come from a compact, hot source. In G327.3-0.6, only the line is in the band, making a determination of the temperature impossible.
NH2CHO
Formamide is discovered with some weak, high-excitation lines, and has been modeled as a hot component with no size restriction. G00 find formamide to be emitted by a moderately sized region with a moderate temperature.
SO2
Sulphur dioxide displays lines originating from various, but including very high, excitation levels, particularly traced by the 460 GHz lines. The emission can be modeled as arising from a single compact and hot component, which gives rise to optically thick lines in both sources. In G327.3-0.6, this finding agrees well with G00. In Orion, emission from the sulphur-bearing molecules is dominated by the plateau (outflow) component, but highly excited and vibrationally excited SO and SO2 molecules do show characteristics of the hot core.
U-lines
The number of unidentified (U)-lines we find is low, about 7 out of 245 lines. This is partly due to the fact that, although the survey is quite sensitive, we are not yet confusion-limited in most bands – most unidentified lines are in the lower intensity range. Identification is made difficult by the large frequency errors for many species in the catalogs.
5 Conclusions
In this Letter, we have reported the first attempt to perform a submillimeter line survey shortward of 800 m in a high mass star forming region other than Orion-KL. The results are intriguing: not only is it possible to do these surveys in regions which are between 3 and 6 times more distant than Orion, with similar signal-to-noise ratio, but one does see a higher line density too. Submillimeter observations, since many lines originate from highly excited levels, allow a glimpse into the very heart of the star formation. More systematic, and even higher-frequency observations with Herschel/HIFI, and particularly spatially resolved observations with ALMA will allow a much more detailed picture of these regions, and will determine the shape of the exact surroundings of newly born high-mass stars. Until then, surveys such as the one presented here will be invaluable to study these objects.
Acknowledgements.
We are grateful to the APEX commissioning team. Glenn White very kindly made his line survey available in electronic form. Line survey work would not be possible without the tireless work of the maintainers of molecular databases, particularly CDMS and JPL, and by the numerous spectroscopists providing the input.References
- Bachiller & Cernicharo (1990) Bachiller, R., & Cernicharo, J. 1990, A&A, 239, 276
- Bergman (1992) Bergman, P. 1992, Ph.D. Thesis
- Beuther et al. (2005) Beuther, H., Thorwirth, S., Zhang, Q., Hunter, T. R., Megeath, S. T., Walsh, A. J., & Menten, K. M. 2005, ApJ, 627, 834
- Castets et al. (2005) Castets, A., et al. 2005, ASP Conf. Ser. 344: The Cool Universe: Observing Cosmic Dawn, 344, 212
- Churchwell et al. (1986) Churchwell, E., Wood, D., Myers, P. C., & Myers, R. V. 1986, ApJ, 305, 405
- Comito & Schilke (2002) Comito, C., & Schilke, P. 2002, A&A, 395, 357
- Comito et al. (2005) Comito, C., Schilke, P., Phillips, T. G., Lis, D. C., Motte, F., & Mehringer, D. 2005, ApJS, 156, 127
- Gibb et al. (2000) Gibb, E., Nummelin, A., Irvine, W. M., Whittet, D. C. B., & Bergman, P. 2000, ApJ, 545, 309
- Hatchell et al. (1998) Hatchell, J., Thompson, M. A., Millar, T. J., & MacDonald, G. H. 1998, A&AS, 133, 29
- MacDonald et al. (1996) MacDonald, G. H., Gibb, A. G., Habing, R. J., & Millar, T. J. 1996, A&AS, 119, 333
- McCutcheon et al. (2000) McCutcheon, W. H., Sandell, G., Matthews, H. E., Kuiper, T. B. H., Sutton, E. C., Danchi, W. C., & Sato, T. 2000, MNRAS, 316, 152
- Müller et al. (2005) Müller, H. S. P., Schlöder, F., Stutzki, J. & Winnewisser, G. 2005, J. Mol. Struct. 742, 215
- Müller et al. (2001) Müller, H. S. P., Thorwirth, S, Roth, D.A. & Winnewisser, G. 2001, A&A, 370, L49
- Nummelin et al. (1998) Nummelin, A., Dickens, J. E., Bergman, P., Hjalmarson, A., Irvine, W. M., Ikeda, M., & Ohishi, M. 1998, A&A, 337, 275
- Pickett et al. (1998) Pickett, H. M., Poynter, R. L., Cohen, E. M., Delitsky, L., Pearson, J. C. & Müller, H. S. P. 1998, J. Quant. Spectrosc. & Rad. Transfer 60, 883
- Sandell (2000) Sandell, G. 2000, A&A, 358, 242
- Schilke et al. (1997) Schilke, P., Groesbeck, T. D., Blake, G. A., & Phillips, T. G. 1997, ApJS, 108, 301
- Schilke et al. (2001) Schilke, P., Benford, D. J., Hunter, T. R., Lis, D. C., & Phillips, T. G. 2001, ApJS, 132, 281
- Thompson & MacDonald (1999) Thompson, M. A., & MacDonald, G. H. 1999, A&AS, 135, 531
- Thompson & Macdonald (2003) Thompson, M. A., & Macdonald, G. H. 2003, A&A, 407, 237
- Thorwirth et al. (2003) Thorwirth, S., Winnewisser, G., Megeath, S. T., & Tieftrunk, A. R. 2003, ASP Conf. Ser. 287: Galactic Star Formation Across the Stellar Mass Spectrum, 287, 257
- White et al. (2003) White, G. J., Araki, M., Greaves, J. S., Ohishi, M., & Higginbottom, N. S. 2003, A&A, 407, 589