The distribution of SiO in the circumstellar envelope around IRC +10216
Abstract
New interferometric observations of SiO 5 4 circumstellar line emission around the carbon star IRC+10216, using the Submillimeter Array, are presented. Complemented by multi-transition single-dish observations, including infrared observations of ro-vibrational transitions, detailed radiative transfer modelling suggests that the fractional abundance of SiO in the inner part of the envelope, between 3–8 stellar radii, is as high as 1.5 10-6. This is more than an order of magnitude higher than predicted by equilibrium stellar atmosphere chemistry in a carbon-rich environment and indicative of the importance of non-LTE chemical processes. In addition to the compact component, a spatially more extended ( 2.4 1016 cm) low-fractional-abundance ( 1.7 10-7) region is required to fit the observations. This suggests that the majority of the SiO molecules are effectively accreted onto dust grains in the inner wind while the remaining gas-phase molecules are eventually photodissociated at larger distances. Evidence of departure from a smooth wind is found in the observed visibilities, indicative of density variations of a factor 2 to 5 on an angular scale corresponding to a time scale of about 200 years. Additionally, constraints on the velocity structure of the wind are obtained.
Subject headings:
stars: abundances – stars: AGB and post-AGB – stars: carbon – stars: circumstellar matter – stars: individual (IRC +10216) – stars: mass loss1. Introduction
IRC +10216 (CW Leo) is a cool red giant star located on the asymptotic giant branch (AGB). It is classified as a carbon star (Miller, 1970; Herbig & Zappala, 1970) with a C/O-ratio of 1.4 in its atmosphere (Winters et al., 1994; Glassgold, 1996) and is currently losing mass at a rate of 1–2 10-5 M⊙ yr-1, as determined from a wide variety of observations from infrared to radio wavelengths and using molecular line as well as dust continuum emission (e.g., Keady et al., 1988; Groenewegen et al., 1998; Schöier & Olofsson, 2001; Schöier et al., 2002). It is commonly thought that IRC +10216 is in its last evolutionary stage on the AGB before the planetary nebula ejection phase. The high mass-loss rate of IRC +10216 makes direct observations of the stellar atmosphere difficult, and the future evolution of the star is possibly best followed through monitoring of its circumstellar material, although some stellar light emerges due to the in-homogeneous nature of the wind. Departures from a homogeneous wind are evident from images of interstellar light scattered in the circumstellar envelope (CSE) around IRC +10216 (Mauron & Huggins, 1999, 2000). The high mass-loss rate of IRC +10216, coupled with its close proximity to the Sun ( 120 pc), has made it the prime target for studies of not only carbon stars, but also AGB stars in general.
Presently, there are 63 molecular species detected in AGB stars with about half of them detected in only IRC +10216 (Olofsson, 2006). A significant number of these molecules are unique to the circumstellar medium which makes the study of stellar winds important also for testing our knowledge of interstellar chemistry in general. Most of the abundance estimates are based on rather simple methods and are typically order of magnitude estimates. Detailed chemical modelling of IRC +10216 does a reasonable job in explaining many of the observed abundances (Millar, 2003). However, there are some notable exceptions. The detection of H2O towards IRC +10216 by the SWAS satellite (Melnick et al., 2001), and reconfirmed by Odin observations (Hasegawa et al., 2006), came as a surprise. Recently, Hasegawa et al. (2006) derived an abundance of NH3, based on observations by the Odin satellite, that is four orders of magnitude higher than predicted by stellar equilibrium chemistry (Cherchneff & Barker, 1992), and processing by shocks does not seem to increase the abundance any further (Willacy & Cherchneff, 1998). A possible explanation for these high abundances could be Fischer-Tropsch catalytic processes as suggested by Willacy (2004) or, in the case of H2O, evaporation of Kuiper-belt like objects (Melnick et al., 2001).
The first two more detailed studies of circumstellar abundances in larger samples of sources have been performed by González Delgado et al. (2003) and Schöier et al. (2006) for SiO in 45 M-type (C/O 1 in the photosphere) AGB stars and 19 carbon stars (C/O 1 in the photosphere), respectively. Average SiO fractional abundances were obtained from a detailed radiative transfer analysis of multi-transition single-dish observations. Interestingly, for the M-type AGB stars the derived abundances are generally much lower than expected from photospheric equilibrium chemistry ( 5 10-5, Duari et al. 1999). For the carbon stars, on the other hand, the derived abundances are on the average two orders of magnitude higher than predicted by photospheric equilibrium chemistry ( 5 10-8, Millar 2003). In fact, when comparing the two distributions of SiO fractional abundances there appears to be no way of distinguishing a C-rich chemistry from that of an O-rich based on an estimate of the circumstellar SiO abundance alone. Moreover, there is a clear trend that the SiO fractional abundance decreases as the mass-loss rate of the star increases, as would be the case if SiO is accreted onto dust grains.
Further support for such a scenario comes from interferometric observations of the two M-type AGB stars R Dor and L2 Pup performed by Schöier et al. (2004). In their analysis they found evidence of an inner compact component of high fractional abundance, consistent with predictions from stellar atmosphere chemistry. In addition, an extended low-abundance component, as expected if SiO is effectively depleted onto grains in the inner wind, was required in order to fit the observations.
Presented here are new interferometric observations of SiO = 0, 5 4 line emission from the circumstellar envelope around the carbon star IRC +10216 obtained by the Submillimeter Array (SMA). Supplemented by additional multi-transition single-dish radio and infrared observations the radial abundance profile of SiO is determined. In addition, information on the acceleration region close to the photosphere is obtained.
2. Observations
SMA111The Submillimeter Array is a joint project between the Smithsonian Astrophysical Observatory and the Academia Sinica Institute of Astronomy and Astrophysics, and is funded by the Smithsonian Institution and the Academia Sinica. observations of the SiO 5 4 line at 217.10498 GHz were made on 2005 February 23 using the compact array configuration with seven 6 m antennas. Details of the SMA are described by Ho et al. (2004). The weather was excellent, with a 225 GHz atmospheric opacity of 0.05 (measured at the nearby Caltech Submillimeter Observatory) and system temperatures (DSB) ranging between 150 to 300 K. The projected baselines ranged from k resulting in a synthesized beam of , with a PA of 02 using uniform weighting. The digital correlator has a bandwidth of 2 GHz and the spectral resolution was 0.8125 MHz, corresponding to a velocity resolution of 1.1 km s-1. Phase and amplitude calibration were performed on the quasars 0851+202 and 1058+015. Bandpass calibration was obtained on Callisto and Jupiter. Observations of Callisto provided the flux calibration; the uncertainty of the flux scale is estimated to be 20%. The data were calibrated using the MIR software package developed originally for the Owens Valley Radio Observatory and adapted for the SMA. The calibrated visibility data were imaged and CLEANed using MIRIAD.
The actual analysis and comparison with models are carried out in the -plane to maximize the sensitivity and resolution of the data. Thus, we expect to obtain usable information on scales as low as , corresponding to the longest baselines.
3. SiO brightness distribution
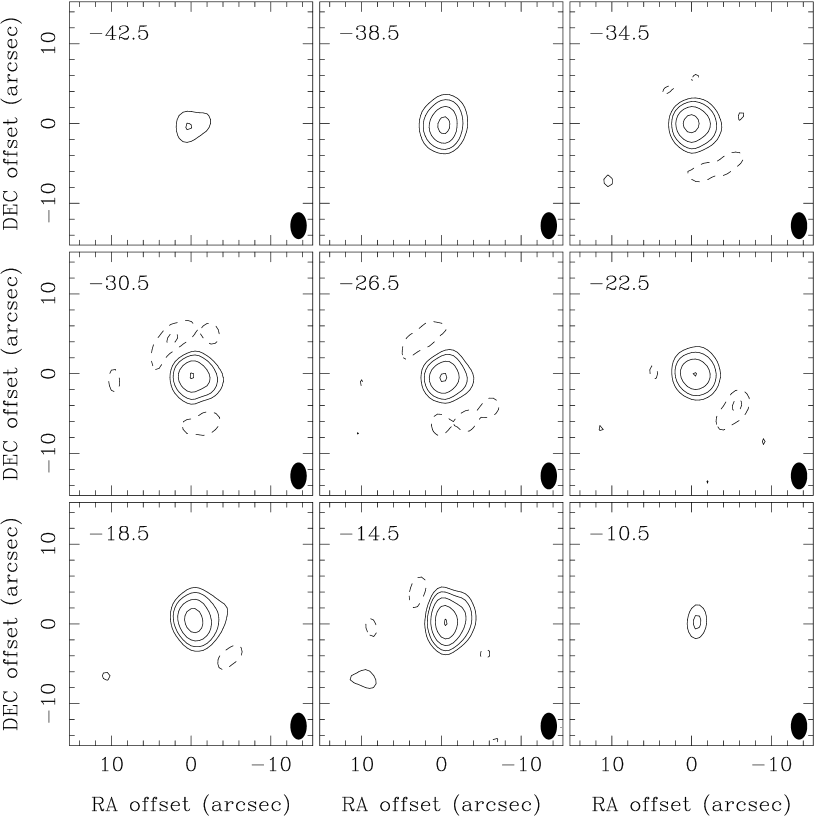
The velocity channel maps of the SiO 5 4 line emission obtained by the SMA, presented in Fig. 1, show that the brightness distribution towards IRC +10216 appears to have an overall circular symmetry and suggests that the emission is moderately resolved. At this level of resolution no signs of deviations from a homogeneous wind such as mass loss modulations or clumps are evident.
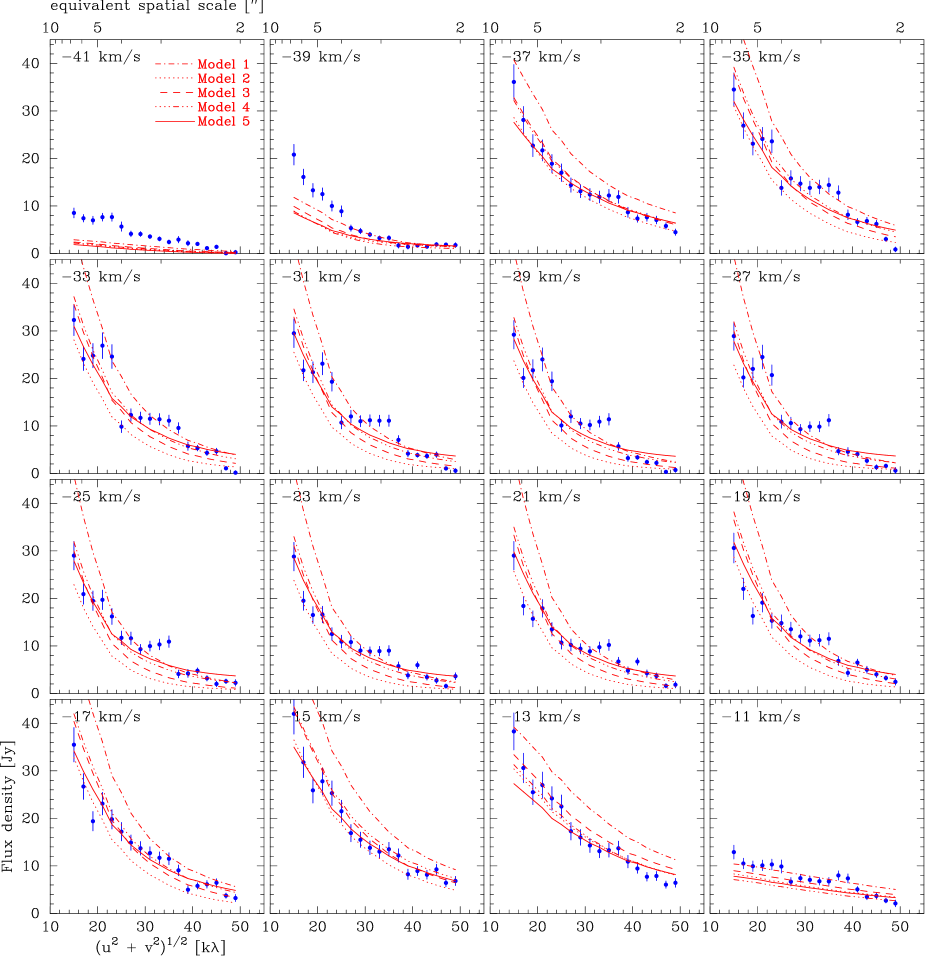
In Fig. 2 the azimuthally-averaged visibility amplitudes, mean value taken over 2 km s-1 bins, are plotted as a function of distance to the phase centre in k. It is evident that there is some degree of patchiness in the distribution. The visibility amplitudes show two regions where the amplitudes flatten out: at around 20 and 32 k. The plateau at 20 k is most evident at the blue-shifted velocities, while the plateau at 32 k is seen at both blue- and red-shifted velocities. At the extreme velocities, these plateau regions are not apparent. The fact that these patterns do not appear constant from velocity channel to velocity channel make us believe that they represent real structure in the SiO brightness distribution. The spatial scales involved are 5 and 3 for the 20 and 32 k plateau regions, respectively. From the radiative transfer modelling performed in Sect. 4.2 the spread in the observed visibilities can be accounted for by SiO abundance modulations of a factor 2–5, or a similar change of the H2 density. Both the time scales, 200 yr, and density modulations are consistent with those obtained from the scattered light images of Mauron & Huggins (1999, 2000).
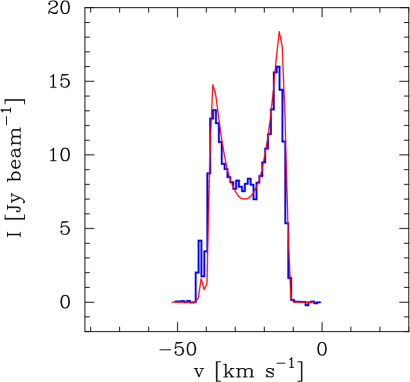
The spectrum at the central pixel in the CLEANed map is presented in Fig. 3 (histogram). The spectrum is characteristic of a well-resolved, with respect to the beam, emitting region of moderate optical depth. Optical depth effects are apparent on the blue-part of the spectrum in Fig. 3 which generally has a lower intensity than the red part due to self-absorption of emission in gas moving towards the observer.
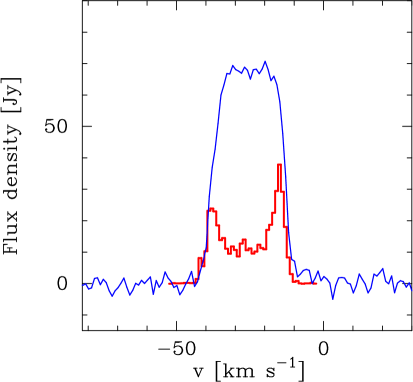
As interferometers lack sensitivity to large scale emission it is of interest to ascertain the missing flux of the SMA data. In Fig. 4 the SMA SiO 5 4 data has been convolved with a circular beam (histogram) to represent the beam of the Swedish-ESO Submillimetre Telescope (SEST). The SEST spectrum has been converted from main beam brightness temperature scale to Jy using
| (1) |
where the main-beam efficiency = 0.5 and the sensitivity = 40 Jy K-1 The telescope parameters are taken from the SEST homepage222www.ls.eso.org/lasilla/Telescopes/SEST/SEST.html. A comparison with the equivalent SEST spectrum from Schöier et al. (2006) (solid line) shows that much of the emission is resolved out by the interferometer. In addition, the CLEANed image of an extended source with missing short-spacing data results in an extended depression of negative surface brightness on which the source emission resides. This artifact is most evident in the central velocity channels in Fig. 1, where the real envelope emission is expected to be the most extended. The negative feature will further reduce the size and flux of the emission in those channels. In the central velocity channels of Fig. 4 only about 10 Jy is recovered after the cleaning compared to 29 Jy that the interferometer actually measures (Fig. 2).
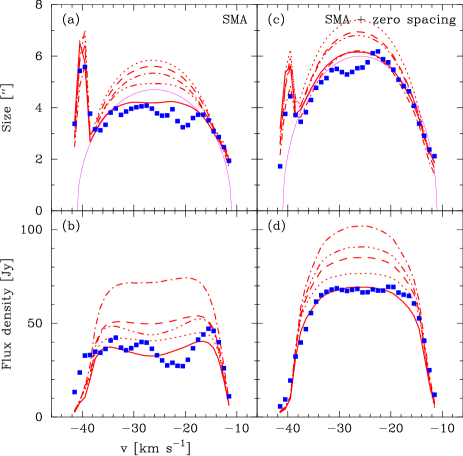
Assuming that the emission has an overall spherical symmetry, circularly symmetric Gaussians have been fitted to the visibilities in 1 km s-1 velocity bins. The resulting FWHMs and fluxes of the circular Gaussians fitted to the visibilities are plotted in Figs. 5a and 5b. There appears to be no systematic trend in the derived offsets with velocity. The flux in each velocity bin is significantly higher than the flux obtained from the full map (Fig. 4; histogram). The estimated flux from the Gaussian fit is, however, the predicted zero-spacing flux based on the observed visibilities. Hence, it tries to compensate for the missing flux in the observations. The fluxes reported in Fig. 5b are lower than the total flux picked up by the SEST single-dish observation (Fig. 4; solid line) indicating a departure of the brightness distribution from that of a Gaussian at larger spatial scales.
The overall variation in size with line-of-sight velocity (Fig. 5a) is not as expected for a well resolved envelope expanding at a constant velocity, where gas moving orthogonal to the line of sight subtends a larger solid angle than radially moving gas near the extreme velocities, as described by
| (2) |
where is the estimated size at velocity , the total size of the emitting region, the systemic velocity (LSR), and the expansion velocity. Using Eq. 2, with = 47, = km s-1 and = 15 km s-1, does not provide an acceptable fit (Fig. 5a; thin solid line). The largest angular extent instead appears close to the blue part of the emission with in the velocity range to km s-1 (LSR). This corresponds to a radial size of cm at a distance of 120 pc (see below). It should be noted that in this region the line profile is heavily affected by self-absorption as seen in Fig. 3.
Self-absorption would naturally explain the larger spatial extent near the blue edge of the spectrum since photons emitted by the gas close to the star, and which in the optically thin case would have no further interaction with the gas, can become absorbed and re-emitted at larger distances from the star thereby increasing the size of the brightness distribution. The lower intensity of the emission naturally follows from the decrease of density and temperature with radial distance from the star.
However, there is some concern that the size-velocity relation in Fig. 5a is affected by the lack of short-spacing information. The predicted zero-spacing flux near the systemic velocity from the Gaussian fits (Fig. 5b) is about a factor of two lower than what is observed using the SEST (Fig. 4; solid line). If instead the flux of the Gaussian fit is fixed at the SEST value (Fig. 5d), a different size-velocity relation is found, as illustrated in Fig. 5c. The observed size-velocity relation is now better described by Eq. 2, in this case with = 60 (thin soild line in Fig. 5c), corresponding to 1.1 1016 cm-1 at the distance of IRC+ 10216. It is noted that the size estimate near the blue edge of the spectrum is still significantly larger than expected from Eq. 2 due to the self-absorption.
4. SiO excitation analysis
4.1. Radiative transfer model
In order to determine the molecular excitation in the CSE a detailed non-LTE radiative transfer code, based on the Monte Carlo method, was used. The code is described in detail in Schöier & Olofsson (2001) and has been benchmarked, to high accuracy, against a wide variety of molecular-line radiative transfer codes in van Zadelhoff et al. (2002) and van der Tak et al. (in prep.). The CSE around IRC+10216 is assumed to be spherically symmetric, produced by a constant mass-loss rate (), and to expand at a constant velocity (). A velocity gradient (acceleration region) is also tested in Sect. 4.3.
The physical properties, such as the density, temperature, and kinematic structure prevailing in the circumstellar envelope around IRC+10216 have been determined in Schöier & Olofsson (2000, 2001), Schöier et al. (2002), and Schöier et al. (2006), based on radiative transfer modelling of multi-transition CO line observations, from millimetre to IR wavelengths. This model, where the circumstellar envelope is formed by a mass-loss rate of 1.5 10-5 M⊙ yr-1 and expanding at a velocity of 14.0 km s-1, is used as input to the SiO excitation analysis.
The excitation analysis includes radiative excitation through the first vibrationally excited ( = 1) state, for SiO at 8 m. Schöier et al. (2006) found that for SiO it is particularly important that this is treated correctly. Relevant molecular data are summarized in Schöier et al. (2005) and are made publicly available through the Leiden Atomic and Molecular Database (LAMDA)333http://www.strw.leidenuniv.nl/moldata. For IRC+10216 thermal dust emission provides the main source of infrared photons which excite the = 1 state. The addition of a dust component in the Monte Carlo scheme is straightforward as described in Schöier et al. (2002). The dust-temperature structure and dust-density profile for IRC+10216 are obtained from radiative transfer modelling of the spectral energy distribution using Dusty (Ivezić & Elitzur, 1997). Details on the dust modelling can be found in Schöier et al. (2006). The best-fit model is obtained for an optical depth at 10 m of 0.9, a dust-condensation temperature of 1200 K ( = 1.7 1014 cm) and an effective stellar temperature of 2000 K. The luminosity is 9600 L⊙, obtained from a period-luminosity relation (Groenewegen & Whitelock, 1996), and the corresponding distance is 120 pc. It should be noted that this period-lumonosity relation was statistically derived for 54 carbon stars with pulsational periods in the range 150 520 days. An additional uncertainty comes from the fact that the period of IRC+10216 is 630 days.
4.2. The SiO abundance distribution
The abundance distribution of SiO is initially assumed to be described by a Gaussian
| (3) |
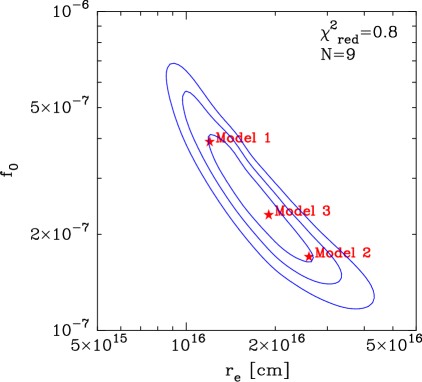
where , i.e., the ratio of the number density of SiO molecules to that of H2 molecules. Here, denotes the photospheric fractional abundance of SiO and it is assumed that some process effectively destroys the molecules at such as, e.g., photodissociation by the ambient interstellar uv-field. Schöier et al. (2006) found that such an abundance distribution could explain multi-transition single-dish radio-line SiO observations of IRC +10216 well, with 1.1 10-7 and 0.7 1016 cm (see Fig. 6).
Fig. 2 shows the result of applying the () sampling of the SMA observations to various SiO envelope models. All models (1–3) are within the 1 confidence level when compared to the constraints put by the single-dish data (see Fig. 6). A model with 3.9 10-7 and 1.2 1016 cm (Model 1; dash-dotted line) provides a poor fit with too much flux on most baselines while a model with 1.7 10-7 and 2.6 1016 cm (Model 2; dotted line) generally has too little flux and gives also a poor fit. However, a model with 2.3 10-7 and 1.9 1016 cm (Model 3; dashed line) provides a better overall fit, illustrating the usefulness of the SMA data in further constraining the SiO abundance distribution. The models are summarized in Table 1.
The models are particularly poor at reproducing the observed visibilities in the most blue-shifted part of the spectrum, between km s-1 to km s-1. This indicates that there is too much self-absorption of the emission in the models. This could possibly indicate that the medium is clumpy to some degree. Nevertheless, the size-velocity behaviour near the blue-shifted edge as seen in Fig. 5 is nicely reproduced by the model and the large observed size is explained by self-absorption in the gas moving towards the observer.
Models with a constant expansion velocity, such as models 1–3, provide poor fits to the observed size-velocity distribution closer to the systemic velocity. The effect of a velocity field in explaining the observed size-velocity distribution and departures from the single Gaussian fractional abundance distribution of SiO are tested in Sect. 4.3, where also additional constraints provided by ro-vibrational transitions in the infrared are used.
a The abundance distribution of SiO is assumed to be a Gaussian described by and (see Eq. 3). is an increased abundance in the inner region of the wind and the slope of the radial velocity gradient (see text for details).
4.3. Probing the inner wind
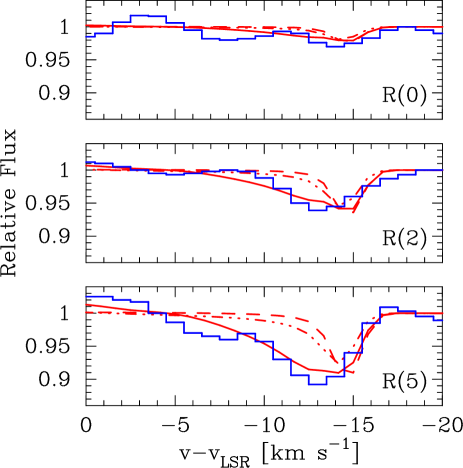
Infrared observations of ro-vibrational transitions have been shown to be a sensitive tool for probing both the physical properties of the inner wind as well as the abundance structure (Keady & Ridgway, 1993; Monnier et al., 2000). However, the only carbon star to have been studied is IRC +10216. Observations of SiO ro-vib transitions ( = 1 0) for IRC +10216 have been performed by Keady & Ridgway (1993). They found that the observed transitions (from (0) up to (5)), exhibiting classical P Cygni-type line profiles, can be reasonably well modelled with an SiO fractional abundance of 8 10-7. Our best-fit single-dish model for IRC +10216, using 2.6 10-7 and 1.7 1016 cm, provides too little flux in these observed ro-vibrational transitions as illustrated in Fig. 7 for the , and transitions (dashed lines; the original data from Keady & Ridgway (1993) are represented by the histograms). In particular the absorption feature produced in the model appears too narrow and is located at a too large velocity. A way to remedy this and fit the data better is to introduce a velocity field, i.e., an acceleration region in the inner envelope. Evidence for an acceleration region also comes from the estimated sizes from Gaussian fits in the -plane (Fig. 5), where the models (), which behave as expected for a resolved wind expanding at a constant velocity, give a poor fit to the size-velocity relation. The observations suggest that parts of the emission arises in the acceleration region.
We find that by adopting a velocity field described by (Habing et al., 1994)
| (4) |
with = 0.5, it is possible to further improve the fit to the observed line shape. Eq. 4 with = 0.5 is valid if the ratio of the dust and gas velocities is constant throughout the wind. When introducing a velocity gradient the density structure will also change according to the continuity equation, keeping the mass-loss rate constant. This has been taken into account in the modelling. All models are required to provide fits also to the single-dish radio-data within the 1 level. In Fig. 7 a model with = 1.7 1014 cm (adopted to coincide with the dust condensation radius, see Schöier et al. (2006)) and 0.5 (Model4; dash-dot-dot-dot line) still does not provide an acceptable fit. Increasing even further, thereby extending the acceleration region, does not improve the fit, and also gives too narrow lines for the single-dish radio-line spectra.
Keeping Eq. 4, with as a free parameter, and fitting it to a dynamical model of IRC +10216 performed by Ramstedt et al. (2006) a value of 0.15 provides a good fit. A lower value for means a smaller acceleration region. We note that Keady et al. (1988) and Keady & Ridgway (1993) derive a more elaborate velocity field that also points to a small acceleration region. However, their results were not based upon any dynamical model. It turns out that a model with a smaller than 0.15 provides a worse fit. The velocity of the wind is within 10% of its terminal value at distances 5 1014 cm.
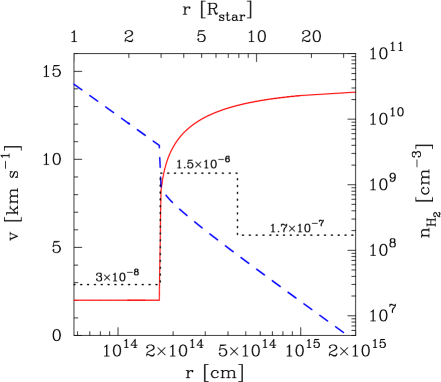
The only way to improve the fit to the observed ro-vibrational transitions is to increase the SiO fractional abundance in the acceleration region. If a model with a compact ( 4.5 1014 cm) high-fractional-abundance ( 1.5 10-6) component is used a much better fit to the data is obtained (Model 5, which includes an extended low abundance component, see below, that does not contribute to the ro-vibrational lines; solid line in Fig. 7). However, the region of high abundance can not be extended all the way down to the photosphere. The velocity field inside the dust condensation radius ( 1.7 1014 cm) is assumed to be 2 km s-1 in accordance with Keady et al. (1988). We emphasize that this is just a test and that the structure of the velocity field close to the photosphere certainly is more complex as shown by Winters et al. (2000). A much lower value of 3.0 10-8 is required in this region otherwise too much absorption will result in the ro-vibrational lines at velocities 2 km s-1. The adopted velocity field, resulting H2 density structure from the continuity equation, and the derived SiO fractional abundance structure are shown in Fig. 8.
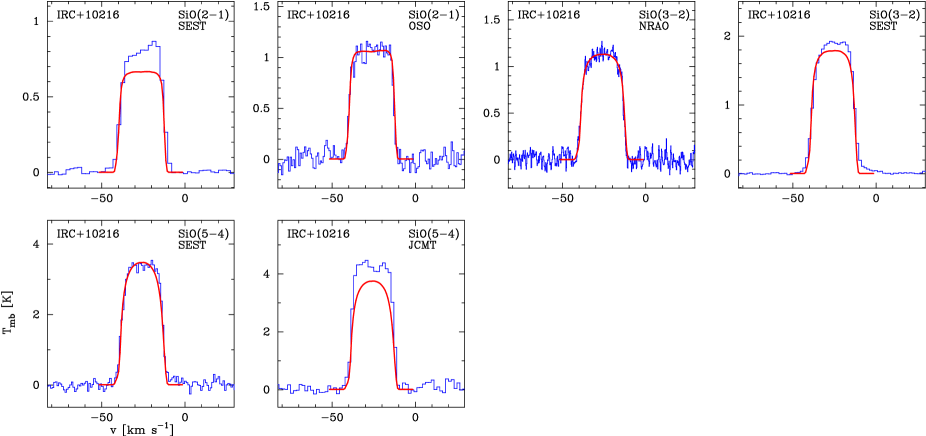
An extended low abundance component is still needed in order to model the single-dish radio data and SMA data. Using 1.7 10-7 and 2.4 1016 cm in addition to the compact component gives a good overall fit to the SMA data (Model 5; solid line), except that the model provides to much self-absorption at the extreme blue-shifted emission. The models are summarized in Table 1. The two-component model provides the best fit to the observed size-velocity relation and the flux density profile as shown in Fig. 5. Fig. 9 shows that the two-component model also fits the available single-dish spectra well, with a reduced of 0.8 (only the total integrated intensity of the line was used for this estimate). Intensities for three additional lines other than the ones shown in Fig. 9 were used in the analysis (see Schöier et al., 2006). Also, the fit to the central pixel spectrum in the CLEANed image is excellent, as shown in Fig. 3.
5. Discussion
LTE stellar atmosphere models predict that the SiO fractional abundance in carbon stars is relatively low, typically 5 10-8 (see reviews by Glassgold, 1999; Millar, 2003, and references therein) about three orders of magnitude lower than in M-type AGB stars. The high SiO fractional abundances, derived in Sect. 4, of 1.5 10-6 in the inner wind ( 38 stellar radii) of IRC +10216 can generally not be explained by LTE chemistry.
Departure from LTE could be caused by the variable nature of AGB stars that induces shocks propagating through the photosphere thereby affecting its chemistry. Models of shocked carbon-rich stellar atmospheres indicate that the SiO fractional abundance can be significantly increased by the passage of periodic shocks (Willacy & Cherchneff, 1998; Helling & Winters, 2001; Cherchneff, 2006) . There is also a strong dependence on the shock strength and possibly this mechanism can explain the observed fractional abundances, and their large spread, of SiO in carbon stars (Schöier et al., 2006). The lack of including absorption of molecules onto dust grains is a shortcoming of current generation chemical models and will be required in a full model describing the chemistry of AGB stars. In addition, grain surfaces could act as catalysts for chemical reactions.
The model that best explains all available observational constraints contains a compact high abundance component in addition to a more extended low-abundance component as illustrated in Sect. 4. This is the same behaviour as observed by Schöier et al. (2004) for the low-mass-loss-rate M-type stars R Dor and L2 Pup. Schöier et al. introduced a compact component ( 1 1015 cm) with a high fractional abundance ( 4 10-5) to explain the small-scale emission. The motivation for this is that SiO is expected to effectively freeze out onto dust grains in the inner envelope. For a high-mass-loss-rate object such as IRC +10216 the freeze out is expected to be very efficient and simple condensation theory (see González Delgado et al. (2003) for details) suggests that the SiO fractional abundance should be significantly affected within 5 10 1014 cm.
We also find evidence for a sharp decline of the SiO fractional abundance close to the photosphere ( 3 stellar radii) from a value of 1.5 10-6 down to 3 10-8. This lower value is consistent with predictions from LTE stellar atmosphere models and could help explain why there are no detections of SiO maser emission in IRC +10216, or any other carbon star, as opposed to M-type AGB stars (e.g., Lepine et al., 1978).
6. Conclusions
Interferometric sub-millimeter SiO 5 4 line observations performed at the SMA are presented for the carbon star IRC+10216. Based on a detailed excitation analysis and additional IR observations, a fractional abundance of SiO in the inner wind of IRC +10216 of more than an order of magnitude higher than predicted by thermal equilibrium chemistry is derived. A possible explanation for the high SiO fractional abundance found is a shock-induced chemistry. However, the influence of dust grains, both as a source for depletion as well as production of SiO, needs to be further investigated. The infrared ro-vibrational data also provide information of the wind dynamics close to the star. The velocity of the wind has reached within 10% of its terminal value already at a distance of 5 1014 cm.
In addition to the compact high abundance component a spatially more extended region with low SiO abundance is needed to explain the observations. We find it likely that the observed abundance distribution around IRC +10216 is the result of SiO depletion in the wind at distances 8 stellar radii. Similar abundance gradients have been reported for two M-type AGB stars by Schöier et al. (2004). High spatial resolution interferometric observations for a larger sample of sources could help to solidify this claim.
Evidence of departure from a smooth wind is found in the observed visibilities indicative of density variations a factor 2 to 5 on time scales of about 200 years, consistent with the density modulations found from scattered light measurements (Mauron & Huggins, 1999, 2000).
References
- Cherchneff (2006) Cherchneff, I. 2006, A&A, in press
- Cherchneff & Barker (1992) Cherchneff, I. & Barker, J. R. 1992, ApJ, 394, 703
- Duari et al. (1999) Duari, D., Cherchneff, I., & Willacy, K. 1999, A&A, 341, L47
- Glassgold (1996) Glassgold, A. E. 1996, ARA&A, 34, 241
- Glassgold (1999) Glassgold, A. E. 1999, in IAU Symp. 191: Asymptotic Giant Branch Stars, 337
- González Delgado et al. (2003) González Delgado, D., Olofsson, H., Kerschbaum, F., et al. 2003, A&A, 411, 123
- Groenewegen et al. (1998) Groenewegen, M. A. T., van der Veen, W. E. C. J., & Matthews, H. E. 1998, A&A, 338, 491
- Groenewegen & Whitelock (1996) Groenewegen, M. A. T. & Whitelock, P. A. 1996, MNRAS, 281, 1347
- Habing et al. (1994) Habing, H. J., Tignon, J., & Tielens, A. G. G. M. 1994, A&A, 286, 523
- Hasegawa et al. (2006) Hasegawa, T., Kwok, S., Koning, N., et al. 2006, ApJ, 637, 791
- Helling & Winters (2001) Helling, C. & Winters, J. M. 2001, A&A, 366, 229
- Herbig & Zappala (1970) Herbig, G. H. & Zappala, R. R. 1970, ApJ, 162, L15
- Ho et al. (2004) Ho, P. T. P., Moran, J. M., & Lo, K. Y. 2004, ApJ, 616, L1
- Ivezić & Elitzur (1997) Ivezić, Ž. & Elitzur, M. 1997, MNRAS, 287, 799
- Keady et al. (1988) Keady, J. J., Hall, D. N. B., & Ridgway, S. T. 1988, ApJ, 326, 832
- Keady & Ridgway (1993) Keady, J. J. & Ridgway, S. T. 1993, ApJ, 406, 199
- Lepine et al. (1978) Lepine, J. R. D., Scalise, E., & Le Squeren, A. M. 1978, ApJ, 225, 869
- Mauron & Huggins (1999) Mauron, N. & Huggins, P. J. 1999, A&A, 349, 203
- Mauron & Huggins (2000) Mauron, N. & Huggins, P. J. 2000, A&A, 359, 707
- Melnick et al. (2001) Melnick, G. J., Neufeld, D. A., Ford, K. E. S., Hollenbach, D. J., & Ashby, M. L. N. 2001, Nature, 412, 160
- Millar (2003) Millar, J. 2003, in Asymptotic giant branch stars, ed. H. J. Habing & H. Olofsson (Astronomy and astrophysics library, New York, Berlin: Springer), 247
- Miller (1970) Miller, J. S. 1970, ApJ, 161, L95
- Monnier et al. (2000) Monnier, J. D., Danchi, W. C., Hale, D. S., Tuthill, P. G., & Townes, C. H. 2000, ApJ, 543, 868
- Olofsson (2006) Olofsson, H. 2006, Reviews of Modern Astronomy, 19, in press
- Ramstedt et al. (2006) Ramstedt, S., Schöier, F. L., & Olofsson, H. 2006, A&A, accepted
- Schöier & Olofsson (2000) Schöier, F. L. & Olofsson, H. 2000, A&A, 359, 586
- Schöier & Olofsson (2001) Schöier, F. L. & Olofsson, H. 2001, A&A, 368, 969
- Schöier et al. (2004) Schöier, F. L., Olofsson, H., Wong, T., Lindqvist, M., & Kerschbaum, F. 2004, A&A, 422, 651
- Schöier et al. (2002) Schöier, F. L., Ryde, N., & Olofsson, H. 2002, A&A, 391, 577
- Schöier et al. (2005) Schöier, F. L., van der Tak, F. F. S., van Dishoeck, E. F., & Black, J. H. 2005, A&A, 432, 369
- Schöier et al. (2006) Schöier, F. L., Olofsson, H., & Lundgren, A. A. 2006, A&A, in press (astro-ph/0604213)
- van Zadelhoff et al. (2002) van Zadelhoff, G.-J., Dullemond, C. P., van der Tak, F. F. S., et al. 2002, A&A, 395, 373
- Willacy (2004) Willacy, K. 2004, ApJ, 600, L87
- Willacy & Cherchneff (1998) Willacy, K. & Cherchneff, I. 1998, A&A, 330, 676
- Winters et al. (1994) Winters, J. M., Dominik, C., & Sedlmayr, E. 1994, A&A, 288, 255
- Winters et al. (2000) Winters, J. M., Keady, J. J., Gauger, A., & Sada, P. V. 2000, A&A, 359, 651