Deep spectroscopy of 9C J1503+4528: a very young CSS radio source at z=0.521
Abstract
9C J1503+4528 is a very young CSS radio galaxy, with an age of order years. This source is therefore an ideal laboratory for the study of the intrinsic host galaxy/IGM properties, interactions between the radio source and surrounding ISM, links between star formation and AGN activity and the radio source triggering mechanism. Here we present the results of a spectroscopic analysis of this source, considering each of these aspects of radio source physics.
We find that shock ionization by the young radio source is important in the central regions of the galaxy on scales similar to that of the radio source itself, whilst evidence for an AGN ionization cone is observed at greater distances. Line and continuum features require the presence of a young stellar population, the best-fit model for which implies an age of years, significantly older than the radio source.
Most interestingly, the relative sizes of radio source and extended emission line region suggest that both AGN and radio source are triggered at approximately the same time.
If both the triggering of the radio source activity and the formation of the young stellar population had the same underlying cause, this source provides a sequence for the events surrounding the triggering process. We propose that the AGN activity in 9C J1503+4528 was caused by a relatively minor interaction, and that a super-massive black hole powering the radio jets must have been in place before the AGN was triggered.
keywords:
galaxies: active – galaxies: evolution – galaxies: ISM – galaxies: stellar content – radio continuum: galaxies – galaxies: individual: 9C J1503+4528Draft version 31 Mar 2005
1 Introduction
The triggering of powerful radio sources is still poorly understood. It is generally thought that some mechanism must channel significant quantities of gas into the central regions of the host to fuel the AGN, wherein a rapidly spinning black hole may power the radio jets (e.g Blandford and Znajek, 1977).
Two scenarios have been proposed. The first is the infall of gas which has cooled in the halo of a galaxy, or a cooling flow in a cluster (Bremer, Fabian & Crawford 1997); this proposition has received much interest recently because it may have a thermostat feedback effect to prevent runaway cooling in clusters (Brüggen and Kaiser 2002, Fabian et al. 2003). However it is most likely that this mechanism in fact causes a renewal of activity in an existing radio source (Nipoti and Binney 2005), rather than being related to the original triggering.
The second is associated with the long-standing idea that a merger between two galaxies, at least one of which is gas rich, is a precursor to AGN activity (e.g. Heckman et al 1986). Wilson and Colbert (1995) suggested that the coalescence of black holes following a major merger creates the necessary rapidly-spinning black hole, which suggests links between radio sources and other merger systems such as ULIRGs, and implies that evidence for young stellar populations and disturbed morphologies should be present at some level in observations of young radio sources.
The merger scenario is supported by an increasing amount of anecdotal evidence. For instance, there are several cases known where the host galaxy of a powerful radio source appears to be undergoing a major merger (e.g., Johnston et al. 2005). Similarly, there is increasing evidence that powerful high-redshift radio galaxies lie in forming clusters (see e.g. Venemans et al. 2005); such environments would be rich in major mergers. This evidence in turn takes us back to the first scenario above; massive cluster galaxies may host a spinning black hole as a relic of their early history, which is generally quiescent but which becomes active when fuelled by cooling gas. It is clearly evident that radio sources play a significant part in hierarchical galaxy and structure formation (e.g. Croton et al 2006), so the precise ingredients for radio source formation are a cause of renewed interest.
In any case, our understanding of this early phase of radio galaxy evolution is hampered by the difficulty of compiling uniform samples of radio sources in the first few millennia of their growth, and indeed the impossibility of pinpointing galaxies immediately prior to this stage. However, it is is now widely accepted that Compact Steep Spectrum (CSS) and some Gigahertz Peaked Spectrum (GPS) radio sources represent the earliest stages of radio source evolution, being the progenitors of the larger FRII source population (e.g. Fanti 1995, Readhead 1996, Snellen et al 2000, Murgia 2003). The study of such sources in the stages immediately after triggering may be a valuable way of elucidating the events that have occurred beforehand.
In an effort to secure a uniform sample of young sources, we have turned to the 9C survey (Waldram et al 2003). This was carried out at 15 GHz with the Ryle Telescope to identify foreground sources for the Very Small Array (VSA) microwave background experiment. Over the past several years, extensive followup of the radio properties of this population has been carried out (Bolton et al 2003, 2004, 2006; Bolton et al submitted), both to understand the effects on microwave background experiments better and to investigate the sources themselves; the high survey frequency has proved a good way of selecting significant numbers of CSS and GPS sources, as well as sources peaking in the GHz range. We are now undertaking optical followup of the CSS and GPS sources, and in this paper we present a detailed spectroscopic study of one of these compact sources, 9C J1503+4528, a classical double FRII radio galaxy at a redshift of with an angular size of .
Details of the observations are presented in section 2, analysis of the emission line strengths and ionization state in section 3, gas kinematics in section 4, emission morphology in section 5 and a discussion of the implications of our results in section 6. We give a summary of our conclusions in section 7.
Values for the cosmological parameters of , and km s are assumed throughout.
2 The Observations
The observed source, 9C1503+4528 (see Fig. 1), was selected as our first target for detailed study for several reasons.
First, the source has a rest-frame 1.4 GHz luminosity of 1.33 W Hz sr-1, well above the FRI/FRII break. Second, the source is resolved, and clearly shows a classical double structure in the radio map presented in Bolton et al. (2004). The angular size of the source is , corresponding to a projected linear size of kpc. It is currently accepted that GPS and CSS sources are at a young stage in the evolution of the radio source (see e.g. Snellen et al 2000). The picture in which sources are young is strongly supported by observations of the hotspot advance speed in many of the most compact sources. These observations find hotspot advance speeds in the range 0.1–0.4 (e.g. Polatidis and Conway 2003; Taylor et al 2000; Owsianik, Conway & Polatidis 1998), which in the case of 9C J1503+4528 implies that the source has an age of order years. This places the source very close to its time of triggering, since the typical lifetime of an FRII source is to years (e.g. Kaiser, Dennett-Thorpe and Alexander 1997). Finally, the source redshift () makes many useful diagnostic lines and the 4000-Å break accessible to moderate-resolution spectroscopy in a wavelength range region relatively clear of night sky emission. With these facts in mind, the young CSS radio source 9C J1503+4528 is therefore a particularly appropriate object for the study of the intrinsic host galaxy/IGM properties, interactions between the radio source and surrounding ISM, links between star formation and AGN activity and the underlying radio source triggering mechanism.
2.1 VLA imaging
The 22-GHz data obtained by Bolton at el. (2004) were re-analysed to obtain the map shown in Fig. 1. Both the central component and the SE compact component are unresolved. The most obvious interpretation of the radio morphology is that the bright central component is the core, with the SE compact component being a hotspot, and the SE and NW extensions being lobes. Given the overall steep spectrum, it is implausible that the source is being viewed at an angle close to the line of sight; in such a case, a strongly boosted flat-spectrum jet component would be expected to dominate in this high-frequency map. We thus conclude that the source has a double-lobed structure with an overall extent of kpc.
2.2 Optical and infrared imaging
An image using the Isaac Newton telescope Wide Field Camera -band filter was taken on the night of 2005 April 11. This filter has the advantage of not including the strong [Oii] and [Oiii] emission lines at the source redshift. Five 600-s images were taken, offset at the centre and corners of a 20′′ pattern, and stacked. The resulting image is shown in Fig. 1.
A -band image was also obtained, on the night of 2006 March 5 using the UFTI instrument at UKIRT. Nine 60-s jittered observations were taken and reduced using the standard orac-dr pipeline; the resulting image is also displayed in Fig. 1. The seeing, measured from an observation of UKIRT standard star P177-D taken immediately after the target observation, was 0.6 arcseconds.
2.3 Optical Spectroscopy
The spectroscopic observations were carried out on 2004 July 18, using the Keck LRIS spectrograph (Oke et al 1995). Seeing was , and a slit was used. The 600/7500 grating was used, providing a wavelength range of Å, a spatial scale of 0.215 arcsec/pixel, a spectral scale of Å/pixel, and a spectral resolution of Å. For an object lying at a redshift of , the corresponding rest-frame spectral range is approximately Å, thereby including emission lines from [Oii]3727Å up to [Oiii]5007Å. Slit PAs of and were chosen, aligning the slit either parallel or perpendicular to the radio source axis. Long-slit spectra were obtained with total integration times of 1800s at each slit PA. The integrations were split into 900-s exposures to aid the removal of cosmic rays.
Standard packages within the NOAO iraf reduction software were used to reduce the raw data. Corrections were made for overscan bias subtraction, and the data were then flat-fielded using internal lamps. The flat fields were taken immediately after each observation of the target, to minimize the effects of fringe drift in the CCD. The two-dimensional frames were wavelength calibrated and corrected for distortions in the spatial direction using wavelength-calibration arc exposures. Taking care not to subtract any of the extended line emission, the sky background was removed. Observations of the smooth-spectrum standard star BD +28 4211 were used to provide accurate flux calibration of the final spectra and to remove the telluric A- and B-band absorption features. The central regions of the parallel and perpendicular spectra effectively probe the same region of the host galaxy. These two spectra were combined in order to produce a higher signal-to-noise spectrum, for use in analysing the emission from the central regions of the radio galaxy.
The resulting parallel and perpendicular 2-d spectra are displayed in Fig. 2. In the parallel spectrum, the presence of narrow emission, extended over a distance of (approximately 10 times larger than the radio source itself) can clearly be seen, in addition to a broader component lying close to the continuum centroid. The [Oii] emission is particularly strong compared to [Oiii], and the continuum emission short of the 4000Å break is also substantially more luminous than would be expected for an old stellar population alone. The perpendicular spectrum displays similar properties, with the exception that extended narrow emission is not observed. A 1-d spectrum extracted from the central 2″ of the combined perpendicular and parallel spectra is displayed in Fig. 3.
Determining the precise systemic redshift of 9C J1503+4528 was complicated by the inherent structure in the emission lines: the redshift implied by the peak of the line emission on the continuum centroid differs substantially from that of the narrow extended component. However, the various absorption features in the spectra (Ca H & K, high-order Balmer lines) all suggest a redshift identical to that determined from the extended narrow component, giving a value of .
3 Emission line fluxes and the ionization state of the gas
One-dimensional spectra were extracted from the parallel, perpendicular and combined 2-d frames. The extractions were carried out over (kpc) for the parallel, perpendicular and combined frames, and additionally over (kpc) for the parallel and perpendicular frames. The lines were then fitted by gaussians; the resulting fluxes and equivalent widths are presented in Appendix A.
Spectra were also extracted in steps across the slit, in order to investigate the changing ionization state of the emission line gas with position via ionization state diagnostic diagrams (Baldwin, Phillips & Terlevich 1981). For an effective analysis, model predictions should be well separated and results should be consistent over several different diagrams/line combinations. Line pairs should ideally be close in wavelength and of the same species, to limit the effects of reddening and variations in gas composition. The most appropriate lines available from our optical spectra are [Oii]3727Å, [Oiii]4363Å, H and [Oiii]5007Å.
Figure 4 displays the diagnostic diagram for the line pairs [Oii]3727Å/H and [Oiii]5007Å/H, extracted from the parallel spectra in 0.5′′ steps, together with various theoretical model tracks. These include: (i) the shock models of Dopita & Sutherland (1996), which also incorporate the effects of a precursor ionization field, (ii) the mixed medium (matter bounded vs. ionization bounded) photoionization tracks of Binette et al (1996), plus (iii) simple AGN photoionization tracks (Groves et al 2004a, 2004b), also incorporating the effects of dust. The photoionization models displayed are for solar metallicity and a density of . For reference, the photoionization tracks display little variation for lower values of , while the track is shifted to smaller values of log([Oii]/H) by dex. The metallicity tracks are generally similar to those of solar metallicity, whereas lower tracks are shifted to smaller values of both log([Oii]/H) and log([Oiii]/H).
This diagram clearly shows the changing ionization state relative to distance from the nucleus. The spectra extracted from the central regions of the host galaxy lie close to the predictions of the shock ionization models (and also the far end of the mixed medium ionization track). At intermediate distances (, i.e. sampling emission from just outside the radio source), the shock plus precursor photoionization models are most suited. Beyond 1-1.5′′ (i.e. the extended narrow emission region), the data are well described by simple AGN photoionization. High values of the ionization parameter, , are the most plausible, and a dusty medium is favoured. For the photoionized gas, the ionization state at larger radii suggests either a lower spectral index ( rather than ), higher gas density or lower metallicity. The mixed medium models of Binette et al only provide a good explanation for a few of the data points, and it seems unlikely that this system can be well described using that particular model. The observed line ratios are not likely to be affected by internal reddening, as the Balmer line ratios in our spectra are in good agreement with the predictions of case B recombination. Balmer line absorption could potentially have some influence on the exact positioning of the data points in this figure; while we believe we have correctly accounted for the errors on our measurement of H-, additional shifts of up to 0.2dex towards smaller line ratios cannot be completely ruled out. However, this would not have any effect on our overall interpretation of the data.
The picture provided by these results is as follows. The UV continuum emission from the AGN ionizes the gas at all locations within the ionization cone, decreasing in intensity at larger distances. The innermost regions of the galaxy, of order the same size as the fledgling radio source, have an additional ionization contribution from shocks. The UV radiation field produced by these shocks adds another ionization component to the emission from gas at intermediate distances.
The relative ionization states of the parallel and perpendicular spectra can be compared in Fig. 5. This figure displays the same tracks as in Fig. 4, for spectra extracted from various regions of our 2-d spectra. These include the central regions of the combined, parallel and perpendicular spectra. The results for the central 1-2′′ should not be greatly different, as both spectra sample essentially the same region. However, the impact of AGN and shock ionization will be greatly lessened at larger distances, for material which lies off the radio source axis and well outside the ionization cone of the AGN. Also displayed are the observed emission line ratios for spectra extracted at distances from the continuum centroid of to and to , for both the parallel and perpendicular spectra. The large errors on the data points for the extended regions of the perpendicular spectra reflect the very weak line emission present at these distances. In the case of the to data point, shocks are not a plausible option, and the data should lie outside the ionization cone of the AGN. Instead, the position of this data point suggests that ionization by young, hot stars may provide a better explanation (see e.g. Kewley, Geller & Jansen (2004) and Rola, Terlevich & Terlevich (1997) for appropriate locations on the [Oii]/H vs. [Oiii]/H diagnostic plot for Hii regions; such emission line ratios would generally be expected to lie towards the lower left quadrant of Fig. 5). A combination of ionization by young stars and the AGN could also be relevant for the and data points on Fig. 4.
Figure 6 shows the diagnostic diagram for the [Oiii]5007Å/[Oiii]4363Å and [Oii]3727Å/[Oiii]5007Å line ratios, together with the observed data from our parallel spectra in spatial steps of . Note that the mixed medium model track, which bent towards the data points at low values of 222The solid-angle ratio of matter-bounded to ionization-bounded material in the mixed-medium model of Binette et al 1996. in Fig. 4, tends towards higher values of [Oiii]5007Å/[Oiii]4363Å on Fig. 6 as opposed to the lower values of this line ratio observed in the data. Although the error bars are large for the [Oiii]5007Å/[Oiii]4363Å line ratio, we nevertheless have a certain amount of consistency with the previous diagnostic diagrams: once again the central regions of the galaxy favour the predictions of shocks, while more distant locations lie closer to the dusty AGN photoionization tracks. The relatively low [Oiii]5007Å/[Oiii]4363Å ratio is indicative of high temperatures and/or densities in the emitting gas, of the order of several K in the low density limit (e.g. Osterbrock 1989), fully consistent with the presence of shocks in these regions.
4 Gas Kinematics
We have also investigated the changing gas kinematics, via an analysis of the profiles of the [Oii]3727Å and [Oiii] (4959+5007Å) lines. Two-dimensional regions around each of these emission lines were extracted, and from these a sequence of one-dimensional spectra were extracted along the slit direction, stepped every 0.5′′.
After allowing for continuum subtraction, the data were fitted by up to three successive gaussian components, which were only accepted if their FWHM was larger than the instrumental resolution and the signal-to-noise ratio was greater than approximately five (excepting the outermost spectra, for which a fainter, single gaussian component could be detected at a lower signal-to-noise.) The combination of gaussians with the lowest reduced were then taken to be the maximum number of velocity components which could be fitted to the data (we also fixed the relative positions and strengths of the 4959Å and 5007Å lines). Example fits are displayed in Fig. 7.


The integrated line flux, the velocity relative to that at the centre of the galaxy, and the emission line FWHM were determined for each gaussian fit. We calculated the FWHM by subtracting in quadrature the instrumental FWHM, as determined from unblended sky lines. We then calculated errors for these three parameters, allowing for the fact that a range of possible fits are equally acceptable at low S/N. This approach allows us to search for high velocity components in the emission line gas, or other structures incompatible with a fit to a single velocity component. Given the observed emission line profile of this source, such a step was a necessity, and broader emission line components are clearly present in the central parts of the extended emission line region.
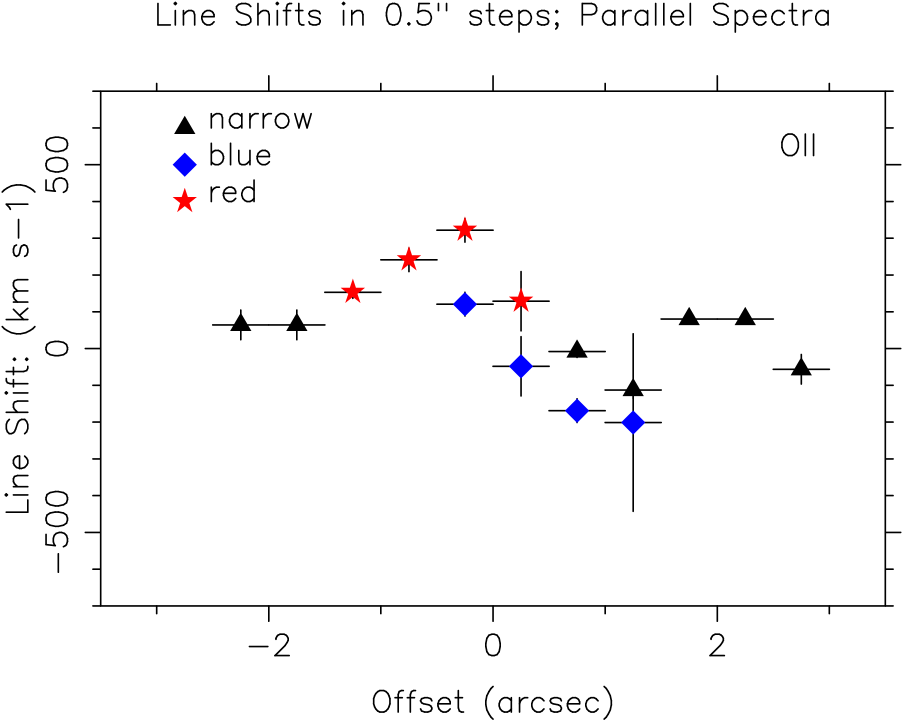
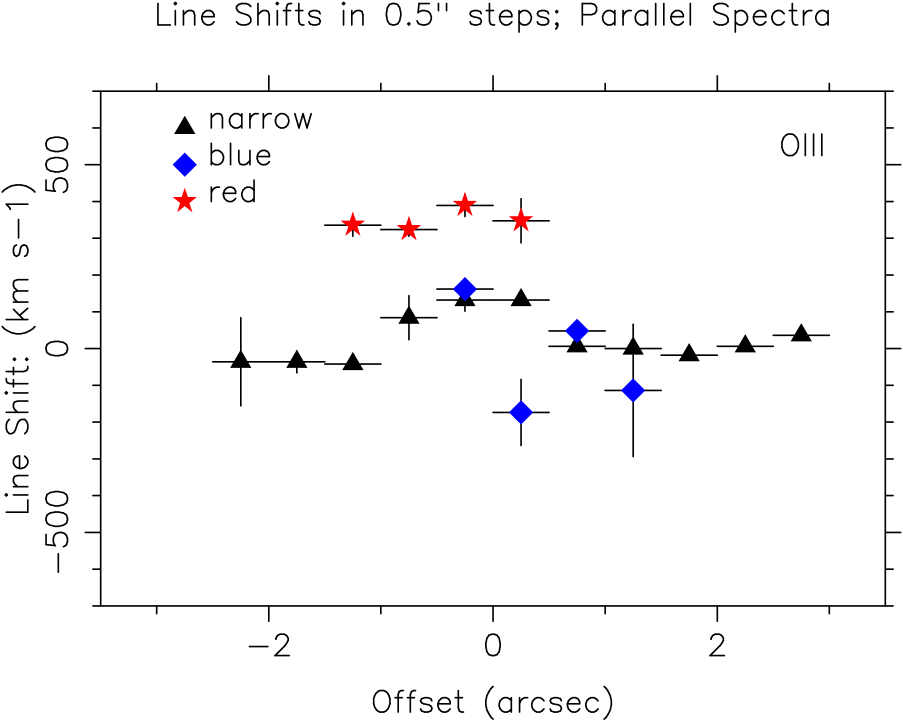
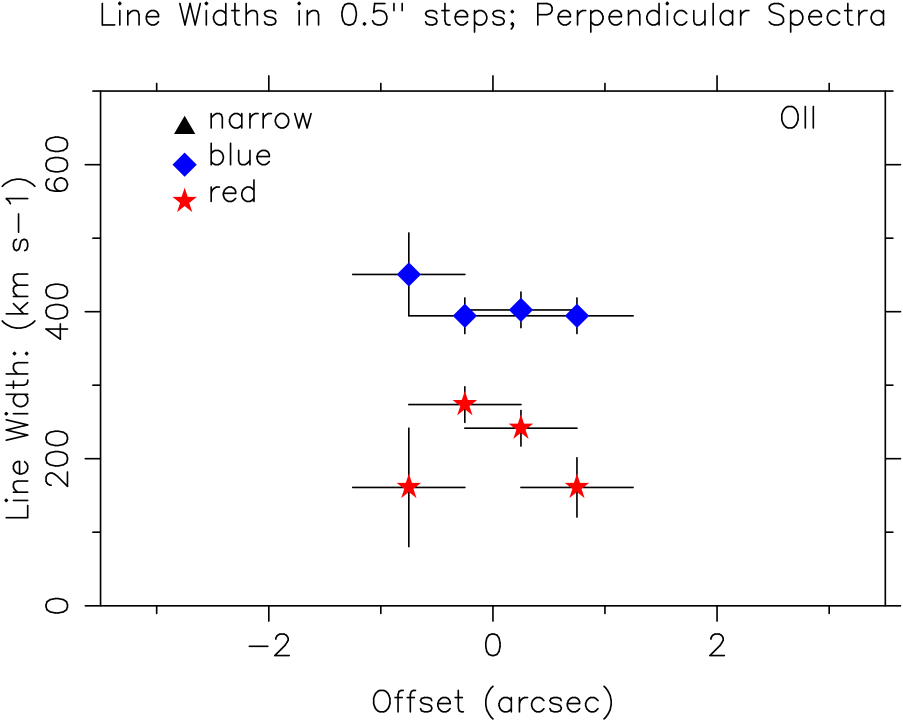
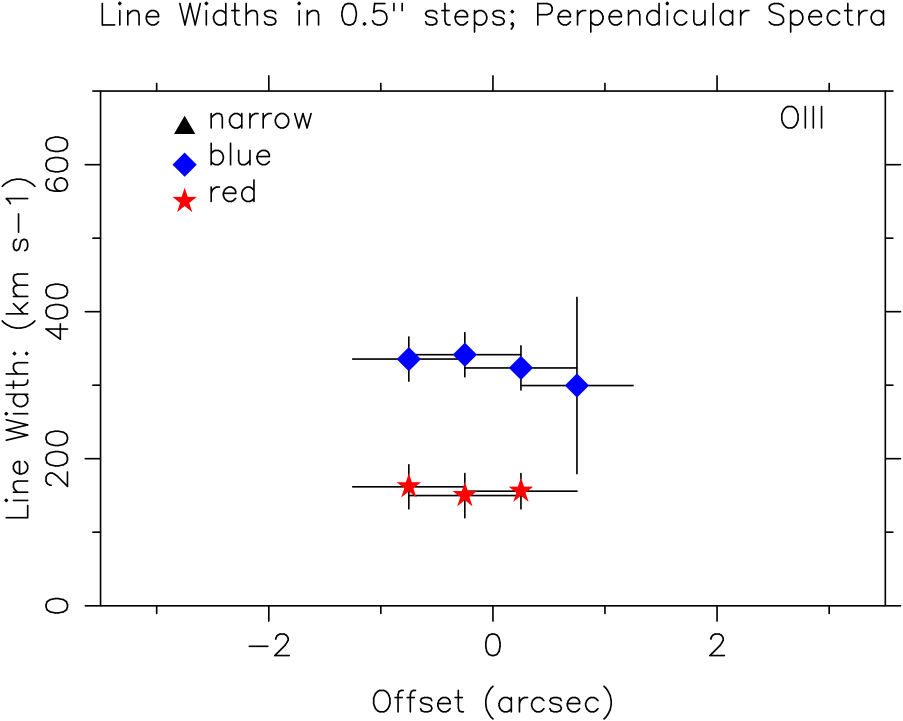
The results of our analysis of the kinematics of the parallel spectrum are presented in Fig. 8.
An unresolved emission component is present in the outer regions of the extended emission line region (hereafter EELR), in both [Oii] and [Oiii], at wavelengths consistent with the emitting material lying at rest relative to the host galaxy. This narrow component can be traced across the galaxy in [Oiii]. The [Oii] emission line is of substantially higher luminosity, particularly in the central regions of the galaxy. Because of this, the narrow component of [Oii] can only be observed in the outer regions, and is lost in the centre in favour of one or more broader components. The relative strengths of the narrow components of [Oii] and [Oiii] are consistent with simple AGN photoionization, as demonstrated by our diagnostic diagrams in the previous section.
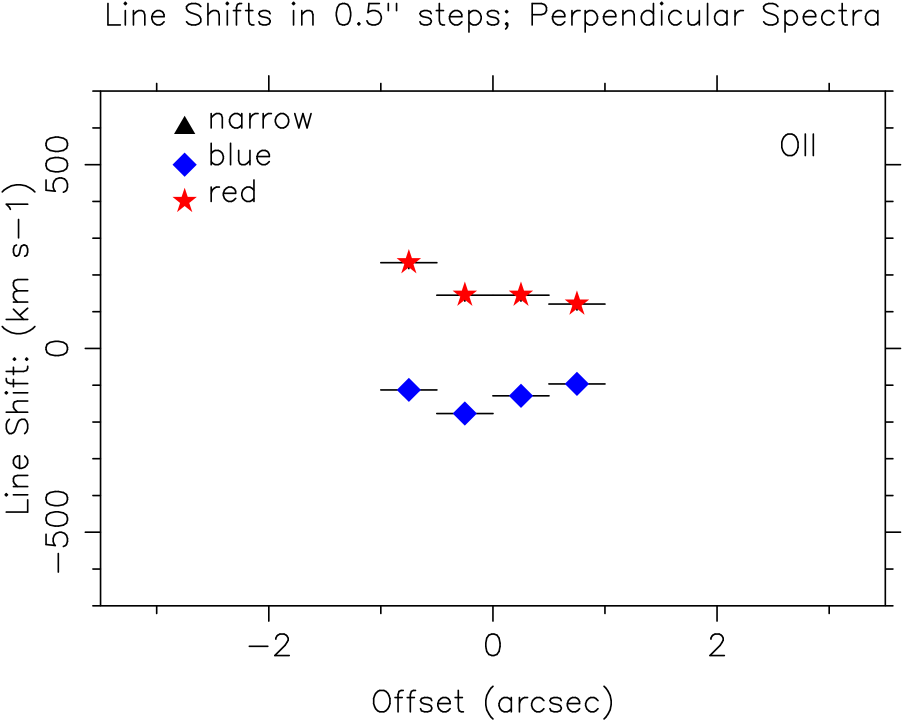
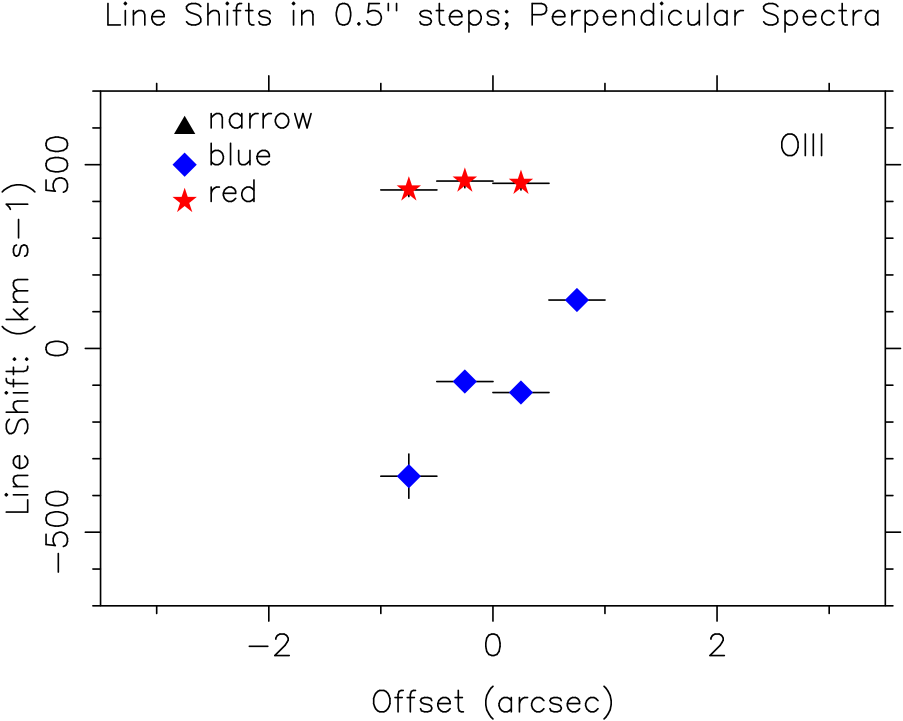
The broader emission line components extend to approximately 1-1.5′′ from the continuum centroid. Note that the [Oii] emission is substantially stronger than the [Oiii] emission; such a low ionization state in the emitting material is suggestive of shocks associated with the radio source, in which case the emitting material would display larger line widths than more settled material. Usually a single broad component is sufficient, except in the central regions where two broad components are preferred. The broad components on the SE side of the galaxy (see the 2-d spectrum presented in Fig. 2) usually lie at shorter wavelengths, with a velocity shift of a few hundred km s-1, whilst the emission from the opposite side of the galaxy is shifted to longer wavelengths by a similar amount. Of these two distinct components, the blue-shifted emission line component is generally more luminous, and has a larger line width (400-600 km s-1, cf 200-400km s-1 for the red-shifted emission).
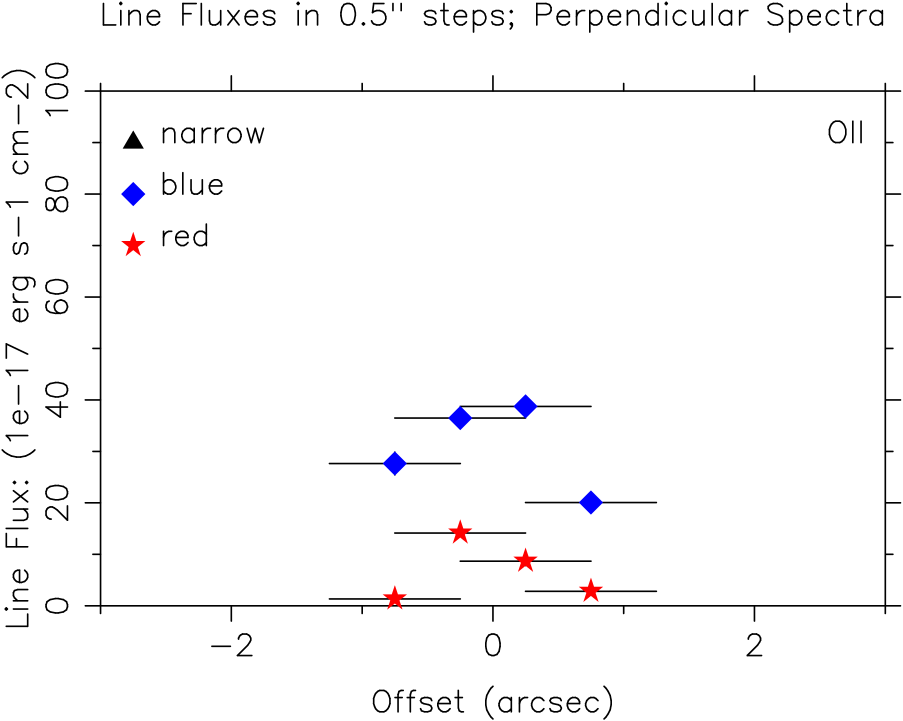
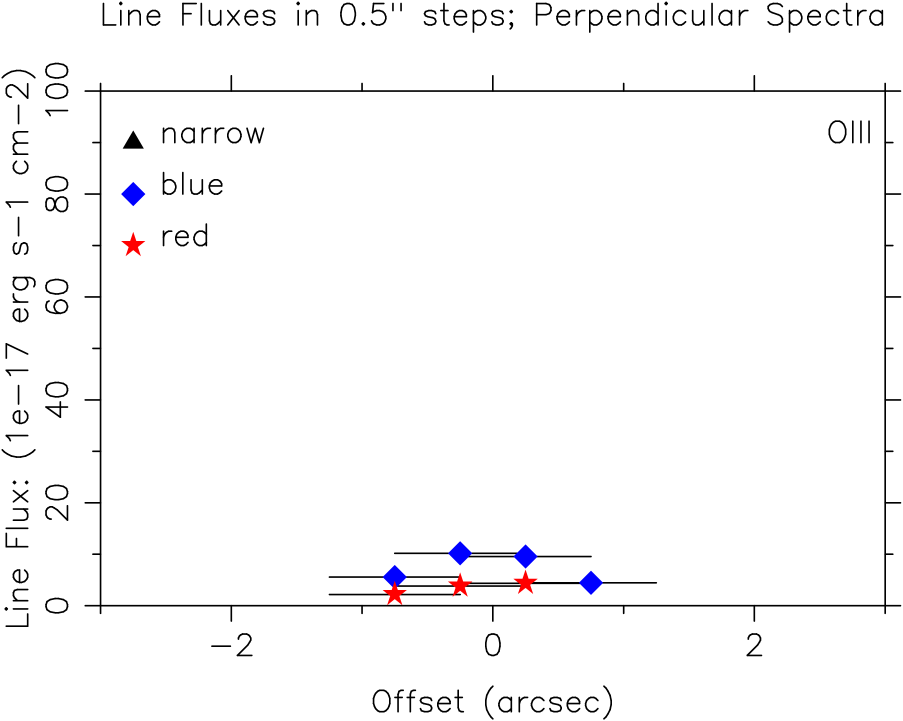
We also present the results of a similar analysis of the spectrum aligned perpendicular to the radio source axis (Fig. 9). As the line emission in the perpendicular spectrum is much less extensive, larger extracted spectra of 1′′ in width have been modelled to boost the signal-to-noise. The first main feature of note is the lack of an extended narrow component. This is strong evidence that the source of the ionizing photons for the extended narrow component is the ionization cone of the AGN, which does not intersect with the perpendicular spectrum except in its centre.
In the central regions of the perpendicular spectrum, broad emission components are observed. These are very similar to those in the parallel spectrum, with the exception that there is no clear tendency for the blue- or red-shifted emission to preferentially lie on one side of the galaxy or the other. This suggests that outflows along the radio axis are a plausible option for explaining the gas kinematics, as an alternative to simple rotation. The greater luminosity and extent of the material to the SE side of the galaxy, together with the blueshifted broader component, suggests that the SE radio lobe would be orientated towards the observer; given the observed radio asymmetries (section 2.1) and quiescent extended emission line component at larger radii the outflow scenario is indeed highly plausible.
5 Continuum emission
The continuum emission of 9C1503+4528 is remarkably blue. Together with the clear presence of Balmer absorption lines and the young age of the radio source this suggests a significant young stellar population. If the triggering of radio source activity is connected with the star formation, the properties of any young stellar population formed as part of that process can shed light on the exact mechanisms and timescales involved. We have therefore carried out continuum modelling of our spectra, with the aim of placing limits on both the mass and age of any young stellar population present in this galaxy.
For the continuum modelling, we combined both the parallel and perpendicular 2-d frames and extracted a 1-d spectrum from the central 2′′ (Fig. 3).
The first stage was to remove the contribution of nebular continuum emission (Dickson et al 1995). Although subject to stellar absorption features, the Balmer line strengths are in general consistent with the predictions of case B recombination, and internal reddening is unlikely to be a major issue. The H flux can be well modelled, and was used to determine the contribution from the various nebular continuum emission processes (free-free emission, bound-free emission, two-photon emission and the Balmer forest pseudo-continuum), assuming an electron temperature of 15000K. (Checks with alternative temperatures, allowing for the error on our evaluation of the H flux, do not produce significantly different results.) The corrected spectrum was binned in blocks of Å, excluding any regions where emission lines were present.
To fit the remaining stellar continuum we used a combination of young and old stellar population SEDs from the models of Bruzual & Charlot (2003). A Chabrier initial mass function and solar metallicity were selected, and the stellar populations were assumed to form in an instantaneous burst. We consider stellar population ages ranging from years up to years (the expected age of the old stellar population in a galaxy, assuming a formation redshift of ). Reduced fitting was used to determine the relative proportions of old/young stars for all combinations of SED models.
Figure 10 displays the results of our best-fit model. This consists of an old (6 Gyr) stellar population, plus a year young stellar population accounting for 0.065% of the total stellar mass, and roughly 70% of the total continuum flux at a wavelength of Å. Our modelling implies that the total stellar mass in the central region of the galaxy probed by our spectra is approximately , whereas the overall stellar mass of the galaxy (based on our band modelling in section 6) is closer to . The largest residuals lie near the Ca absorption feature at Å, which is subject to infilling by line emission at 3967Å due to H + [Neiii].
A plot of best-fit reduced as a function of young stellar population (hereafter YSP) age is displayed in Fig. 11. A contribution from a young stellar population is very much favoured over an old stellar population alone. Fits obtained using different ages for the majority old stellar population (ranging from 5 to 9 Gyr in age) do not lead to any significant variation in the resulting best-fit YSP.
We must also consider the potential presence of a power-law ionizing continuum associated with the AGN. If the presence of a power-law component is simply added to our modelling, allowing its flux and shape to vary freely, the resulting best-fit model generally prefers an unrealistically strong power-law flux, and it is therefore necessary to place constraints on the power law contribution in order to make a meaningful assessment of its effects. To determine the balance between YSP age/mass and power-law contribution, we repeated our fitting procedure using fixed power-law contributions ranging from 0% to 50% of the total flux at a wavelength of Å. The spectral index of the power law (defined as ) is constrained to be one of three values, , or . The fitting procedure was then repeated for all combinations of stellar populations and power-law parameters. The resulting best-fit YSP parameters (age, mass, reduced ) for each of the different power law contributions considered are displayed in Appendix B.
With the exception of the fits with the very highest power-law contribution (), the best-fit YSP mass and age remain relatively unchanged. The similar strengths of the narrow line emission components either side of the galaxy centroid in the parallel spectra (suggesting that this source is observed with the ionization cone aligned in a direction nearly perpendicular to the line of sight) also imply that a two-component stellar population provides a more than adequate explanation of the observed continuum emission, and that no power-law is required.
6 Implications for source triggering
6.1 Morphological properties of the host galaxy
Given the spectroscopic evidence for a young stellar population, we examined the galaxy morphology for evidence for a merger or other interaction which may have caused the starburst. Our calculated 0.06% 5 Myr YSP would be expected to contribute only 0.02 magnitudes to the -band flux, and so the -band image will be dominated by the old stellar populations of the host galaxy and any merging companion or tidal tails.
We fitted the galaxy morphology using the methods detailed in Inskip et al. (2005), which can be briefly summarised as follows. The point spread function for the UFTI field is determined from unsaturated stars within the mosaic field; we extract their 2-d profile, normalise to unit flux and take the average profile. Sérsic profile (Sérsic 1968) galaxy models were then convolved with the point spread function and fitted to the surface profile of the galaxy, using available least squares minimisation IDL routines333mp2dfunfit.pro, part of Craig Markwardt’s mpfit non-linear least squares curve fitting package available via http://astrog.physics.wisc.edu/ craigm/idl/fitting.html.. Free parameters are the galaxy flux, centroid, effective radius, Sérsic index and fractional nuclear point source contribution. Galaxy ellipticity was also allowed to vary, but in the case of this object a circular model with was preferred.
From the -band data, our resulting best-fit model, residuals and 1-d radial profile are displayed in Fig. 12. We find that the host galaxy appears to have a simple de Vaucouleurs elliptical morphology, with a preferred Sérsic index of , and a best-fit () effective radius of (equivalent to kpc at ). We find no evidence for any nuclear point source contribution at band (preferred point source percentage ).
The -band data are too noisy to make an accurate fit to the data; the effective radius is constrained only to lie between 1.3 and 1.6. This is, however, consistent with the -band fit. Most importantly, we find no significant residual emission which would indicate the presence of a close companion galaxy or tidal tails.
Any galaxy interaction/merger activity must therefore either have been very minor in nature, or have occurred sufficiently long ago that the old stellar population of the host galaxy has returned to an undisturbed morphology. In the latter case, the interaction must have taken place several dynamical timescales before the present observations. We estimate the dynamical timescale as , where is the velocity dispersion of the galaxy, which in turn we estimate by taking the FWHM of the narrow component of the emission lines ( km s-1). This gives 60 Myr, so any previous interaction must have occurred at a time very much earlier that the formation of the YSP. We thus conclude that the YSP and present AGN activity were caused by, at most, a minor interaction.
6.2 Evidence from the extended emission-line region
As with many other radio galaxies the properties of the extended emission line region of 9C J1503+4528 vary substantially with spatial position. The changes in ionization state confirm our expectations that shocks are important in the vicinity of the young radio source, and that AGN photoionization dominates elsewhere. The kinematic properties of the emission line gas confirm this picture, with the broader emission lines highlighting the disturbed kinematics of the central regions, in contrast to the kinematically quiescent material at larger radii.
The projected physical size of the EELR is kpc. Emission line regions of this scale are by no means unusual, and are often substantially larger in the case of FRII radio sources (for example, 50–100 kpc for extended 3C and 6C sources, Best, Röttgering & Longair 2000; Inskip et al 2002). However, there are significant contrasts between this EELR and those of more extended radio galaxies.
First, the EELR of 9C J1503+4528 has a very sharp cutoff, rather than the more gradual decline in emission line luminosity observed in the cases of other sources (e.g. Best, Röttgering & Longair 2000; Inskip et al 2002). Second, and of great significance, is the fact that the EELR is a factor of ten larger than the size of the radio source. Unlike the case of the 3C and 6C sources, where the EELR is significantly affected by the passage of the radio source, here we have a case where the EELR could very well correspond to the limiting distance reached by the ionization front of an AGN, illuminating the region ahead of the radio source before it leaves the centre of the host galaxy.
This factor of difference between radio source size and EELR size has a significant implication. In combination with the typical 0.1 c source expansion speed, we find it highly plausible that the radio jets and AGN were triggered simultaneously, some years prior to our observations.
6.3 Spatial distribution of star formation


The material lying at larger angles to the radio source axis (i.e. the regions probed by the perpendicular spectrum) is also of interest. The line emission along this axis is far less extensive (as expected for the regions lying on the edge of, or outside, the ionization cone). Its ionization state suggests a lower ionization parameter (i.e. fewer and/or less energetic ionizing photons), and the weak line emission in these regions could be better explained as being due to ionization by young OB stars (HII regions). Our continuum modelling in the preceding section finds clear evidence for a young stellar population with an age of roughly 5 million years, but does not allow us to pinpoint its location. However, the varying strength of the Balmer absorption features in the parallel and perpendicular spectra (Fig. 13) can give us some idea of how widely distributed this young stellar population might be.
This plot displays the H line profile for the parallel and perpendicular spectra, using increasing extraction widths of 1″to 5″, beyond which point increased aperture widths only lead to a deterioration of the signal-to-noise. In the perpendicular extracted spectra, Balmer absorption can be clearly observed, and becomes increasingly apparent as emission from regions at a greater distance from the AGN is included (i.e. for increased aperture widths). The line emission in the parallel spectra is roughly 50-100% more luminous (see Appendix A), and the evidence for the same trend in the strength of the absorption component is less clear-cut. Whilst the line emission is strongest in the central regions of the host galaxy, the distribution of the line absorption must therefore be less well peaked, otherwise we would not observe a strengthening of the absorption component in wider apertures. This suggests that any young stellar population responsible for the Balmer absorption features is unlikely to lie predominantly within the central few pc. The pronounced appearance of the Balmer absorption in the perpendicular spectra suggests that the underlying young stellar population is not linked to the location of the growing radio source but rather, more widely distributed throughout the galaxy. Indeed, given the relative ages of YSP and radio source (years and years respectively), a radio-source induced star formation scenario would seem unlikely.
It is interesting to contrast the derived properties of the YSP detected in the spectra of 9C J1503+4528 with those found for other sources. Recent work on the GPS radio source PKS1345+12 (Rodriguez et al, in prep) finds evidence for a very similar young stellar population to that of 9C J1503+4528: an age of roughly 5 million years (c.f. years for the radio source itself) and a mass of . Imaging observations locate the YSPs in several super star clusters lying in the outer regions of the host galaxy, rather than in a nuclear starburst ring such as that observed for Cygnus A (e.g. Jackson, Tadhunter & Sparks 1998). A further point of interest is the finding that the hosts of high luminosity AGN observed as part of the Sloan Digital Sky Survey (Kauffmann et al 2003) typically have younger mean stellar ages than normal elliptical galaxies existing at the same epoch. Additionally, the young stars are not preferentially located near the galaxy nuclei, but rather are spread out over a much wider scale. These properties are strikingly similar to those observed in 9C J1503+4528.
6.4 Gas kinematics
The observed changes in gas kinematics and dominant ionization mechanism in different regions of the EELR are not unexpected, given the expected location of radio source shocks, but do provide two key results: the clumpy ISM/IGM responsible for the EELRs observed around powerful radio sources does appear to be in place prior to the expansion of the radio source, and the kinematic properties of the extended regions are relatively undisturbed. Any disturbance of the ISM/IGM due to an earlier interaction/merger has since settled down.
6.5 Spectroscopic evidence of a prior merger
If the triggering of radio source activity in this galaxy was due to a merger or interaction, the properties of any young stellar population formed as part of that process can shed light on the exact mechanisms and time scales involved. Our continuum modelling of these spectra confirms the presence of a young stellar population, whose formation occurred several million years in advance of the onset of AGN activity. The mass of this YSP component is a low proportion of the total stellar mass of the host galaxy. Together with the the quiescent kinematics in the outer regions of the EELR, and the morphological evidence described above, this suggests that if a merger/interaction was responsible for both the eventual triggering of the radio source activity and the formation of the young stellar population, it is most likely to have been fairly minor in nature.
7 Conclusions
9C J1503+4528 provides a detailed insight into many of the events associated with the triggering of a powerful radio source. Our observations have shown that:
-
The relative sizes of EELR and radio source (the former being times larger), together with typical compact radio source expansion velocities of 0.1 c, suggest that both the luminous quasar nucleus responsible for photoionizing the outer regions of the EELR, and the radio source itself, were triggered simultaneously.
-
The EELR ionization state is consistent with shocks being important on scales comparable to the radio source, with AGN photoionization within the ionization cones being the dominant mechanism further from the AGN, beyond the extent of the radio lobes.
-
The gas kinematics confirm that weak shocks could be important close to the radio source, and that the outer regions of the EELR are relatively undisturbed. The kinematics suggest that motion along the radio axis may be taking place, which may indicate the presence of outflows.
-
The blue continuum emission and Balmer absorption features suggest that recent star formation has occurred, but their spatial distribution suggests that it is not caused by the passage of the radio source.
-
Modelling of the observed continuum emission gives a best-fit age for the young stellar population of years, and a mass of roughly 0.06% of the total stellar mass of the host galaxy.
-
Imaging observations of the host galaxy reveal a simple elliptical morphology; fitting of the band image suggests an effective radius of kpc.
-
A timescale of events can be built up from these results: star formation is triggered by some event; in this case, any tidal interaction or merger must have been relatively minor. AGN/radio source activity follows the onset of star formation by several million years.
As a final consideration, we speculate on scenarios where the lack of evidence for a recent merger may be significant. As noted in the introduction, it is thought that the crucial ingredient for a radio-loud AGN is that the central black hole is rapidly spinning, a process which is most naturally explained by the coalescence of two smaller black holes (Wilson & Colbert 1995). Indeed, the cosmic evolution of AGN activity can be well-described in terms of the expected halo merger rate (Mahmood, Devriendt & Silk 2005). However, the timescales involved in the black hole coalescence after the halo merger are extremely uncertain; while it is thought that SMBHs can be brought within one parsec of each other on a timescale similar to the dynamical friction timescale (e.g. Milosavljvic & Merrit 2001), the mechanism for the final merger is unknown.
One possibility is that the formation of an accretion disc around one or both black holes provides the final necessary dynamical friction (e.g. Armitage & Natarajan 2005). If we assume that the central black hole of 9C J1503+4528 was spun up as part of the AGN triggering process, the apparent simultaneity of the triggering of both the optical AGN activity (requiring an accretion disc) and the radio jets (requiring the SMBH to be spinning rapidly) for 9C J1503+4528 would demand that the final SMBH coalescence must take place on a very short timescale indeed. If this were not the case, and SMBH coalescence occurred more slowly, one would expect a period of radio-quiet AGN activity to precede the formation of the jets, which is ruled out in the case of this source by the relative sizes of the EELR and radio source.
Given the lack of evidence for a recent major merger, we therefore propose that the host galaxy of 9C J1503+4528 contained a rapidly spinning SMBH prior to the present period of AGN activity. In this case, the SMBH would have been spun up a significant time in the past, most likely during one or more mergers of smaller gas-rich discs which, in hierarchical clustering models, are the progenitors of ellipticals (e.g. Springel et al 2005). This scenario has the advantage that radio-loud AGN may be “re-lit” by relatively small gas injections from time to time, which provides a natural route for the necessary mechanical energy feedback in the intracluster medium (Nipoti & Binney 2005; Best et al 2005). However, both 9C J1503+4528 and the well-studied cluster radio sources are observed at relatively recent cosmic time. The time delay between the initial creation of a binary SMBH pair and the onset of jet activity may have been significantly shorter in the early universe, where gas-rich mergers were significantly more prevalent. Such a scenario could be tested by investigating any time lag between the evolution of the radio luminosity function at high redshift (which is still poorly constrained, e.g. Willott et al. 2001) and the halo merger rate as predicted by hierarchical clustering models.
Acknowledgements
We thank Clive Tadhunter & Joanna Holt for useful discussions and allowing us to develop the CONFIT software for our own use; Daniel Smith and Matt Jarvis for obtaining the -band image; and Andy Adamson for obtaining the -band image.
Some of the data presented herein were obtained at the W. M. Keck Observatory, which is operated as a scientific partnership among the California Institute of Technology, the University of California, and the National Aeronautics and Space Administration. The Observatory was made possible by the generous financial support of the W. M. Keck Foundation.
UKIRT is operated by the Joint Astronomy Centre on behalf of PPARC.
KJI acknowledges a PPARC research fellowship, DL a PPARC PhD studentship and GC support from PPARC observational rolling grant PPA/G/O/2003/00123.
It is a pleasure to express our gratitude and respect to the indigenous people of Hawai‘i, from whose sacred mountain Mauna Kea our observations were made.
We thank the anonymous referee for their very useful comments on this paper.
References
- [1] Armitage P. J., Natarajan P., 2005, ApJ, 634, 921
- [2] Baldwin J. A., Phillips M. M., Terlevich R., 1981, PASP, 93, 5
- [3] Best P. N., Kauffmann G., Heckman T. M., Brinchmann J., Charlot S., Ivezić Ž., White S. D. M., 2005, MNRAS, 362, 25
- [4] Best P. N., Röttgering H. J. A., Longair M. S., 2000, MNRAS, 311, 1
- [5] Binette L., Wilson A. S., Storchi-Bergmann T., 1996, A&A, 312, 365
- [\citeauthoryearBlandford & Znajek1977] Blandford R. D., Znajek R. L., 1977, MNRAS, 179, 433
- [6] Bolton R. C., Cotter G., Pearson T. J., Pooley G. G., Readhead A. C. S., Riley J. M., Waldram E. M., 2003, NewAstRev, 2003, 47, 367
- [7] Bolton R. C., Cotter G., Pooley G. G., Riley J. M., Waldram E. M., Chandler C. J., Mason B. S., Pearson T. J., Readhead A. C. S., 2004, MNRAS, 354, 485
- [8] Bolton R. C., Chandler C. J., Cotter G., Pearson T. J., Pooley G. G., Readhead A. C. S., Riley J. M., Waldram E. M., 2006, MNRAS, 367, 323
- [9] Bremer M. N., Fabian A. C., Crawford C. S., 1997, MNRAS, 284, 213
- [\citeauthoryearBrüggen & Kaiser2002] Brüggen M., Kaiser C. R., 2002, Nature, 418, 301
- [10] Bruzual G., Charlot S., 2003, MNRAS, 344, 1000
- [11] Croton D. J., et al, 2006, MNRAS, 365, 11
- [12] Dickson R., Tadhunter C., Shaw M., Clark N., Morganti R., 1995, MNRAS, 273, L29
- [13] Dopita M. A., Sutherland R. S., 1996, ApJS, 102, 161
- [\citeauthoryearFabian et al.2003] Fabian A. C., Sanders J. S., Allen S. W., Crawford C. S., Iwasawa K., Johnstone R. M., Schmidt R. W., Taylor G. B., 2003, MNRAS, 344, L43
- [14] Fanti C., Fanti R., Dallacasa D., Schilizzi R. T., Spencer R. E., Stanghellini C., 1995, A&A, 302, 317
- [15] Groves B. A., Dopita M. A., Sutherland R. S., 2004a, ApJS, 153, 9
- [16] Groves B. A., Dopita M. A., Sutherland R. S., 2004b, ApJS, 153, 75
- [17] Heckman T. M., Smith E. P., Baum S. A., van Breugel W. J. M., Miley G. K., Illingworth G. D., Bothun G. D., Balick B., 1986, ApJ, 311, 526
- [18] Howarth I. D, 1983, MNRAS, 203, 301
- [19] Inskip K. J., Best P. N., Rawlings S., Longair M. S., Cotter G., Röttgering H. J. A., Eales S. A., 2002, MNRAS, 337, 1381
- [20] Inskip K. J., Best P. N., Longair M. S., Röttgering H. J. A., 2005, MNRAS, 359, 1393
- [21] Jackson N., Tadhunter C., Sparks W. B., 1998, MNRAS, 301, 131
- [\citeauthoryearJohnston et al.2005] Johnston H. M., Hunstead R. W., Cotter G., Sadler E. M., 2005, MNRAS, 356, 515
- [\citeauthoryearKaiser, Dennett-Thorpe, & Alexander1997] Kaiser C. R., Dennett-Thorpe J., Alexander P., 1997, MNRAS, 292, 723
- [22] Kewley L. J., Geller M. J., Jansen R. A., 2004, AJ, 127, 2002
- [23] Kauffmann G., 2003, MNRAS, 346, 1055
- [24] Mahmood A., Devriendt J. E. G., Silk J., 2005, MNRAS, 359, 1363
- [25] Milosavljević M., Merritt D., 2001, ApJ, 563, 34
- [26] Murgia M., 2003, Pub. Astron. Soc. Austral., 20, 19
- [\citeauthoryearNipoti & Binney2005] Nipoti C., Binney J., 2005, MNRAS, 361, 428
- [27] Oke J. B., et al, 1995, PASP, 107, 375
- [28] Osterbrock D. E., 1989, Astrophysics of Gaseous Nebulae and Active Galactic Nuclei, University Science Books, Mill Valley, CA
- [29] Owsianik I., Conway J. E., Polatidis A. G., 1998, A&A, 336, L37
- [30] Polatidis A. G., Conway J. E., 2003, PASA, 20, 19
- [31] Readhead A. C. S., Taylor G. B., Pearson T. J., Wilkinson P. N., 1996, ApJ, 460, 634
- [32] Rola C. S., Terlevich E., Terlevich R. J., 1997, MNRAS, 289, 419
- [33] Schlegel D. J., Finkbeiner D. P., Davis M., 1998, ApJ, 500, 525
- [34] Sérsic J. L., 1968, Atlas de Galaxias Australes (Córdoba: Observatorio Astronomico)
- [35] Snellen I. A. G., Schilizzi R. T., Miley G. K., de Bruyn A. G., Bremer M. N., Röttgering H. J. A., 2000, MNRAS, 319, 445
- [36] Springel V., et al, 2005, Nature, 435, 629
- [37] Taylor G. B., Marr J. M., Pearson T. J., Readhead A. C. S., 2000, ApJ, 541, 112
- [\citeauthoryearVenemans et al.2005] Venemans B. P., et al., 2005, A&A, 431, 793
- [38] Waldram E. M., Pooley G. G., Grainge K. J. B., Jones M. E., Saunders R. D. E., Scott P. F., Taylor A. C., 2003, MNRAS, 342, 915
- [39] Willott C. J., Rawlings S., Blundell K. M., Lacy M., Eales S. A., 2001, MNRAS, 322, 536
- [40] Wilson A. S., Colbert E. J. M., 1995, ApJ, 438, 62
Appendix A Emission line properties of 9C J1503+4528
| Details of extracted spectrum | Combined, | Parallel, | Perpendicular, | Parallel, | Perpendicular, | |
|---|---|---|---|---|---|---|
| [Oii] flux | ||||||
| H flux | ||||||
| [Oii]3727 | [Oii] Flux Ratio | 100 | 100 | 100 | 100 | 100 |
| H Flux Ratio | ||||||
| Equiv. width | 182Å | 192Å | 170Å | 150Å | 123Å | |
| [Neiii] 3869 | [Oii] Flux Ratio | |||||
| H Flux Ratio | ||||||
| Equiv. width | 17Å | 19Å | 15Å | 16Å | 15Å | |
| H 3889 | [Oii] Flux Ratio | |||||
| H Flux Ratio | ||||||
| Equiv. width | 1.3Å | 3.1Å | 1.9Å | 1.9Å | 0.2Å | |
| H+[Neiii] 3967 | [Oii] Flux Ratio | |||||
| H Flux Ratio | ||||||
| Equiv. width | 1.0Å | 1.9Å | 0.3Å | 1.0Å | 0.4Å | |
| [Sii] 4072 | [Oii] Flux Ratio | |||||
| H Flux Ratio | ||||||
| Equiv. width | 4.1Å | 4.9Å | 3.9Å | 2.3Å | 2.1Å | |
| H 4102 | [Oii] Flux Ratio | |||||
| H Flux Ratio | ||||||
| Equiv. width | 1.1Å | 1.5Å | 0.9Å | 1.1Å | 0.4Å | |
| H 4340 | [Oii] Flux Ratio | |||||
| H Flux Ratio | ||||||
| Equiv. width | 5.7Å | 6.9Å | 4.3Å | 5.3Å | 1.7Å | |
| [Oiii] 4363 | [Oii] Flux Ratio | |||||
| H Flux Ratio | ||||||
| Equiv. width | 2.1Å | 2.0Å | 1.2Å | 1.9Å | 0.8Å | |
| H 4861 | [Oii] Flux Ratio | |||||
| H Flux Ratio | 100 | 100 | 100 | 100 | 100 | |
| Equiv. width | 10Å | 10Å | 8.9Å | 7.7Å | 6.0Å | |
| [Oiii] 4959 | [Oii] Flux Ratio | |||||
| H Flux Ratio | ||||||
| Equiv. width | 17Å | 17Å | 16Å | 18Å | 14Å | |
| [Oiii] 5007 | [Oii] Flux Ratio | |||||
| H Flux Ratio | ||||||
| Equiv. width | 38Å | 43Å | 40Å | 41.8Å | 32Å | |
| Power law % | Old SP | YSP properties | Reduced | ||
|---|---|---|---|---|---|
| at Å | age (Gyr) | age (Myr) | mass % | ||
| (1) | (2) | (3) | (4) | (5) | (6) |
| 0.0% | N/A | 6.0 | 5 | 0.065% | 1.01943 |
| 1.0% | -1 | 6.0 | 5 | 0.064% | 1.03379 |
| 1.0% | -2 | 6.0 | 5 | 0.064% | 1.03269 |
| 1.0% | -3 | 6.0 | 5 | 0.064% | 1.03236 |
| 2.5% | -1 | 6.0 | 5 | 0.063% | 1.05603 |
| 2.5% | -2 | 6.0 | 5 | 0.063% | 1.05338 |
| 2.5% | -3 | 6.0 | 5 | 0.062% | 1.05281 |
| 5.0% | -1 | 6.0 | 5 | 0.061% | 1.09503 |
| 5.0% | -2 | 6.0 | 5 | 0.060% | 1.09005 |
| 5.0% | -3 | 6.0 | 5 | 0.060% | 1.08985 |
| 10.0% | -1 | 6.0 | 5 | 0.058% | 1.18089 |
| 10.0% | -2 | 5.0 | 5 | 0.063% | 1.17021 |
| 10.0% | -3 | 5.0 | 5 | 0.061% | 1.17095 |
| 15.0% | -1 | 5.0 | 5 | 0.061% | 1.27639 |
| 15.0% | -2 | 5.0 | 5 | 0.058% | 1.26151 |
| 15.0% | -3 | 5.0 | 5 | 0.056% | 1.26901 |
| 25.0% | -1 | 5.0 | 5 | 0.052% | 1.50695 |
| 25.0% | -2 | 5.0 | 5 | 0.048% | 1.49007 |
| 25.0% | -3 | 7.0 | 50 | 0.703% | 1.50599 |
| 50.0% | -1 | 6.0 | 50 | 0.489% | 2.20266 |
| 50.0% | -2 | 6.0 | 100 | 0.774% | 1.96529 |
| 50.0% | -3 | 7.0 | 100 | 0.647% | 1.83815 |
Here we present the results of our emission-line fitting for the parallel, perpendicular and combined 2-d frames. Fluxes relative to both [Oii]3727Å and are tabulated in Table A1, as well as their equivalent widths. Although flux ratios quoted relative to are more common, the presence of Balmer absorption lines reduces the usefulness of this ratio. The values in Table A1 have been corrected for galactic extinction, using values for the Hi column density of the Milky Way taken from the NASA Extragalactic Database (NED), and the parametrized galactic extinction law of Howarth (1983).
Appendix B Best-fit YSP parameters in the presence of a power-law.
As part of our modelling, we consider the effects of the inclusion of a power-law component on the best-fit YSP parameters. The preferred age of the young stellar population remains unchanged at 5 Myr except for the strongest power-law contributions (). However, the reduced values indicate that models with a strong power law contribution are not favoured.