Isophotal shapes of Elliptical/S0 Galaxies from the Sloan Digital Sky Survey
Abstract
We revisit the shapes of isophotes for elliptical (E) and lenticular (S0) galaxies by studying 847 nearby early-type galaxies selected from the Sloan Digital Sky Survey Data Release 4 with velocity dispersions above . The IRAF task ellipse was used to derive the deviations of the isophotes from pure ellipses (Fourier coefficients and ), position angles and ellipticities as a function of radius. We show the statistical distributions of the and parameters as a function of velocity dispersion, magnitude, and colour. The parameter is correlated with the ellipticity and absolute Petrosian magnitude of galaxies. No significant correlation was found between the parameter with colour and velocity dispersion. A cross-correlation between the FIRST survey and the SDSS data reveals a lack of powerful radio emitters in discy E/S0s, as previously found by Bender et al. We also find that boxy E/S0s favor denser environments while discy E/S0s favor more isolated environments. The median values of changes in the ellipticity and position angle between one and one and a half Petrosian half-light radii in the isophotes are about 0.023 and respectively. The average change in the position angle is much larger, about , due to an extended tail. The change in ellipticity is weakly correlated with the ellipticity itself, with an increasing ellipticity for galaxies with higher ellipticity as the radius increases. The isophote parameters for the 847 galaxies are available online.
keywords:
galaxies: elliptical and lenticular, CD – galaxies: photometry – galaxies: structure1 Introduction
The morphologies of galaxies carry important information on how they form, evolve and how they are supported dynamically. For example, disc galaxies are highly flattened systems that are rotationally supported. It implies that angular momentum must have played a crucial role in determining their properties, such as sizes and the Tully-Fisher relation (e.g., Mo, Mao & White 1998 and references therein). Similarly, shapes of elliptical (E) and lenticular (S0) galaxies carry important information about their formation history and dynamical state.
The isophotes of elliptical galaxies and S0’s can be well fitted by ellipses to the zeroth order. Small but significant deviations from perfect ellipses exist. Around 1980’s, CCDs became more widely used in astronomy and they enabled accurate photometric measurements of galaxies. Several authors studied the isophotal shapes of elliptical galaxies (Lauer 1985; Bender & Möllernhoff 1987; Jedrzejewski 1987). In an influential study, Bender et al. (1988) presented the isophotal analysis of a sample of 69 nearby bright elliptical galaxies. This study used CCD photometry in the Cousins , , under typical seeing conditions of about 2 arcseconds with a field of view of 3 by 4 arc minutes. Combining CCD data from other studies, Bender et al. (1989) classified 109 early-type galaxies according to the isophotal shapes using Fourier expansions in the polar angle (see §2.2.2). It was found that the most significant non-zero component of the Fourier analysis is the parameter (corresponding to the term). Using the sign of this parameter, E/S0 galaxies were classified into discy () and boxy () galaxies. Bender et al. (1989) showed that this parameter has significant correlations with the radio and X-ray properties in elliptical galaxies. It is now increasingly clear that early-type galaxies can be subdivided into two classes: discy ellipticals tend to be fainter, rotationally supported, lack X-ray and radio activities and have power-law nuclear light profiles while boxy ellipticals tend to be brighter, supported by random motions, have significant X-ray and radio activities and cored nuclear profiles (Ferrarese et al. 1994; van den Bosch et al. 1994; Lauer et al. 1995; Faber et al. 1997; Rest et al. 2001; Lauer et al. 2005). In addition, the shapes of elliptical galaxies may also be correlated with their ages (Ryden, Forbes & Terlevich 2001). Pellegrini (1999, 2005) updated the analysis of the correlation between galaxy shapes and X-ray properties for early-type galaxies using ROSAT and Chandra data. Pasquali et al. (2006) found, among other things, that the percentages of discy and boxy ellipticals at are similar to the local values, and their characteristic shapes also follow the same correlations of local ellipticals, with an exception of the parameter which appears to be larger than that for the local counterparts.
The ellipticities and position angles in ellipticals vary as a function of distance from the galaxy centre. Di Tullio (1978, 1979) found that for isolated ellipticals, on average, the ellipticity decreases as a function of radius, while for ellipticals in clusters and groups, the ellipticity either increases, decreases or peaks as a function of radius. This environmental dependence of isophotal shape changes, if confirmed, would imply that external environments have significant effects on the inner properties of galaxies.
There have been many theoretical interpretations for the origins of discy and boxy ellipticals. For example, Naab, Burkert & Hernquist (1999, also Nabb & Burkert 2003 and Naab, Khochfar & Burkert 2006) concluded that equal-mass mergers of two disk galaxies tend to produce boxy ellipticals while non-equal mergers produce discy ellipticals. Khochfar & Burkert (2005) used semi-analytical simulations to study the origin of the discy and boxy ellipticals. They concluded that the isophotal shapes of merger remnants depend not only on the mass ratio of the last major merger but also on the morphology of their progenitors and the subsequent gas infall. These theoretical studies and comparisons with high-redshift objects (Pasquali et al. 2006) all used the observational constraints from the limited sample of Bender et al. (1989). Therefore, it is necessary to revisit the properties of isophotal shapes and their relations with other galactic properties in early-type galaxies using a larger sample and images with excellent qualities.
The statistics of parameter are important for a variety of applications, for example gravitational lensing. Deviations from the pure ellipses can induce higher-order singularities such as butterflies and swallowtails, which can in turn produce sextuplet and octuplet images (Keeton, Mao & Witt 2000; Evans & Witt 2001). Evans & Witt (2001) estimated that perhaps per cent of galaxy-scale lenses are sextuplet and octuplet imaged systems. The study of a large and homogeneous sample of ellipticals and S0’s is important for providing sufficient statistics of the shapes of E/S0 galaxies, which dominate the lensing cross-section on galaxy scales.
In this paper, we use the Sloan Digital Sky Survey (SDSS) Data Release 4 (DR4) data of 847 nearby E/S0 galaxies to study the distributions of their isophotal parameters and the relations of isophotal shapes with other galactic properties. The SDSS survey provides high-quality photometry in five colours under typical seeings of about 1.5 arcseconds over a large area of the sky. In §2, we discuss how we select our sample of elliptical and S0 galaxies, outline the data reduction procedures and how we estimate the parameters that describe the shapes of E/S0 galaxies. The size of our sample is about a factor of 8 larger than that used by Bender et al. (1989). This large sample size allows us to consider more carefully how the shapes of galaxies are correlated with a variety of parameters, such as their velocity dispersions, luminosities, and colours. We also consider how their shapes are correlated with the environments. These results are presented in §3. We discuss our results in the last section (§4). Throughout this paper, we adopt a cosmology with a matter density parameter , a cosmological constant and a Hubble constant of .
2 Sample Selection and Data Analysis
2.1 Sample selection
Our sample objects are selected from the SDSS DR4 photometric catalogue. We select all objects according to the following criteria: (1) Their redshifts must be smaller than 0.05; this is to ensure sufficient spatial resolutions to resolve these galaxies. (2) The velocity dispersions cover a range of 200 to 420 . The latter is approximately the maximum velocity dispersion that can be measured reliably. (3) The target galaxies should not be saturated or located at the edge of the corrected frame (Stoughton et al. 2002). In total, there are 1102 galaxies satisfying the above three criteria. However, 11 of these 1102 objects are unavailable from the SDSS DR4 Data Archive Server. Furthermore, to ensure the early-type galaxy morphology of our sample, we visually examined all images and find 916 ( per cent) of them are E/S0 galaxies and not contaminated by companion galaxies or bright stars. To reduce the impact of dust on the photometry, objects with visible dust lanes are also excluded from our sample. As we will estimate the intensity-weighted Fourier coefficients and ellipticity, , (see 2.3) within a region from twice the seeing radius () to 1.5 times Petrosian half-light radius (), objects with are excluded from the following analyses. The -band seeing radius for each object is the effective PSF width determined at the center of each frame by the SDSS pipeline (Stoughton et al. 2002). However, in most cases, our objects are not located at the centres. Stoughton et al. (2002) pointed out that the PSF FWHM can vary by up to 15% from one side of a CCD to the other, even in the absence of atmospheric inhomogeneities. We tested the effect on isophotal parameters by enlarging the effective PSF width by 10% and found that the median differences for the weighted means of the , , , and ellipticity are 0.072, 0.15, 0.020, 0.030 and 2 times their corresponding errors respectively. The relatively large difference in ellipticity () between these two data sets is probably due to the monotonic ellipticity radial profiles for a large fraction of our sample objects and the small (formal) errors () in the ellipticity.
For our sample objects, the redshifts are low and thus should be corrected for the Local Group infall. We adopted the Local Group relative redshifts provided by Blanton et al. (2005) to calculate the luminosity distances. There are three objects without such information and another two with negative redshifts. These five objects are excluded from the following analyses. So our final catalogue includes 847 E/S0s.
2.2 Data reduction
2.2.1 Image reduction
We use the SDSS band images in this paper to perform isophotal analyses. The corrected frame obtained from SDSS is bias-subtracted, flat-fielded, and corrected for cosmic rays and pixel defects (Stoughton et al. 2002). Before surface photometry, sky background fitting and subtraction are performed (Wu et al. 2005). To do this, we detect all objects by SExtractor (Bertin & Arnouts 1996) and mask them to generate a background-only image. The sky background is obtained by fitting this image and then subtracted from the corrected frame. After background subtraction, the corrected frame is trimmed to a 501x501 frame which centres on the target.
SExtractor was then run on the trimmed frame to generate a “SEGMENTATION” image (See documents for SExtractor), which identifies all objects in the frame. A mask image with all detected objects except the galaxy of interest flagged can then be obtained from the “SEGMENTATION” image. We carefully examined all the mask images, and found that SExtractor performs satisfactorily for masking neighbour objects in most cases. For a few (five) rare cases that SExtractor did not work well, we carefully tuned the parameters in SExtractor to create good mask images. Surface photometry is performed on the trimmed image using the IRAF task ellipse (Jedrzejewski 1987) with the masked areas excluded from the fitting. This task requires some initial guesses for the geometric centre, ellipticity and position angle for the isophotes; these guesses are obtained by running SExtractor on the masked image. When running ellipse on the targets, we allow the geometric centre, ellipticity and position angle to vary freely and assume a logarithmic step of 0.1 in radius along the semi-major axis.
2.2.2 Isophotal shapes from Fourier analysis
In the literature, the isophotes of elliptical galaxies have been measured in two different ways, which we outline below.
-
1.
The first method first finds the isophote for a given surface brightness (by interpolation, for example). The isophote can be described by , where are the polar coordinates centred on the centre of an ellipse. In general, the isophote is not a perfect ellipse. The deviation of the isophote from a perfect ellipse can be expanded in Fourier series in the polar angle
(1) where describes the best-fitting ellipse, and is the average deviation averaged over the polar angle. The first five coefficients (, , , and ) should be zero within the errors as they are found from fitting. The lowest order significant deviations are etc.
-
2.
In the second method, an ellipse is drawn to approximately match an isophote. The intensity along the ellipse is then expanded in Fourier series
(2) where is the intensity averaged over the ellipse, and and are the higher order Fourier coefficients. If an isophote is a perfect ellipse, then all the coefficients, will be exactly zero.
The study by Bender et al. (1988) adopts the first approach while the IRAF task ellipse111IRAF is distributed by the National Optical Astronomy Observatories, which are operated by the Association of Universities for Research in Astronomy, Inc., under cooperative agreement with the National Science Foundation. adopts the second method. Ellipse outputs and divided by the semi-major axis length, , and the local gradient. In the Appendix we show that this essentially gives and parameters, as used by Bender et al. (1988, 1989). So our results can be directly compared with those of Bender et al. (1988, 1989).
2.3 Estimates of parameters
The characteristic size (Petrosian half-light radius here), velocity dispersion and apparent Petrosian magnitude of galaxies are derived from the DR4 photometric catalogue. SDSS defines the Petrosian ratio at a radius from the centre of an object to be the ratio of the local surface brightness in an annulus at to the mean surface brightness within (Blanton et al. 2001; Stoughton et al. 2002):
| (3) |
where is the azimuthally averaged surface brightness profile. The Petrosian radius is defined as the radius at which equals 0.2. The Petrosian flux in any band is then defined to be the flux within two Petrosian radii:
| (4) |
The Petrosian half-light radius is the radius within which 50 per cent of the Petrosian flux is contained. The Petrosian quantities provided by SDSS are derived using circular apertures. For galaxies with large ellipticities, this will give a different compared with that using elliptical apertures. However, the adoption of circular apertures will not affect our results statistically as there are few very elliptical galaxies in our sample (Fig. 3). To be more quantitative, we calculated the Petrosian using elliptical apertures for some sample objects. Even for the most elliptical galaxies in our sample, the difference between circular and elliptical Petrosian is only up to 13%. Such a small change in will not change our results significantly (see below).
We derived the absolute Petrosian magnitude from the apparent Petrosian magnitude and the extinction () in each filter provided by SDSS DR4 photometric catalogue by . As the redshift of our sample is low () and the range of the redshift is small (from 0.01 to 0.05), no k-correction is applied here. Using the k-corrections (corrected to ) provided by Blanton et al. (2005; see also Blanton et al. 2003), we find that the median and maximum k-corrections in the -band for our sample objects are 0.04 and 0.06 mag respectively, and hence this should not affect our results significantly.
As the velocity dispersion provided by SDSS is that in the 3 fiber aperture, we correct it to a standard circular aperture defined to be one-eighth Petrosian half-light radius similar to Bernardi et al. (2003a). It should be noted that Bender et al. (1988, 1989) used the effective radius (half-light radius) from de Vaucouleurs law fitting as the characteristic size of a galaxy. We use the Petrosian half-light radius since it is a well defined quantity, while in contrast, the derivation of effective radius depends on how well the de Vaucouleurs law fits the surface brightness profile, the range of radius used in the fit (see Bender et al. 1989 and references therein) and how well the sky background is subtracted in the photometry.
Isophotal surface photometry can provide the structural parameters, such as Fourier coefficients (, , , ), ellipticity and position angle (PA) in each elliptic annulus, where is the length of the semi-major axis of the fitted ellipse.
In this paper, we mainly study isophotes using quantities averaged over intensities or those at one or one and a half Petrosian half-light radii. Note that the radial profiles of isophotal parameters we used here are along the geometric mean radius, , where and are the lengths of semi-major and semi-minor axes of a fitted ellipse. To be more specific, the characteristic values of Fourier coefficients and ellipticity are calculated by weighting them with the intensity (counts) in the isophote and inversely with their RMS errors over a region of 2 to 1.5. This is similar to that of Bender et al. (1988), who used the mean and between twice the seeing radius and 1.5 effective radii. Note, however, that Bender et al. (1988, 1989) used a different definition of characteristic ellipticity – They adopted the peaked value for a peaked ellipticity radial profile and the ellipticity at the effective radius in case of a monotonically increasing or decreasing ellipticity radial profile. The changes in , , ellipticity, PA and the centres of ellipses between and are also estimated. The standard deviations of these quantities are calculated by error propagation. As expected, fainter objects have larger errors than the brighter ones. All the data are available online 222http://www.jb.man.ac.uk/~smao/isophote.html.
The surface brightness profiles of E/S0’s are often fitted with the Sérsic profile (Sérsic 1968). From the fitting, it is possible to obtain the sérsic index and a sérsic effective radius within which half of the light is contained. Blanton et al. (2005) also gave the sérsic index and in their tables. We compared the SDSS Petrosian and the sérsic given by Blanton et al. (2005) and found that they differ by 14 per cent on average. Blanton et al. (2005) argued that their sérsic is underestimated by 10 per cent for large sizes and high sérsic indices. We thus enlarged the Petrosian half-light radius by 25 per cent and re-computed the isophotal parameters and compared them with those derived by SDSS Petrosian . The average differences between these two sets of data are 0.016, 0.023, 0.0045, 0.0073 and 1.76 times the standard deviations for the weighted means of the , , , and ellipticity; the median difference between these two data sets for the above five parameters are respectively 0, 0, 0.0066, 0.0049 and 0.67, so our results are quite robust with respective to small uncertainties in . The relatively large difference in ellipticity (average and median ) is possibly due to the monotonic ellipticity radial profiles for a large fraction of our sample objects and the small (formal) errors () in ellipticity.
3 Results
3.1 Sample properties
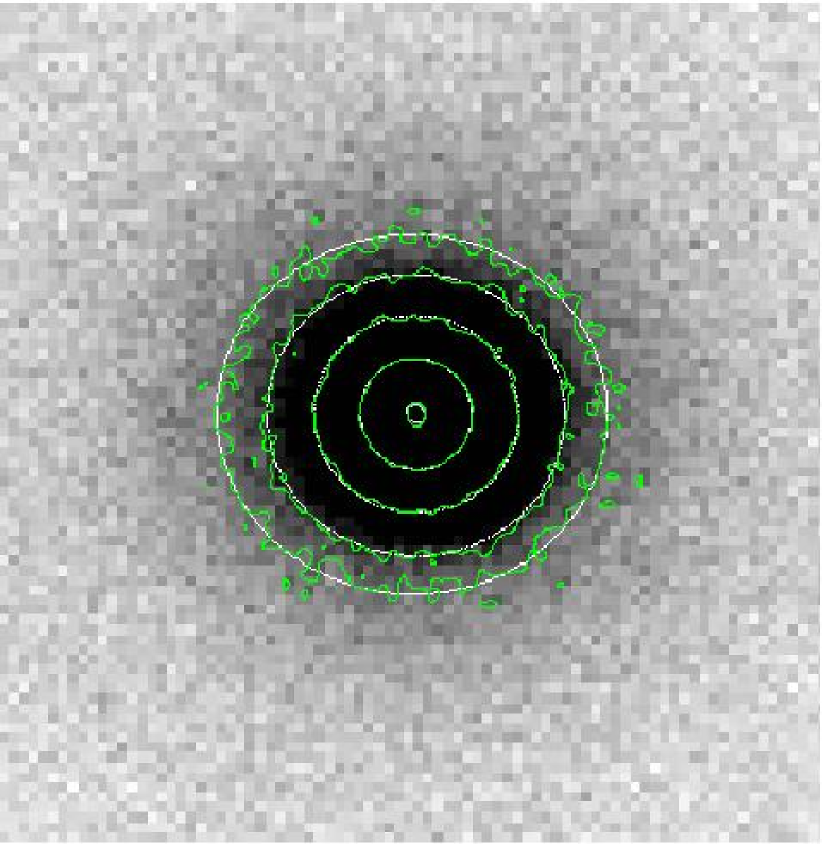

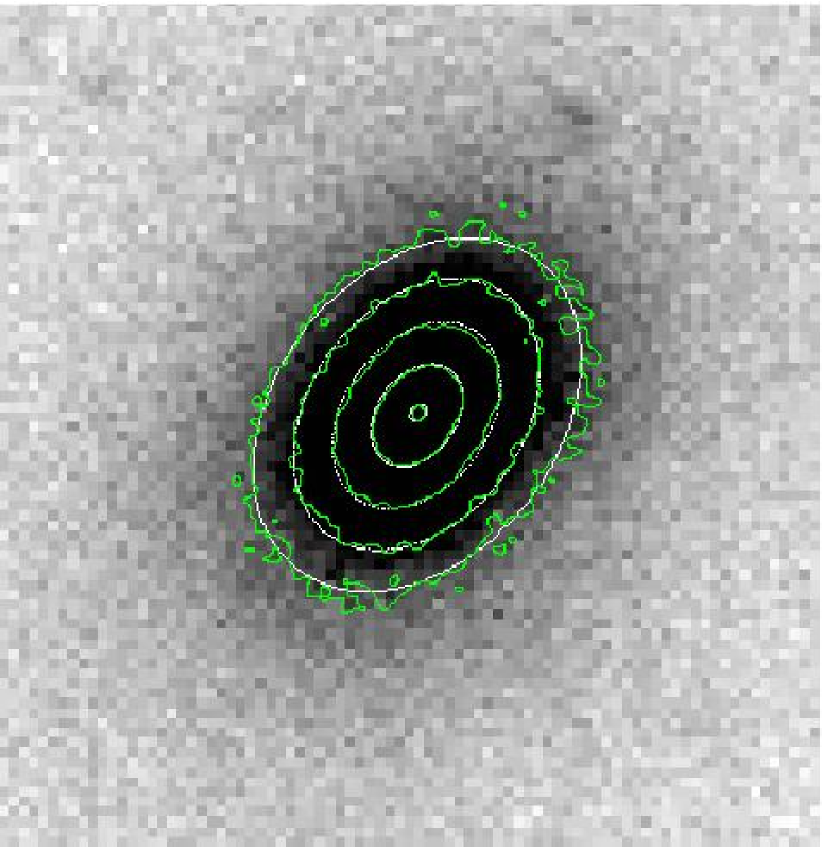
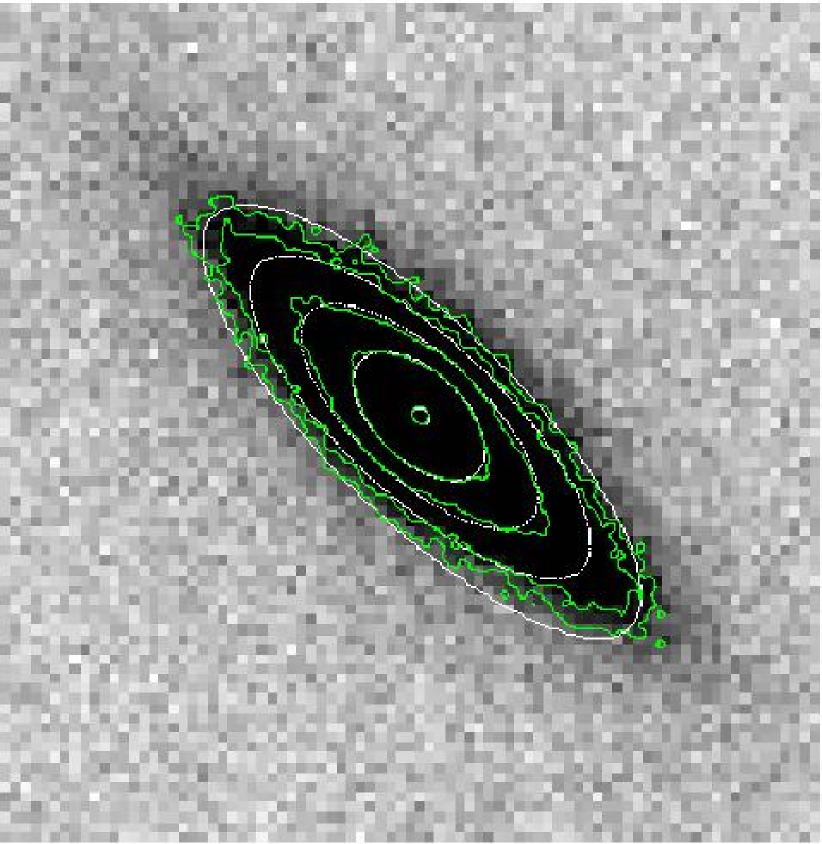
Fig. 1 shows images for four of our sample galaxies. The top left and right panels show one nearly round and one very flattened ellipticals; both of which can be fitted by ellipses within noises. The bottom two panels show one example of a boxy elliptical and a discy elliptical respectively. It is clear that ellipticals and S0’s can be reasonably fitted by ellipses but also show significant deviations. Below we first study some basic properties of our sample.
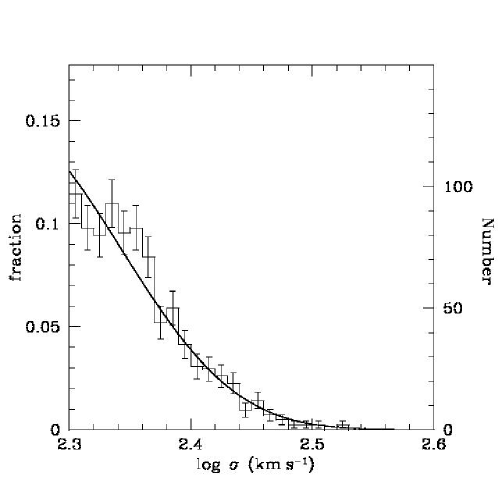
The histogram of velocity dispersion () for our sample is shown in Fig. 2. The solid line shows the velocity dispersion function derived by Sheth et al. (2003) from an analysis of a large sample of galaxies from the SDSS, carefully accounting for the selection effects and measurement errors. Our histogram matches the Sheth et al. curve reasonably well except at the small dispersion end, where our sample seems to show a small deficit but still within error bars. The reasonable match between our sample and the Sheth et al. curve indicates our sample does not have a strong bias regarding to the velocity dispersion. As the luminosity is correlated with the velocity dispersion through the Faber-Jackson relation (Faber & Jackson 1976; Bernardi et al. 2003b), we do not expect our sample to be significantly biased with respect to the luminosity (or magnitude).
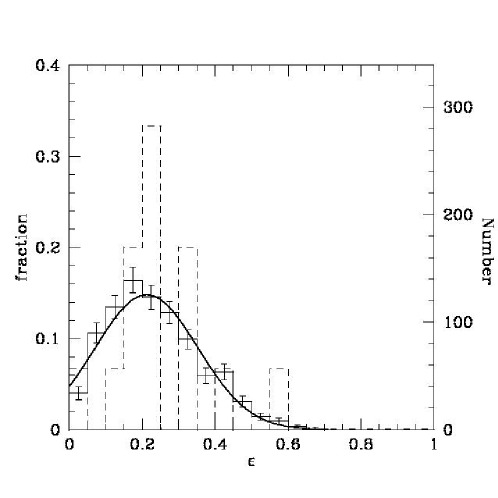
The ellipticity distribution for our sample is shown in Fig. 3. The distribution shows a peak around and drops off sharply above (correspond to an E5 elliptical). The mean and dispersion in the ellipticity are 0.23 and 0.13 respectively. Our distribution appears to show smaller ellipticities than the one shown in Lambas, Maddox & Loveday (1992) based on the APM survey which uses photographic plates. Their distribution peaks around and drops off sharply above . As they adopted a different definition of ellipticity (their equations 1 and 2), we used similar quantities as provided by SDSS (See Kuehn & Ryden 2005 for details) to examine the ellipticity distribution. The distributions of these two ellipticities in the SDSS data are very similar. Therefore, the difference between our sample and theirs is not due to different definitions of ellipticity; it is not clear what causes it. However, our ellipticity distribution is in very good agreement with Fasano & Vio (1991), who used CCD images of elliptical galaxies. The differential probability distribution of the ellipticity can be well fitted by a Gaussian:
| (5) |
where the dispersion . This fit is shown as the solid curve in Fig. 3. The ellipticity distribution (dashed histogram) of the lens galaxy sample of Koopmans et al. (2006) is shown for comparison in the same Figure. The Kolmogorov–Smirnov test indicates a probability of 58.6 per cent that the two samples are drawn from the same parent distribution (for more see the discussion).
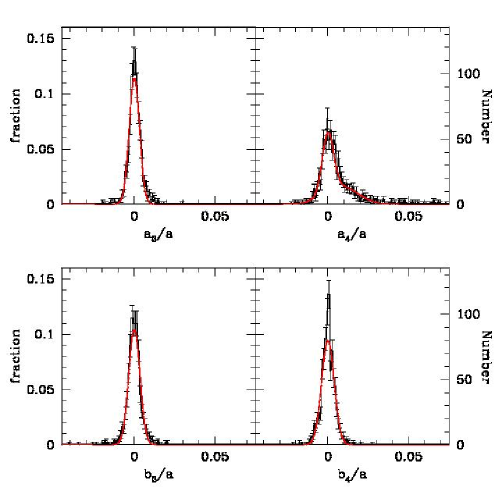
The histograms of , , and are shown in Fig. 4. The distributions of , and are reasonably fitted by a single standard Gaussian with zero means and dispersions of 0.0032, 0.0035 and 0.0039 respectively. The histogram for , on the other hand, shows more asymmetries, particularly toward the positive indicating an excess of discy E/S0s compared to boxy E/S0s. The distribution of can be reasonably fitted by the sum of two Gaussian functions (The normalized per degree of freedom is 0.81, where the errors are taken as Poisson errors):
| (6) |
where , , and .
3.2 Correlations with galaxy properties
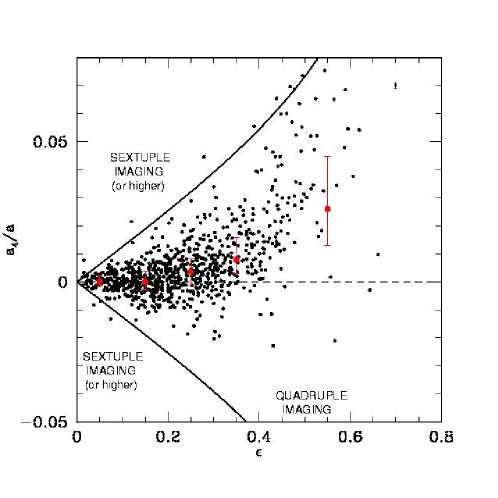
Fig. 5 shows how varies as a function of the mean ellipticity, . It is clear that when , the isophotes show significant systematic deviations from perfect ellipses, with the parameter reaching 0.08 or so. As the ellipticity is both a function of the intrinsic shape and the viewing angle along the line of sight, this trend indicates that E/S0s, when viewed edge on, are more likely to show significant deviations from perfect ellipses.
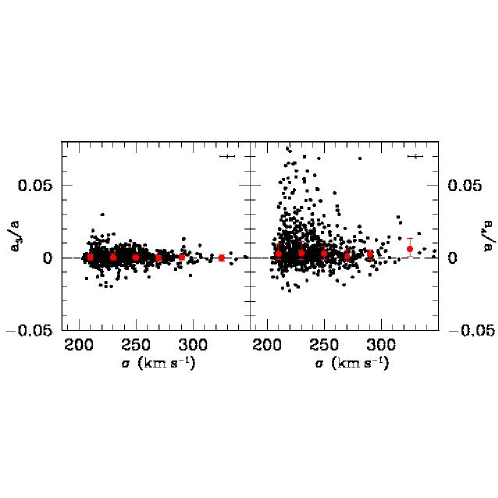
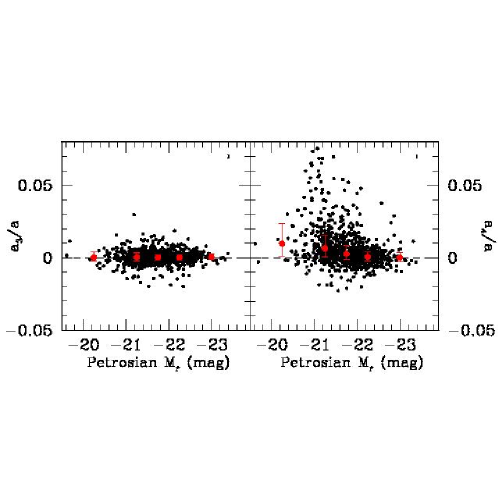
Fig. 6 shows how the and parameters vary as a function of the velocity dispersion, . There is no significant trend for the parameter. For the parameter, there seems to be a slight indication that at small velocity dispersions (), there are more E/S0s with significant non-zero parameters, around 0.05. This indicates a weak trend that more massive ellipticals may have less significant deviations from perfect ellipses. The trend of parameter as a function of -band absolute magnitude is similar to that of versus . The correlation between and the band absolute magnitude is more significant (Fig. 7). The Spearman-Rank Order correlation coefficient and the probability that no correlation exists for vs. , vs. , vs. , and vs. are and respectively. Among these correlations, the relation between and , the band absolute magnitude, is most significant; the fraction of boxy galaxies increases with increasing luminosity. The relations between , and the dynamical mass, defined as (Bender et al. 1989), are similar to those with the band absolute magnitude.
Faber et al. (1997) concluded that galaxies with have ‘core’ luminosity profile, those with have ‘power-law’ luminosity profile and at intermediate (with ) magnitudes, ‘core’ and ‘power-law’ coexist. Many studies (e.g., Rest et al. 2001) indicated that ‘core’ galaxies are more luminous, slowly rotating and boxy systems while ‘power-law’ galaxies are less luminous, fast rotating and discy systems. Therefore, it is interesting to estimate quantitatively the relative number of discy and boxy E/S0s in these magnitude intervals. We use the prescription of given by Smith et al. (2002) to transform the -band magnitude into the -band magnitude for our sample objects. Using our isophotal analysis results, we find that the ratios of the number of discy to boxy E/S0s in these magnitude intervals (, and ) are 2.8 (28/10), 2.09 (466/223) and 1.07 (62/58) respectively. These numbers show that the largest fraction of boxy E/S0s is in the brightest subsample, while the number of discy E/S0s increases relative to boxy E/S0s at the faint end.
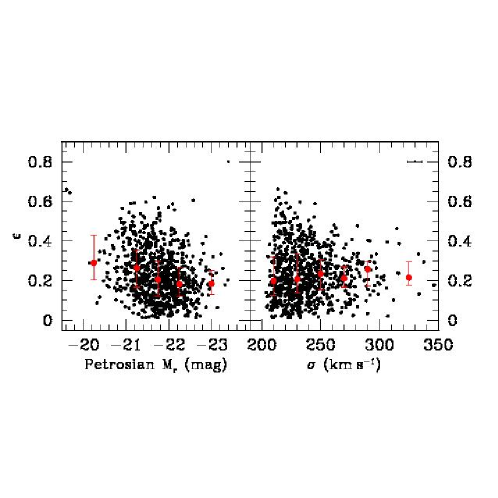
Fig. 8 shows the mean ellipticity, , as a function of the band absolute magnitude and velocity dispersion. The data points with error bars show the median values and the lower (25 per cent) and upper (75 per cent) quartiles of in bins of absolute magnitude (left panel) and velocity dispersion (right panel). In many places in this paper, we quote the median and lower and upper quartiles as they are less sensitive to outliers (we sometimes also quote the usual mean and standard deviation value). As can be seen from the left panel, the ellipticities of E/S0s are correlated with the absolute magnitudes, although with large scatters: E/S0s become rounder with increasing luminosities, which is consistent with Vincent & Ryden (2005). In contrast, the ellipticities of E/S0s show no significant correlation with their velocity dispersions. Quantitatively, a Spearman–Rank Order correlation analysis gives a correlation coefficient of 0.26 at per cent significance level for versus band absolute magnitude, while for versus velocity dispersion, the correlation coefficient is 0.035 at a significance level of 69.2 per cent. We also find that the mean ellipticity has a strong correlation with the dynamical mass, with a correlation coefficient of 0.27 at per cent significance level.
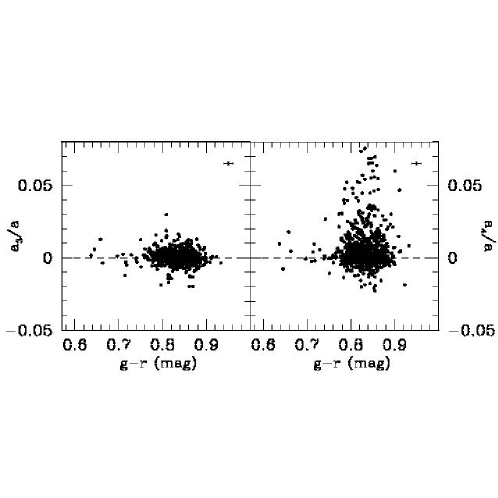
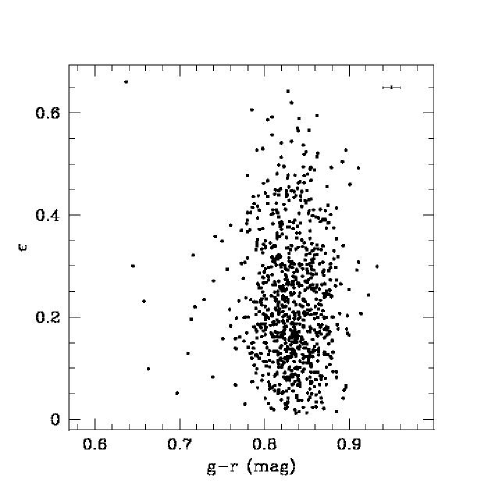
Fig. 9 shows and versus the colour. Neither shows any strong correlation. Furthermore, Fig. 10 shows that the mean ellipticities of galaxies also have virtually no correlation with their colours.
It appears somewhat puzzling why both the mean ellipticity and are significantly correlated with -band absolute magnitude while they do not correlate with the colour or velocity dispersion, as if ellipticals/S0’s follow the colour-magnitude relation and the Faber-Jackson relation (). However, these may be explained by the large scatters in these correlations – mean ellipticity versus (Fig. 8), versus (Fig. 7), colour-magnitude relation (e.g., Chang et al. 2006) and the Faber-Jackson relation (e.g., Bernardi et al. 2003b). Our sample selection criterion may also be partly responsible for the absence of correlations of the mean ellipticity and with velocity dispersion since our velocity dispersion is restricted to within a factor of two (§2.1).
Ryden et al. (2001) found that the ages of elliptical galaxies are correlated with their ellipticities and luminosity profiles (‘core’ or ‘power-law’). We cross-correlate our sample objects with DR4 catalogue generated by Kauffmann et al. (2003) and find 345 objects in common. They derived the age using a Bayes method by exploring the Dn(4000), H and a library of star formation histories generated by the stellar population synthesis code provided by Bruzual & Charlot (2003; See Kauffmann et al. 2003 for details). We used here the median estimates of the -band weighted mean stellar age in their table. However, no strong correlations are found between the age versus ellipticity and .
As mentioned before, the sérsic index from surface brightness fitting is available from Blanton et al. (2005). We correlated this parameter with other isophotal parameters. No correlation was found between and . However, there appears to be a correlation between and : the Spearman-Rank Order correlation coefficient is and the probability that no correlation exists between these two parameters is only 0.24 per cent. Galaxies with large sérsic index tend to have smaller deviations from perfect ellipses. There is also a weak trend that more flattened (i.e. larger ellipticity) galaxies have smaller values of , but the scatter is quite large.
3.3 Isophotal twists
It is well known that isophotes in elliptical galaxies are not concentric ellipses as a function of radius. In this subsection, we concentrate on the changes of isophotes from one to one and a half Petrosian half-light radii ().
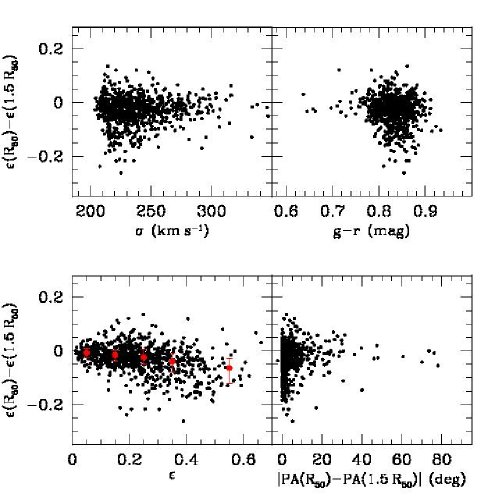
Fig. 11 shows the change of ellipticity as a function of the velocity dispersion, colour, mean ellipticity, and the difference in the position angle between and . There is no strong correlation between the change and either velocity dispersion, colour or the change in position angle. There is however a correlation between the mean ellipticity and the ellipticity change, with Spearman-Rank Order correlation coefficient at a significance level of per cent. Elliptical galaxies with higher ellipticities tend to have a more negative value of . This implies that the isophotes in the most elliptical galaxies become more flattened as one goes to larger radii.
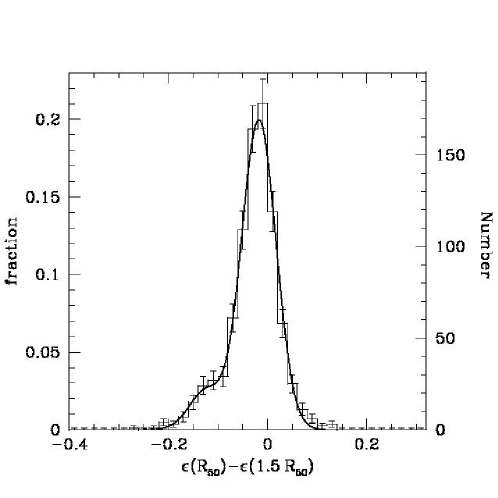
Fig. 12 shows the histogram of the ellipticity change, . The mean change in ellipticity is about and the scatter is about 0.051. The differential probability distribution can be well-fitted by the sum of two Gaussians:
| (7) |
where , , , and . This fit is shown as the solid curve. The second peak is due to the galaxies with high ellipticities (see the bottom left panel of Fig. 11).
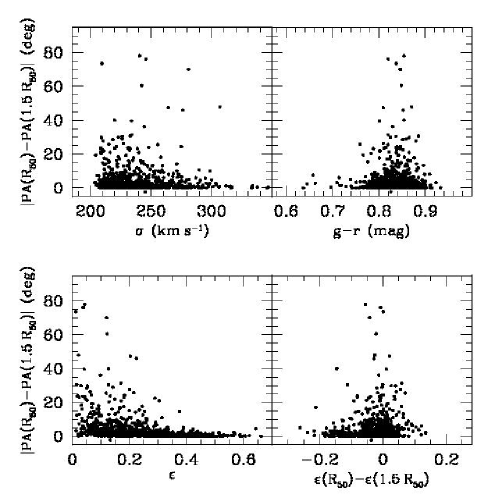
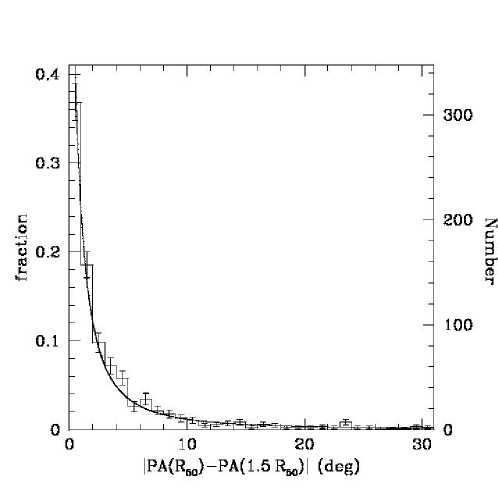
Fig. 13 shows the change of position angle as a function of the velocity dispersion, colour, mean ellipticity, and the difference in ellipticity between and 1.5. In this case, there is no strong correlation with all these quantities. Fig. 14 shows the histogram of the changes of the position angles. The differential probability distribution can be well fitted by a power-law
| (8) |
where and . The median value of is . In contrast, the mean change in position angle is much larger, about and the standard deviation is about . The large standard deviation is due to an extended tail in .

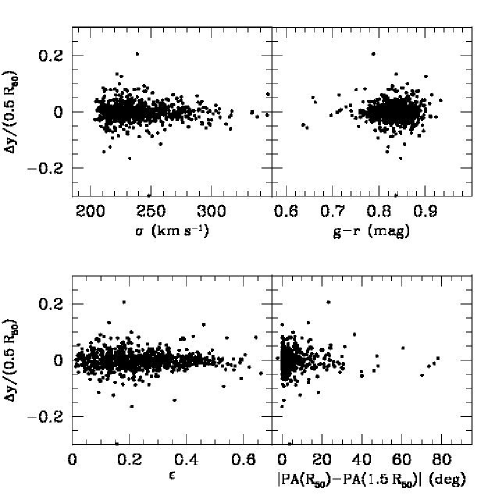
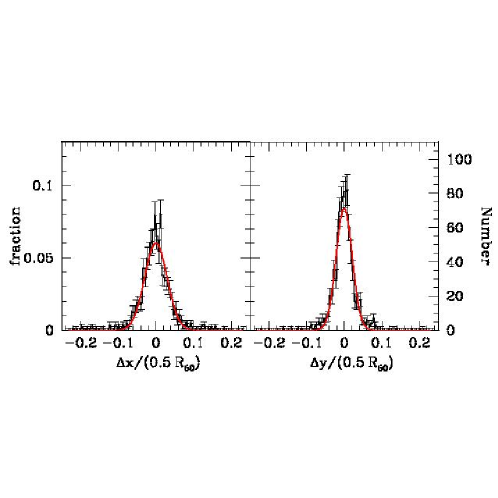
Figs. 15 and 16 show the changes of the centres of ellipses along the major (x) and minor (y) axes as a function of velocity dispersion, colour, mean ellipticity and the difference in position angle between and . There is no significant correlation among these quantities. The histograms of the changes of the centres of ellipses are shown in Fig. 17. The differential probability distribution can be fitted by a standard Gaussian with zero means and and respectively. The centroid shifts are hence small, only a few percent of the Petrosian half-light radius.
3.4 Radio properties of elliptical galaxies
We search the radio counterparts of our early-type galaxies using the FIRST (Becker, White & Helfand 1995) and NVSS (Condon et al. 1998) catalogues. The NVSS and FIRST surveys provide an angular resolution (beam size) of 45 and 5 respectively. However, the centroids can be determined much more accurately and the accuracy scales roughly as . We adopt a conservative cross-correlation radius between the radio catalogue and our sample objects. We found 162 counterparts for FIRST within a 5 cross-correlation radius and 130 for NVSS galaxies within a 20 cross-correlation radius.
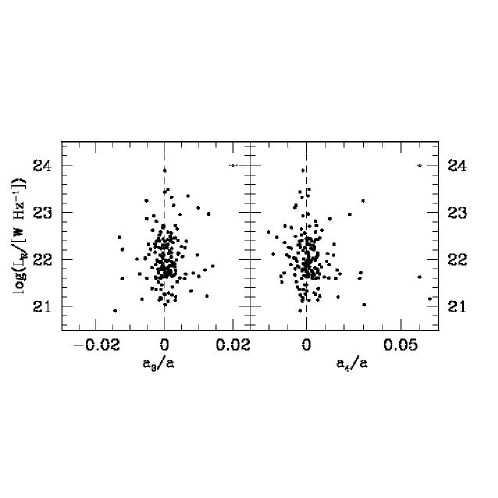
As the position accuracy for FIRST is higher, here we only present the results for the objects cross-correlated from FIRST and SDSS. Fig. 18 shows the 1.4GHz FIRST peak luminosity as a function of the parameter and parameter. There is no trend between the radio power and the parameter. For the parameter (shown in the right panel), there appears to be a lack of galaxies at the top right corner. (The trend is similar for the 1.4GHz FIRST integrated luminosity versus .) Thus we confirm the trend found by Bender et al. (1989) that discy ellipticals (with ) are weaker radio emitters than their boxy counterparts, although there are much less fainter radio emitters in our sample compared to Bender et al. (1989) because of the larger redshift in our sample relative to theirs.
3.5 Correlations with environment
Di Tullio (1979) found that the ellipticity of isolated ellipticals on average decreases as a function of radius, while for ellipticals in clusters and groups, the ellipticity can either increases, decreases or peaks. This conclusion was based on photographic plates for 75 ellipticals in clusters, groups, pairs and isolated galaxies. More recently, using the SDSS data, Kuehn & Ryden (2005) concluded that as the local density of galaxies increases, galaxies with de Vaucouleurs profiles become rounder in the magnitude range of . On the other hand, for the most luminous galaxies (), galaxies become rounder in the inner regions, but exhibit no change in their outer regions as the local density of galaxies increases. Shioya & Taniguchi (1993) used 96 galaxies in Bender et al. (1989) to study the isophotal shape-environment relation and found that boxy-type galaxies favor the dense environments while discy-type galaxies prefer the field environments.
In this paper, following Kuehn & Ryden (2005), we use a measure of the local density as the number of galaxies within a cylinder in the redshift space. The depth of the cylinder (centred on a target) is , and we vary the radius of the cylinder from to , where . According to Kuehn & Ryden (2005), if a target galaxy is within one cylinder width of the SDSS spectroscopic survey border, it is removed from the analyses. The radii of the cylinders we adopted above are smaller than those used by Kuehn & Ryden (2005) because if we adopt their larger values (e.g., ), too few galaxies would be left because our sample galaxies are at lower redshift and so the boundary effects discussed above would exclude too many galaxies. Following Kuehn & Ryden (2005), we define a volume limited sample which is selected from SDSS DR4 catalogue by constraining the spectral redshift smaller than 0.055. For these objects, we also adopt redshifts corrected for the Local Group infall provided by Blanton et al. (2005). As the maximum redshift of our sample galaxies is 0.05 and the limiting apparent magnitude of the spectroscopic survey is , the corresponding absolute magnitude is . We use the number counts of galaxies with within a cylinder of the target galaxy as an indicator of the local density. This is only an approximate measure of the local environment, due to the effects of fiber collisions (see Kuehn & Ryden 2005 for detailed discussions) and redshift distortions. But it is sufficient for our purpose. For brevity, we term galaxies without neighbours in the cylinder as ‘isolated’ galaxies.
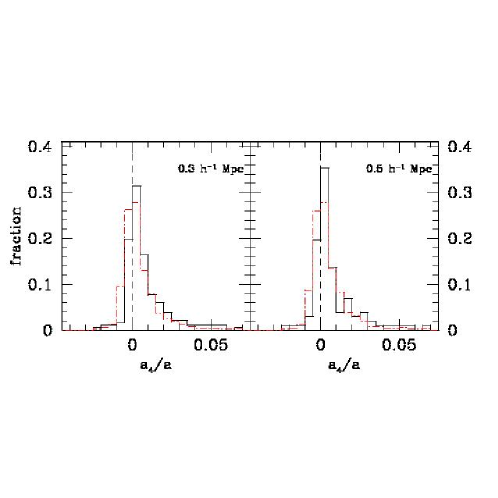
Fig. 19 shows the distribution for ‘isolated’ galaxies (solid curve) and galaxies with neighbour (dot-dashed curve). The left and right panels are for a cylinder with radius of and respectively. We can see that the fraction of discy galaxies is larger in isolated environments. Quantitatively, for cylinders with radii of (left panel) and (right panel), the ratios of the number of discy to boxy E/S0s in ‘isolated’ environments are 3.14 (138/44) and 2.92 (76/26) respectively. In contrast, for galaxies with neighbours, the corresponding ratios are 1.63 (381/234) and 1.72 (386/225). Clearly discy E/S0s are more abundant in isolated environments, in agreement with the conclusion of Shioya & Taniguchi (1993). The Kolmogorov–Smirnov test indicates a probability of 99.9 (90.2) per cent that the two samples are different for cylinders with radii of ().
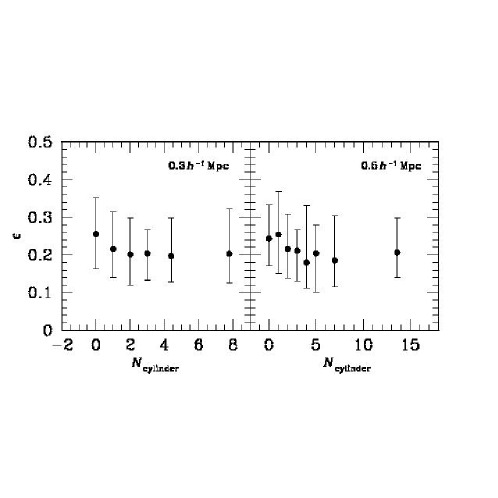
The change of ellipticity as a function of the local density is shown in Fig. 20. There seems no correlation between the change of ellipticity and the local density. This result is not consistent with Di Tullio (1979). His sample based on photographic plates may be too small to be statistically convincing. Reda et al. (2004) presented the ellipticity profiles for 14 isolated early-type galaxies (their fig. 4); their results also do not support the conclusion of Di Tullio (1979). Fig. 21 shows the mean ellipticity as a function of the local density, a plot similar to figs. 6 and 7 in Kuehn & Ryden (2005). Qualitatively, our results are consistent with Kuehn & Ryden (2005).
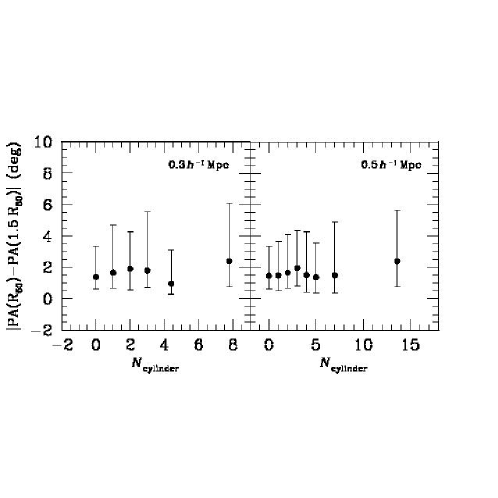
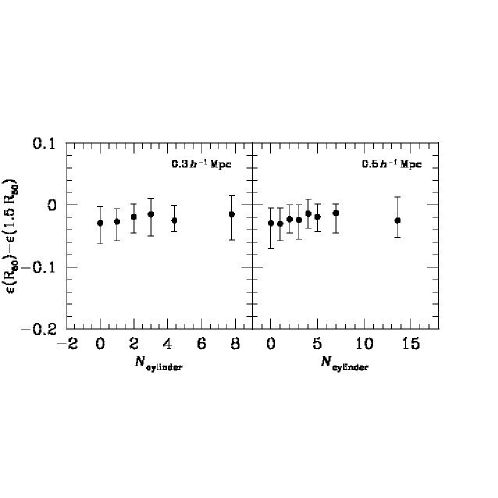
As isophotal twists may be caused by external perturbations, we examined the isophotal twist - local density relation in Fig. 22. However, there is no correlation found. Alternatively, we also examined the ratio of the number of E/S0s with large PA changes between and 1.5 to that of E/S0s with small PA changes for isolated galaxies and galaxies with neighbours. The results show that the fraction of E/S0s with large PA changes is slightly larger for galaxies with neighbours than that for isolated galaxies.
4 Conclusions and Discussions
In this paper, we studied the shapes of isophotes for a sample of 847 nearby E/S0 galaxies selected from the SDSS DR4 catalogue. We derived the distributions of the intensity-weighted ellipticity and Fourier coefficients and also studied the changes in the isophote shapes between one and one and a half Petrosian half-light radii. For many of these distributions, we provide empirical fitting formulas of the data, which may be useful for comparisons with theoretical studies. We further examined many possible correlations between the isophote shapes and physical properties of E/S0 galaxies. Our main conclusions are the following:
-
1.
The mean ellipticity of galaxies is about 0.23 with a scatter of 0.13. This is somewhat narrower than the distribution found by Lambas et al. (1992). The intensity-weighted mean ellipticity shows no strong correlation with either the velocity dispersion or the colour. However, it is correlated with the band absolute magnitude and dynamical mass. These correlations indicate that the more luminous (massive) E/S0s are rounder than the fainter (less massive) ones.
-
2.
The most significant deviation of the isophotes from ellipses is the parameter determined from Fourier series. This parameter shows no significant correlation with colour and velocity dispersion. It is, however, correlated with the band absolute magnitude, in agreement with Bender et al. (1989). As the luminosity decreases, the number of discy E/S0’s increases relative to boxy ones. The parameter is also strongly correlated with the mean ellipticity (Fig. 5). E/S0’s with higher ellipticities tend to show stronger deviations in isophotes from perfect ellipses. They can become either more discy or more boxy. This suggests that the isophotes are likely a function of viewing angle – edge-on ellipticals will show stronger deviations from ellipses.
-
3.
Our studies on the relation between isophote shapes and environments show that discy E/S0s favor field environments while boxy E/S0s prefer dense environments, in agreement with Shioya & Taniguchi (1993). The changes of ellipticity and position angle with radius, however, have no significant correlations with the environments.
-
4.
We confirm the results of Bender et al. (1989) that discy ellipticals tend to lack powerful radio emitters (Fig. 18), although the trend is not dramatic.
-
5.
The changes in ellipticity and position angle between one and one and a half Petrosian half-light radii show no correlations with galaxy properties, except that the change in ellipticity is correlated with the mean ellipticity (see Fig. 11). E/S0 galaxies with larger ellipticities become more flattened at large radii. The median change in the ellipticity and position angle is about 0.023 and respectively. The change in the position angle has a significant tail.
Gravitational lensing can be used to probe the shape of total matter distribution in intermediate redshift galaxies. Yoo et al. (2006) derived the limits for four lensing systems, SDSS J0924+0219, HE 0435-1223, B 1938+666, and PG 1115+080. The upper limits on are 0.023, 0.019, 0.037 and 0.035, and are 0.034, 0.041, 0.051, 0.064 respectively for these galaxies. Our study can only constrain the shape of stellar matter distribution. Nevertheless, Fig. 4 shows that the vast majority of our elliptical galaxies satisfy these constraints as long as the dark matter distribution does not show more significant deviations from the elliptical distributions. It is interesting to note that in Fig. 3 the ellipticity distribution (dashed histogram) of the lens galaxies (selected largely by mass) are consistent with our luminosity-selected sample. The number of lenses in the Koopmans et al. study is only 15, so is still somewhat small to draw stronger conclusions. Another effect of gravitational lensing is that deviations from perfect ellipses can cause uncommon lensing configurations, such as sextuplet and octuplet imaging. The solid curves in Fig. 5 show the critical lines for forming sextuplet lenses (eq. [32] in Evans & Witt 2001). There are only 11 galaxies that fall outside the critical lines (and one almost on the line). Hence if mass roughly follows light and there is no significant evolution in shapes of ellipticals as a function of redshift (see Pasquali et al. 2006), then the fraction of galaxies that can produce more than 4 images will be of the order of per cent. However, the magnification bias (e.g., Turner, Ostriker & Gott 1984) for these systems is likely somewhat higher, bringing the fraction somewhat higher. So far, about 100 gravitational galaxy-scale lenses are known, and only one system shows six images due to a compact group of galaxies (B1359+154, Rusin et al. 2001). Currently the number of known lenses () is too small to allow a definitive comparison.
Hydrodynamical simulations of galaxies cannot yet simulate individual elliptical galaxy realistically (see, e.g. Meza et al. 2003 for an attempt), let alone the population as a whole. The statistical results we obtained in this paper can serve as a comparison sample for future numerical simulations. An intermediate, and profitable step is to use collisionless simulations of disk galaxy mergers to study the isophotal shapes (Naab & Burkert 2003; Jesseit, Naab & Burkert 2005). Naab & Burkert (2003) ran 112 merger simulations with mass ratios of 1:1, 2:1, 3:1 and 4:1. Their 1:1 disk galaxy mergers can reproduce the boxy ellipticals, but most of the simulated ellipticals have whatever the mass ratio (see their fig. 6), so it will be difficult to reproduce the most discy E/S0s (), about 5.9 per cent of our sample galaxies. Their origin remains unclear. Perhaps the inclusion of dissipation can remedy this situation.
Weil & Hernquist (1996) argued that pair and multiple merger remnants (e.g., from groups) show differences in both spatial and kinematic properties. In particular, they found that multiple merger remnants are more likely to appear nearly round from many viewing angles. If the multiple mergers produce more luminous ellipticals, then this would predict a correlation between the luminosity and the ellipticity. Fig. 8 shows that there is indeed some correlation between the luminosity and dynamical mass versus ellipticity. It would be interesting to further explore these correlations with more simulations.
Acknowledgments
We thank Drs. Ivo Busko, Neal Jackson, Frederick Kuehn, Zhengyi Shao and Laura Ferrarese for helpful discussions. Thanks are also due to the anonymous referee for constructive comments that improved the paper. This project is supported by the NSF of China 10333060 and 10273012. SM acknowledges partial travel support from the Chinese Academy of Sciences and a visiting professorship from Tianjin Normal University.
Funding for the SDSS and SDSS-II has been provided by the Alfred P. Sloan Foundation, the Participating Institutions, the National Science Foundation, the U.S. Department of Energy, the National Aeronautics and Space Administration, the Japanese Monbukagakusho, the Max Planck Society, and the Higher Education Funding Council for England. The SDSS Web Site is http://www.sdss.org/. The SDSS is managed by the Astrophysical Research Consortium for the Participating Institutions. The Participating Institutions are the American Museum of Natural History, Astrophysical Institute Potsdam, University of Basel, Cambridge University, Case Western Reserve University, University of Chicago, Drexel University, Fermilab, the Institute for Advanced Study, the Japan Participation Group, Johns Hopkins University, the Joint Institute for Nuclear Astrophysics, the Kavli Institute for Particle Astrophysics and Cosmology, the Korean Scientist Group, the Chinese Academy of Sciences (LAMOST), Los Alamos National Laboratory, the Max-Planck-Institute for Astronomy (MPIA), the Max-Planck-Institute for Astrophysics (MPA), New Mexico State University, Ohio State University, University of Pittsburgh, University of Portsmouth, Princeton University, the United States Naval Observatory, and the University of Washington.
References
- Becker et al. (1995) Becker R. H., White R. L., Helfand D. J., 1995, ApJ, 450, 559
- Bender & Möllenhoff (1987) Bender R., Möllenhoff C., 1987, A&A, 177, 71
- Bender et al. (1988) Bender R., Döbereiner S., Möllenhoff C., 1988, A&AS, 74, 385
- Bender et al. (1989) Bender R., Surma P., Döbereiner S., Möllenhoff C., Madejsky R., 1989, A&A, 217, 35
- Bernardi et al. (2003a) Bernardi M. et al., 2003, AJ, 125, 1817 (2003a)
- Bernardi et al. (2003b) Bernardi M. et al., 2003, AJ, 125, 1849 (2003b)
- Bertin & Arnouts (1996) Bertin E., Arnouts S., 1996, A&AS, 117, 393
- Blanton et al. (2001) Blanton M. R. et al., 2001, AJ, 121, 2358
- Blanton et al. (2003) Blanton M. R. et al., 2003, AJ, 125, 2348
- Blanton et al. (2005) Blanton M. R. et al., 2005, AJ, 129, 2562
- Bruzual & Charlot (2003) Bruzual G., Charlot S., 2003, MNRAS, 344, 1000
- Chang et al. (2006) Chang R. X., Gallazzi A., Kauffmann G., Charlot S., Ivezić Ž., Brinchmann J., Heckman T. M., 2006, MNRAS, 366, 717
- Condon et al. (1998) Condon J. J., Cotton W. D., Greisen E. W., Yin Q. F., Perley R. A., Taylor G. B., Broderick J. J., 1998, AJ, 115, 1693
- di Tullio (1978) di Tullio G., 1978, A&A, 62, L17
- di Tullio (1979) di Tullio G., 1979, A&AS., 37, 591
- Evans & Witt (2001) Evans N. W., Witt H. J., 2001, MNRAS, 327, 1260
- Faber & Jackson (1976) Faber S. M., Jackson R. E., 1976, ApJ, 204, 668
- Faber et al. (1997) Faber S. M., et al., 1997, AJ, 114, 1771
- Fasano & Vio (1991) Fasano G., Vio R., 1991, MNRAS, 249, 629
- Ferrarese et al. (1994) Ferrarese L., van den Bosch F. C., Ford H. C., Jaffe W., O’Connell R. W., 1994, AJ, 108, 1598
- Jedrzejewski (1987) Jedrzejewski R. I., 1987, MNRAS, 226, 747
- Jesseit et al. (2005) Jesseit R., Naab T., Burkert A., 2005, MNRAS, 360, 1185
- Kauffmann et al. (2003) Kauffmann G., et al., 2003, MNRAS, 341, 33
- Keeton et al. (2000) Keeton C. R., Mao S., Witt H. J., 2000, ApJ, 537, 697
- Khochfar & Burkert (2005) Khochfar S., Burkert A., 2005, MNRAS, 359, 1379
- Koopmans et al. (2006) Koopmans L. V. E., Treu T., Bolton A. S., Burles S., Moustakas L. A., 2006, ApJ, in press (astro-ph/0601628)
- Kuehn & Ryden (2005) Kuehn F., Ryden B. S., 2005, ApJ, 634, 1032
- Lambas et al. (1992) Lambas D. G., Maddox S. J., Loveday J., 1992, MNRAS, 258, 404
- Lauer (1985) Lauer T. R., 1985, MNRAS, 216, 429
- Lauer et al. (1995) Lauer T. R. et al., 1995, AJ, 110, 2622
- Lauer et al. (2005) Lauer T. R. et al., 2005, AJ, 129, 2138
- Meza et al. (2003) Meza A., Navarro J. F., Steinmetz M., Eke V. R., 2003, ApJ, 590, 619
- Mo et al. (1998) Mo H. J., Mao S., White S. D. M., 1998, MNRAS, 295, 319
- Naab & Burkert (2003) Naab T., Burkert A., 2003, ApJ, 597, 893
- Naab et al. (1999) Naab T., Burkert A., Hernquist L., 1999, ApJ, 523, L133
- Naab et al. (2006) Naab T., Khochfar S., Burkert A., 2006, ApJ, 636, L81
- Pasquali et al. (2006) Pasquali A. et al., 2006, ApJ, 636, 115
- Pellegrini (1999) Pellegrini S., 1999, A&A, 351, 487
- Pellegrini (2005) Pellegrini S., 2005, MNRAS, 364, 169
- Reda et al. (2004) Reda F. M., Forbes D. A., Beasley M. A., O’Sullivan E. J., Goudfrooij P., 2004, MNRAS, 354, 851
- Rest et al. (2001) Rest A., van den Bosch F. C., Jaffe W., Tran H., Tsvetanov Z., Ford H. C., Davies J., Schafer J., 2001, AJ, 121, 2431
- Rusin et al. (2001) Rusin D. et al., 2001, ApJ, 557, 594
- Ryden et al. (2001) Ryden B. S., Fobes D. A., Terlevich A. I., 2001, MNRAS, 326, 1141
- Sérsic (1968) Sérsic J. L., 1968, Atlas de Galaxias Australes Cordoba: Observatorio Astronomico
- Sheth et al. (2003) Sheth R. K. et al., 2003, ApJ, 594, 225
- Shioya & Taniguchi (1993) Shioya Y., Taniguchi Y., 1993, PASJ, 45, L39
- Smith et al. (2002) Smith J. A. et al., 2002, AJ, 123, 2121
- Stoughton et al. (2002) Stoughton C. et al., 2002, AJ, 123, 485
- Turner et al. (1984) Turner E. L., Ostriker J. P., Gott III J. R., 1984, ApJ, 284, 1
- van den Bosch et al. (1994) van den Bosch F. C., Ferrarese L., Jaffe W., Ford H. C., O’Connell R. W., 1994, AJ, 108, 1579
- Vincent & Ryden (2005) Vincent R. A., Ryden B. S., 2005, ApJ, 623, 137
- Weil & Hernquist (1996) Weil M. L., Hernquist L., 1996, ApJ, 460, 101
- Wu et al. (2005) Wu H., Shao Z. Y., Mo H. J., Xia X. Y., Deng Z. G., 2005, ApJ, 622, 244
- Yoo et al. (2006) Yoo J., Kochanek C. S., Falco E. E., McLeod B. A., 2006, ApJ, 642, 22
Appendix A Fitting isophotes with ellipses
Let us consider the surface brightness on the best-fitting ellipse given in Eq. (1). If is small, then we have for a fixed
| (9) |
Therefore,
| (10) |
As , we have
| (11) |
where we have used the Taylor expansion to the first order in the second step. By definition, the right hand side of the equation must be equal to that of Eq. (2). From this, we obtain
| (12) |
The above equation implies
| (13) |
where a is the semi-major axis length and we have used
| (14) |
is the local radial intensity gradient. The ellipse program in IRAF outputs the right hand side of Eq. (13), which is identical to the parameter used in Bender et al. (1989) – the left hand side of Eq. (13).