Ages and metallicities of early-type galaxies in the Sloan Digital Sky Survey: new insight into the physical origin of the colour-magnitude and the Mg2– relations
Abstract
We exploit recent constraints on the ages and metallicities of early-type galaxies in the Sloan Digital Sky Survey (SDSS) to gain new insight into the physical origin of two fundamental relations obeyed by these galaxies: the colour-magnitude and the – relations. Our sample consists of 26,003 galaxies selected from the SDSS Data Release Two (DR2) on the basis of their concentrated light profiles, for which we have previously derived median-likelihood estimates of stellar metallicity, light-weighted age and stellar mass. Our analysis provides the most unambiguous demonstration to date of the fact that both the colour-magnitude and the – relations are primarily sequences in stellar mass and that total stellar metallicity, -elements-to-iron abundance ratio and light-weighted age all increase with mass along the two relations. For high-mass ellipticals, the dispersion in age is small and consistent with the error. At the low-mass end, there is a tail towards younger ages, which dominates the scatter in colour and index strength at fixed mass. A small, but detectable, intrinsic scatter in the mass-metallicity relation also contributes to the scatter in the two observational scaling relations, even at high masses. Our results suggest that the chemical composition of an early-type galaxy is more tightly related to its dynamical mass (including stars and dark matter) than to its stellar mass. The ratio between stellar mass and dynamical mass appears to decrease from the least massive to the most massive galaxies in our sample.
keywords:
galaxies: formation, galaxies: evolution, galaxies: stellar content1 Introduction
The observed properties of early-type galaxies obey several fundamental relations, which have long been thought to hide important clues about the physical processes that influenced the formation and evolution of these galaxies. For example, luminosity, central velocity dispersion , mean surface brightness, brightness profile, colours and absorption-line index all appear to be tightly related to each other in early-type galaxies (Baum, 1959; Faber & Jackson, 1976; Visvanathan & Sandage, 1977; Kormendy, 1977; Bender et al., 1993; Djorgovski & Davis, 1987). The colour-magnitude and the – relations are particularly interesting in that they connect the luminous and dynamical masses of the galaxies with the physical properties of their stellar populations. The tightness and homogeneity of these two relations must be telling us something fundamental about the epoch and the process of formation of early-type galaxies (see for a review Renzini, 2006).
The physical interpretation of the above observational relations is still a subject of debate. The colour-magnitude relation is often interpreted as a sequence of increasing metallicity with increasing luminosity (Faber, 1973; Worthey, 1994; Kodama & Arimoto, 1997; Kodama et al., 1999). However, it has been proposed that, in addition to metallicity, age could at least in part drive the relation (Gonzalez et al., 1993; Terlevich et al., 1999; Ferreras et al., 1999; Poggianti et al., 2001). Studies of evolution with cosmic time indicate that the slope of the colour-magnitude relation has changed little since (Kodama & Arimoto, 1997; Kodama et al., 1998; Stanford et al., 1998; Blakeslee et al., 2003). This has been used as an argument against age as the primary driver of the relation, since the colours of young stellar populations evolve faster than those of old stellar populations. Similar interpretations have been proposed for the relation between index strength and central velocity dispersion , which is generally thought to arise from a combination of age and metallicity variations (Colless et al., 1999; Trager et al., 2000a; Kuntschner et al., 2001).
The difficulty of obtaining unambiguous constraints on the relative influence of age and metallicity on the colour-magnitude and the – relations is a consequence of the difficulty of deriving accurate ages and metallicities for large samples of early-type galaxies: age and metallicity both tend to redden the colours and strengthen the absorption line in similar ways (e.g., Worthey, 1994). In addition, at fixed metallicity, the -element-to-iron (/Fe) abundance ratio appears to be larger in the most massive early-type galaxies than in the nearby stars used to calibrate age and metallicity estimates (Worthey et al., 1992; Vazdekis et al., 2001). This has been explored recently by Thomas et al. (2004), who used ‘closed-box’ chemical evolution models with variable heavy-element abundance ratios to analyse a heterogeneous sample of 124 nearby early-type galaxies, in both low-density and high-density environments. According to these models, massive galaxies formed earlier and more rapidly than low-mass galaxies, while both the colour-magnitude and the – relations are primarily driven by metallicity. Bernardi et al. (2003a, b, c, d) carried out a more observationally oriented analysis on a sample of nearly 9000 early-type galaxies from the Sloan Digital Sky Survey (SDSS). They showed that the colour-magnitude relation reflects a dependence of both colour and luminosity on velocity dispersion. By assuming that luminosity traces metallicity and that the scatter in colour at fixed luminosity traces age, Bernardi et al. (2005) explored how age and metallicity may be related to velocity dispersion in early-type galaxies.
In this paper, we re-examine the physical origin of the colour-magnitude and the – relations using a different approach. Our starting point is a set of statistical estimates of light-weighted age, stellar metallicity and stellar mass for a large sample of 26,003 early-type galaxies drawn from the SDSS Data Release Two (DR2). We derived these constraints in earlier work by using a comprehensive library of model spectra at medium-high resolution (Gallazzi et al., 2005, hereafter Paper I), to interpret the strengths of five spectral absorption features with negligible dependence on the /Fe ratio. We use here this dataset, together with an observational tracer of the /Fe ratio, to demonstrate unambiguously that both the colour-magnitude and the – relations of early-type galaxies are primarily sequences in stellar mass and that both the total stellar metallicity and the /Fe ratio increase with mass along the two relations. Light-weighted age increases from the least massive to the most massive early-type galaxies, with a larger spread at low masses that dominates the scatter in the colour-magnitude and – relations. The small intrinsic scatter in metallicity at fixed mass also contributes to the scatter in the two scaling relations.
We present our sample in Section 2 below, along with a brief description of the method adopted in Paper I to derive statistical estimates of the ages, metallicities and stellar masses of the galaxies. The influence of these parameters on the colour-magnitude and the – relations is explored in Sections 3.1 and 3.2, respectively, and their possible dependence on galaxy environment is addressed in Section 3.3. In Section 3.4 we discuss some implications on the relations between physical parameters and dynamical mass. Section 4 summarises our conclusions. Throughout the paper we use , and
2 Observational sample
We select our sample from the main spectroscopic sample of the SDSS DR2 (Abazajian et al., 2004). The SDSS is an imaging and spectroscopic survey of the high Galactic latitude sky, which will obtain , , , and photometry of almost a quarter of the sky and spectra of at least 700,000 objects (York et al., 2000). The spectra are taken using 3″-diameter fibres, positioned as close as possible to the centres of the target galaxies. Stellar metallicity, light-weighted age and stellar mass estimates are available from Paper I for a sample of 175,128 galaxies with Petrosian -band magnitudes in the range (after correction for foreground Galactic extinction) and in the redshift range . The lower redshift limit allows us to include low-luminosity galaxies (corresponding to a stellar mass of ), while still avoiding redshifts for which deviations from the Hubble flow can be substantial. The upper limit corresponds roughly to the redshift at which a typical galaxy is detected with median S/N per pixel greater than 20.
We select early-type galaxies on the basis of the light concentration index , defined as the ratio of the radii enclosing 90 and 50 percent of the total Petrosian -band luminosity of a galaxy. This parameter has been shown to correlate well with morphological type (Strateva et al., 2001; Shimasaku et al., 2001). Thus, it allows a rough morphological classification of SDSS galaxies. Strateva et al. (2001) propose a cut at to separate early- from late-type galaxies. To limit the contamination by disc galaxies with large bulges, we define here as ‘early-type’ those galaxies with concentration index . In this way, we select 67,411 early-type galaxies in the redshift range . We note that we decided against further limiting the contamination of our sample by systems with residual star formation by imposing a lower cutoff in 4000-Å break strength or an upper limit on emission lines equivalent width. Since these quantities correlate with colour, such limits would introduce an unwanted cutoff in the colour-magnitude relation.111Bernardi et al. (2005) adopted a different criterion to select early-type galaxies from the SDSS. They considered to be of early type those galaxies for which the -band surface brightness profile is better described by a de Vaucouleurs law than by an exponential law (photometric parameter ) and that do not have emission lines (spectroscopic parameter ).
Bayesian-likelihood estimates of the -band light-weighted ages, stellar metallicities and stellar masses of the 67,411 galaxies in our sample are available from Paper I. These estimates were derived by comparing the spectrum of each galaxy to a library of Bruzual & Charlot (2003) models at medium-high spectral resolution, encompassing the full range of physically plausible star formation histories. In practice, we compared the strengths of five spectral absorption features in the spectrum of each observed galaxy to the strengths of these features in every model spectrum (broadened to the observed velocity dispersion) in the library. We used , H and H+H as age-sensitive indices and and as metal-sensitive indices, all of which depend negligibly on the /Fe ratio.222This might not be entirely correct for H and H, which are suspected to depend on the /Fe ratio at high metallicity (Thomas et al., 2004; Korn et al., 2005). However, we did not find any discrepancy between the metallicities and ages derived including or excluding H+H (see section 2.4.2 of Paper I). This comparison allowed us to construct the probability density functions of age, metallicity and stellar mass for every galaxy. The estimate of each parameter is given by the median of the corresponding probability distribution, while the error on each parameter is given by half the percent percentile range of the likelihood distribution (this would be equivalent to the range for a Gaussian distribution).
We note that the stellar ages, as well as the other physical parameters, are derived by fitting the galaxy spectra as observed and so refer to the galaxies at the time they are observed. Because of the bright and faint magnitude limits in our sample, there is a strong correlation between luminosity and redshift. If uncorrected, it may introduce systematic effects in correlations between age and luminosity (or mass). To avoid this, we correct our measured ages so that they are relative to the present, rather than to the point of observation by adding to the measured age for each galaxy the look-back time to the redshift at which it is observed. The metallicity is left unchanged. This look-back time varies from 0.07 to 2.64 Gyr over the redshift range covered by our sample. The corrections mainly affect the most luminous galaxies, which are found out to higher redshifts. All light-weighted ages quoted throughout this paper refer to .
As described in Paper I, our constraints on metallicity and age are sensitive to the observational signal-to-noise ratio (S/N) of the spectra. A median S/N per pixel of at least 20 is required to constrain metallicity reliably. For this reason, we consider here only those galaxies with a median S/N per pixel greater than 20. This cut reduces our sample to 26,003 high-concentration galaxies in the redshift range . This is the same sample of ‘early-type’ galaxies as analysed in section 3.3 of Paper I. As shown there, the S/N requirement biases the sample towards low-redshift, high-surface brightness galaxies, but it does not introduce any bias in the luminosity, colour, velocity-dispersion and index-strength distributions of the early-type galaxy sample.
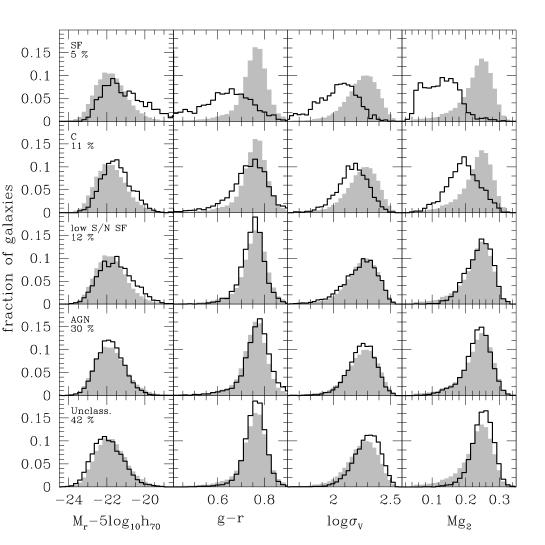
Our selection of early-type galaxies, based only on the concentration parameter, includes early-type spiral galaxies, galaxies with emission lines and active galactic nuclei (AGN). We can divide our sample into five subclasses according to the classification given by Brinchmann et al. (2004) on the basis of the emission-line properties of SDSS-DR2 galaxies. Following their notation, we label as (1) unclassifiable (‘Unclass.’) those galaxies which cannot be classified using the Baldwin et al. (1981) diagram, i.e. mostly galaxies with no or weak emission lines; (2) AGN those galaxies with a substantial AGN contribution to their emission-line fluxes; (3) star forming (‘SF’) those galaxies with S/N in H, H, [OIII]5007, [NII]6564 emission lines and for which the contribution to H from AGN is less than 1 percent; (4) composite (‘C’) those galaxies with S/N in the same four lines, but for which the AGN contribution to H luminosity can be up to 40 percent; (5) low-S/N star forming (‘low-S/N SF’) those galaxies with S/N in H but without AGN contribution to their spectra. The sample includes 10,982 unclassifiable galaxies, 7782 AGN and 3018 low-S/N SF galaxies. There are 2858 composite and 1362 star-forming galaxies, accounting for roughly 11 and 5 percent of the total sample, respectively. As expected, most galaxies in the sample have specific star formation rates (SFR/M∗) less than yr-1, which are in most cases consistent with zero. We note that the distribution in specific star formation rates for the subclasses of C and SF galaxies shows a peak at yr-1.
Fig. 1 shows the distributions of several observational quantities of interest to us for this sample: the -band absolute magnitude , the colour, the logarithm of the velocity dispersion (in ) and the Mg2 index strength. The magnitude and the colour represent rest-frame quantities. They are corrected for evolution following the prescription of Bernardi et al. (2005), as described in Section 3.1.1. Also the index strength is corrected to assuming passive evolution, as described in Section 3.2. In each row, the solid histogram represents the distribution for each of the above subclasses (whose fractional contribution to the total sample is given in the leftmost panel), while the distribution for the sample as a whole is represented by the shaded grey histogram. The distributions for the unclassifiable, AGN and low-S/N SF galaxies agree well with the distributions for the sample as a whole. In contrast, C and especially SF galaxies tend to concentrate in the low-luminosity, blue, low-velocity-dispersion and low-Mg2 tails of the distributions.
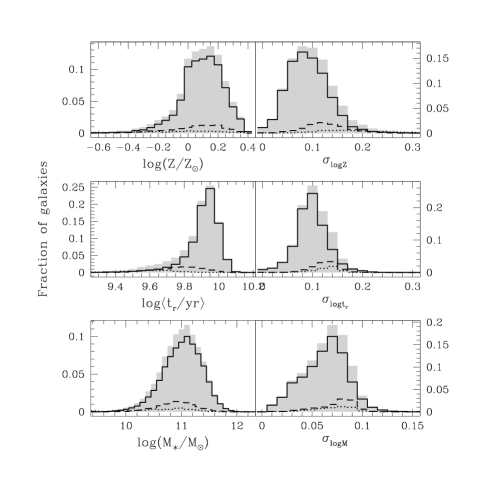
The stellar metallicities, ages and stellar masses derived in Paper I for the galaxies in the sample are shown in Fig. 2 (shaded grey histograms). The distribution in metallicity extends from to with a peak around . The distribution in -band light-weighted age extends from 2.5 to 12 Gyr with a peak around Gyr. The distribution in stellar mass extends from to with a peak around . The right-hand panels of Fig. 2 show the distributions of the associated errors, computed as one half the 68 percent confidence ranges in the estimates of , and . The typical uncertainty in both metallicity and age estimates is about dex, while stellar mass is constrained to better than dex for the majority of the galaxies in the sample. The same is true when considering Unclass., AGN and low-S/N SF galaxies only (solid histograms). The distributions for SF (dotted line) and C (dashed line) galaxies extend to lower stellar metallicities, ages and stellar masses than the bulk of the sample, with slightly higher errors in all three parameters.
In addition to the effects of age, metallicity and stellar mass, we are also interested in the influence of the /Fe ratio on the observed properties of early-type galaxies. This ratio can be empirically quantified by the relative strengths of Mg- and Fe-based absorption-line indices (Thomas et al., 2003). We use here , where is the average of the Fe5270 and Fe5335 index strengths. In what follows, we compare the observed ratio of a galaxy to that of the model that best reproduces the 5 spectral features mentioned above. Since the models have scaled-solar abundance ratios, any discrepancy between observed and model index strengths can then be interpreted as a departure of the -elements-to-iron abundance ratio from solar in the observed galaxy.
Working with the difference in index ratio rather than with the observed value of allows us to take into account the dependence of the index strength on age. It is also interesting to check whether the difference traces linearly the true /Fe abundance ratio over the whole parameter space covered by our galaxies. It is not possible to check this self-consistently on our sample with our own models, since they do not include variations in element abundance ratios. For this test, we used Simple Stellar Population (SSP) models with variable element abundance ratios from Thomas et al. (2003). We have considered SSPs with different /Fe abundance ratios ([/Fe]=), with age varying from 1 to 13 Gyr and metallicity varying from to 0.5. For each model we calculate the difference in with respect to the corresponding scaled-solar model at the same age and metallicity. We have looked at the relation between and the abundance ratio [/Fe] at fixed metallicity. We do not find significant differences in the slope and zero-point of the linear relations, averaged over age, for different metallicities. Only at is the relation somewhat flatter; we note that this is not relevant for the galaxies in our sample, which predominantly have metallicities above (see Fig. 2). The proportionality between and [/Fe] is confirmed by plotting as a function of age and as a function of metallicity for SSPs with different /Fe ratio. At fixed [/Fe], the measured is constant over the age and metallicity ranges covered by our sample. These checks reassure us that the discrepancy between the observed and the best-fit model index strengths has the same proportionality with [/Fe] over the age and metallicity ranges covered by the sample.
3 Physical origin of observed relations for early-type galaxies
We use here the sample of 26,003 early-type galaxies described above to investigate the physical origin of two fundamental relations obeyed by early-type galaxies: the colour-magnitude relation (Section 3.1) and the – relation (Section 3.2). We address the environmental dependence of these relations and of galaxy physical parameters in Section 3.3. We then explore in more detail how physical parameters are related to the depth of a galaxy’s potential well (Section 3.4).
3.1 The colour-magnitude relation
The optical colours of early-type galaxies are strongly correlated with absolute magnitude, in the sense that bright galaxies tend to be redder than faint galaxies (e.g. Baum, 1959; de Vaucouleurs, 1961; Faber, 1973; Visvanathan & Sandage, 1977; Bower et al., 1992). As mentioned in Section 1, the physical origin of this correlation is still a matter of controversy, mainly because of the lack of large samples of galaxies with accurate age and metallicity estimates.
3.1.1 Observed colour-magnitude relation
We consider here the colour-magnitude relation (CMR) defined by the rest-frame colour and the absolute -band magnitude . We compute these quantities using the SDSS model magnitudes, which are obtained from fits of the -band surface brightness profile of each galaxy with either a de Vaucouleurs law or an exponential law (the best-fitting profile is also adopted in the other photometric bands). We k-correct the observed colour and the absolute magnitude to using the model in the spectral library of Section 2 that best reproduces the spectral absorption features of the galaxy, reddened to reproduce the observed colours at the redshift of the galaxy (this reddening correction is typically small; see below). We also correct colours and magnitudes for evolution, adopting the correction estimated by Bernardi et al. (2005) from a sample of 39,320 SDSS early-type galaxies, i.e. we make the magnitudes fainter by and the colours redder by . From now on, we denote by and the k+e-corrected (but not dereddened) quantities.
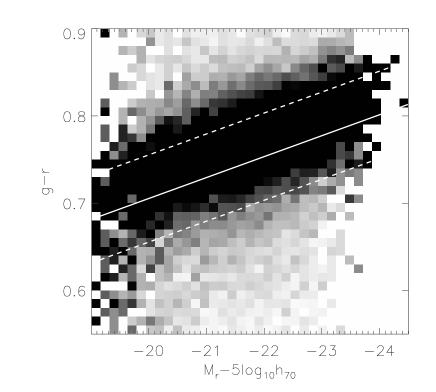
Fig. 3 shows the , colour-magnitude relation defined in this way by early-type galaxies in the sample described in Section 2. We have arranged galaxies in bins of absolute magnitude and colour (0.15 and 0.01 width respectively). The grey scale indicates, for each magnitude bin, the relative distribution of galaxies in the different colour bins (we do not show bins containing less than 2 percent of the total number of galaxies at a given magnitude). The straight line in Fig. 3 shows a ‘robust’ fit of these data, obtained by minimising the absolute deviation in colour as a function of magnitude. We note that this lies slightly to the blue of the ridge-line of the relation, reflecting the skewed colour distributions of Fig. 1. The robust fit has a slope333The errors on the slopes of the fitted relations quoted throughout the paper have been estimated using a ‘jackknife’ method. The parameters of the fitted relations are summarised in Table 1. of . This slope is consistent with that of obtained previously by Bernardi et al. (2005)444We estimated this slope as , using the values reported in tables 1 and 2 of Bernardi et al. (2005, see their appendix B1).. The dashed lines in Fig. 3 show the mean positive and negative absolute deviations in colour () relative to this fit.
To better understand the influence of our galaxy selection criteria on our results, we constructed a second sample (we call this ‘sample B’) following the prescription by Bernardi et al.. We first select all objects classified as galaxies, with measured velocity dispersions and with Petrosian -band magnitudes (corrected for galactic reddening) between 14.5 and 17.75 in the SDSS DR2. We then define as early-type those galaxies with and . We select in this way 59,907 early-type galaxies, for which we have colours and absolute magnitudes.555Note that the sample used by Bernardi et al. (2005) is slightly smaller than the SDSS DR2. Note also that sample B is larger than our primary sample, mainly because of our cut in S/N ratio.
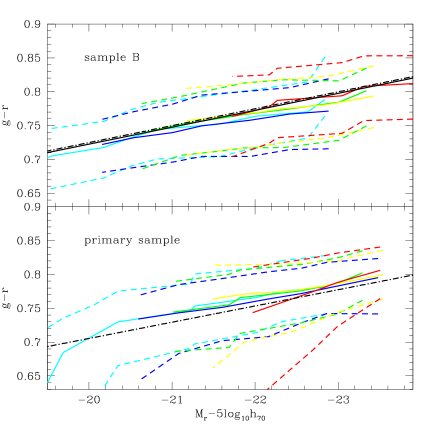
In Fig. 4, we compare the CMRs obtained from our primary sample and from sample B in different redshift bins (by analogy with fig. 2 of Bernardi et al., 2005). The black dot-dashed lines in Fig. 4 show robust fits to the relations for the two samples. The slope for sample B (, upper panel) is in good agreement with that obtained by Bernardi et al. (2005, black solid line) and with that derived for our primary sample (, lower panel). The colour-magnitude distributions of the galaxies in different redshift bins in sample B (upper panel) also agree reasonably well with those in fig. 2 of Bernardi et al. (2005). Thus, our results agree with those of Bernardi et al. (2005) under similar assumptions.
We note that our primary sample differs from sample B mainly through the inclusion of blue galaxies at intermediate-to-low luminosities. These are predominantly galaxies in the SF and C classes, which are likely to be bulge-dominated spiral galaxies with detectable emission lines (eclass>0, which excludes them from sample B). The contamination of our primary sample by these galaxies also results from the fact that we do not make any distinction on the basis of galaxy environment. While the slope of the CMR in low-density environments is not significantly different from that found for cluster early-type galaxies, the scatter about the relation appears to increase from high- to low-density environments (Larson et al., 1980; Hogg et al., 2004). Also, at the median redshift of our sample, Pimbblet et al. (2002) find that, at fixed luminosity, early-type galaxies tend to have bluer colours in the outskirts than in the centres of galaxy clusters (see also Abraham et al., 1996). They interpret this as a difference in age of the galaxies in different environments.
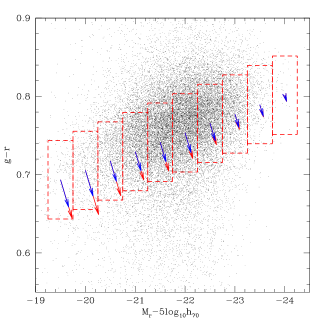
As in other work on early-type galaxies (e.g. Bernardi et al., 2005), we do not include any correction for dust attenuation in the CMR presented here. We can estimate the influence of dust on the CMR, using the model spectral fits described in Section 2. The - and -band dust attenuation can be estimated from the difference between the emission-line corrected fibre666fibre magnitudes are obtained from the flux measured within an aperture of radius 1.5 arcsec, i.e. equal to the fibre radius. colour of the galaxy and the colour of the redshifted, dust-free model, assuming a single power-law attenuation curve (see also Paper I). To quantify the effect of dust attenuation on the CMR, we show in Fig. 5 the average attenuation vectors (red arrows) for galaxies falling into different bins of and (dashed boxes). As expected, the average attenuation is reduced if C and SF galaxies are excluded (blue arrows). In both cases, attenuation by dust becomes more important at lower luminosities. Correcting for dust attenuation would thus steepen the relation. When de-reddening the colours and magnitudes of the galaxies in the sample according to the average attenuation vectors shown in Fig. 5, we derive a slope of . Table 1 summarizes the parameters of the fits to the (k-corrected) colour-magnitude relation, with and without evolution and dust corrections.
3.1.2 Physical origin of the colour-magnitude relation
Fig. 6 shows how metallicity, age, /Fe ratio and stellar mass change along the colour-magnitude relation. We have binned the , plane in the same way as in Fig. 3, the brightness of each bin at a given being proportional to the number of galaxies falling into this bin (see Section 3.1.1). In each panel, the colour code reflects the average properties of the galaxies falling into each colour-magnitude bin, as indicated. Panels (a)–(c) show how (the median-likelihood estimates of) age, metallicity and stellar mass are distributed along the CMR. Panel (d) shows the distribution of the offset between observed and predicted index strengths, which traces the -elements-to-iron abundance ratio (Section 2).
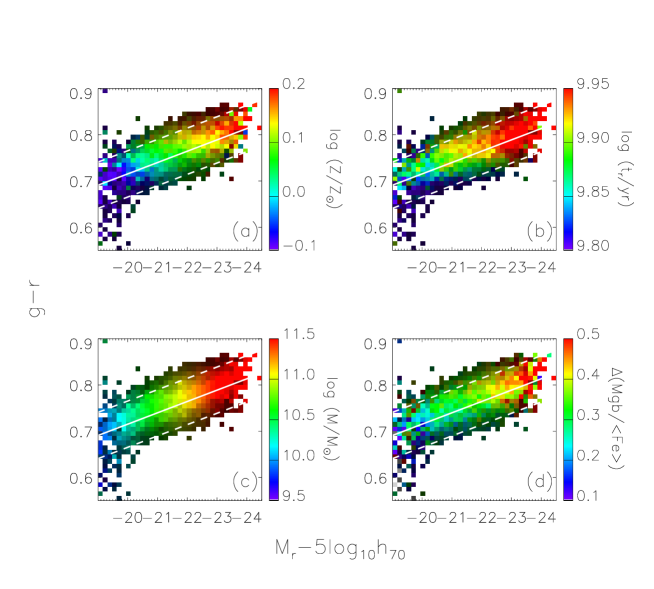
The most remarkable result from Fig. 6 is that the colour-magnitude relation is primarily a sequence in the stellar mass of early-type galaxies (panel c; note that the gradient in stellar mass is not exactly parallel to the magnitude axis, reflecting a non-constant mass-to-light ratio in the optical bands). Another striking result is that the average metallicity increases from to from the faintest to the brightest galaxies along the relation, the average light-weighted age increasing by less than 3 Gyrs (from 6.5 and 9.0 Gyr) over the same interval of 5 magnitudes in (panels a and b). The marked increase in metallicity is accompanied by an increase in the -elements-to-iron abundance ratio (panel d). This is consistent with the finding that giant elliptical galaxies have higher [Mg/Fe] than faint elliptical galaxies (e.g, Worthey et al., 1992; Trager et al., 2000a; Kuntschner et al., 2001; Thomas et al., 2004). The gradients in both metallicity and age are not exactly parallel to the relation, but at fixed magnitude, bluer galaxies are more metal-poor and younger than redder galaxies. Thus, both metallicity and age contribute to the scatter about the relation.
It is of interest to compare the relative contributions by age and metallicity to the scatter about the CMR. We note that we expect dust attenuation and changes in the [/Fe] ratio to contribute negligibly to the scatter, since the scatter in colour of dust-free, [/Fe]=0 models with the ages and metallicities of the galaxies in our sample ()777This is estimated by adopting, for each galaxy in the sample, the median of the likelihood distribution in obtained by weighting each model in the library of Section 2 by . is very similar to the observed scatter (). For comparison, the scatter in colour of models with the metallicities of the galaxies in our sample but with a fixed imposed (average) age at fixed is only , while that of models with the ages of the galaxies in our sample but with a fixed imposed (average) metallicity at fixed is . This indicates that age and metallicity contribute a similar amount to the scatter in the colour-magnitude relation for early-type galaxies.
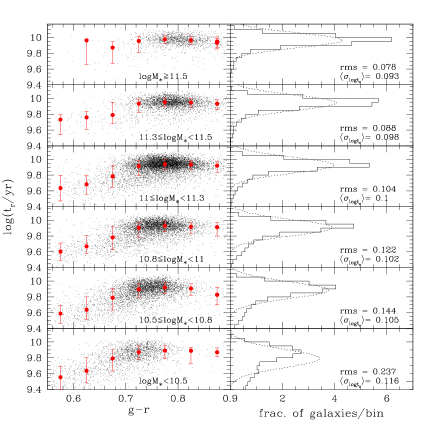
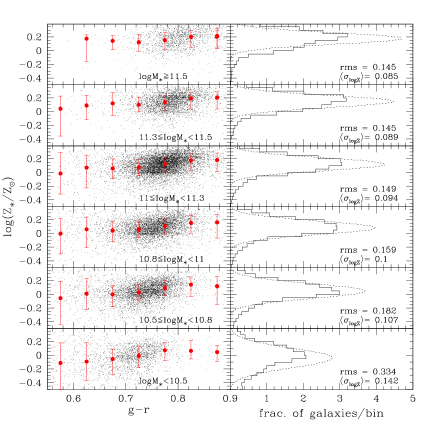
Figure 7 better quantifies the intrinsic scatter in the two physical parameters and how much it determines the scatter in colour as a function of stellar mass. The left-hand panels show the distribution in light-weighted age (or metallicity) as a function of colour in six bins of stellar mass (the median and the interpercentile range are given by the red points and associated error bars). The right-hand panels show the marginalized distribution in age (metallicity) compared with a Gaussian of width equal to the average error in age (metallicity) for the galaxies in each stellar mass bin (dotted curve). From the left-hand plot we can see that at masses above the scatter in light-weighted age can be entirely accounted for by the measurement errors, which are on average less than 0.1 dex. We can thus say that all massive ellipticals of given mass have the same mean age (within the errors). At lower masses the scatter in light-weighted age becomes larger than the typical error, and the distribution is skewed toward younger ages. At fixed mass, there is a correlation between age and colour, which saturates for the reddest galaxies. We also detect a small intrinsic scatter in the mass-metallicity relation in all mass bins (right-hand plot), which contributes to the scatter in the CMR at fixed mass, even at the high-mass end.
It is important to check that aperture effects do not introduce any spurious trend in Fig. 6. This could arise because colour, luminosity and stellar mass pertain to the galaxy as a whole, while age, metallicity and are measured within a fixed fibre aperture of radius 1.5 arcsec, which samples different fractions of the total light in galaxies with different apparent sizes. In section 3.4 of Paper I, we already showed that aperture effects are not expected to affect significantly the ages and metallicities derived for the galaxies in our sample. To probe the influence of aperture effects on the results of Fig. 6, we have arranged galaxies in several bins of apparent size , defined as the -band Petrosian half-light radius. Galaxies with arcsec are found out to redshift 0.2. We plotted the equivalent of Fig. 6 for each bin of within this range. In all cases, we found the same increase in metallicity, and age along the relation as in Fig. 6, although the trends were noisier because of the smaller numbers of galaxies in individual bins. In our sample, galaxies along the CMR have a roughly constant apparent size arcsec at all magnitudes fainter than (corresponding roughly to stellar masses less than ). The brightest galaxies tend to have larger apparent sizes, but stellar metallicity, age and do not show any significant trend with apparent size. Thus, we are confident that aperture effects are not responsible for the trends seen in Fig. 6.
For completeness, we repeated the analysis of Fig. 6 using sample B in place of our primary sample (Section 3.1.1). We found no significant difference in this case with respect to the results described above. We also repeated the analysis using our primary sample, but correcting the observed CMR for the effects of dust attenuation (Section 3.1.1). Again, the main results in this case did not change. We further checked the influence of a possible contamination of the trends identified in Fig. 6 by late-type galaxies, in particular, with regard to the variation in age along the relation. Excluding SF and C galaxies (which tend to have younger ages than the bulk of the sample) had no significant effect on the results. In fact, C galaxies alone display the same trends as found in Fig. 6 for the sample as a whole. The average metallicity of SF galaxies also increases with luminosity along the CMR, although these tend to have light-weighted ages clustered around a mean value almost independently of luminosity. We note that SF galaxies represent only about 5 percent of our primary sample, and they occupy , bins where the fraction of galaxies at a given magnitude is less than 2 percent of the total sample (not displayed in Fig. 6).
In summary, we have shown that the colour-magnitude relation is primarily a sequence in galaxy stellar mass. Both the chemical composition (i.e. the total metallicity and the -elements-to-iron abundance ratio) and the age of elliptical galaxies depend mainly on stellar mass, increasing along the relation. At the high-mass end of the relation, the age spread is negligible and consistent with the errors. In this regime, the scatter in the CMR is determined by the small scatter in the mass-metallicity relation. At lower masses, the distribution in age becomes broader, with a spread toward younger ages, which correlates with colour and is thus the main contributor to the scatter about the colour-magnitude relation at the low luminosity end.
3.2 The – relation
In this section, we focus on another observational relationship between the stellar populations and the structural properties of early-type galaxies: the relation between index strength and galaxy velocity dispersion (Bender et al., 1993). The difficulty in interpreting this relation comes from the complex translation of index strength and into physical parameters.
The index strengths considered here are corrected for broadening due to velocity dispersion. They are normalised to a fixed velocity dispersion of , corresponding roughly to the average velocity dispersion of galaxies in our sample. The normalization is achieved by using the Bruzual & Charlot (2003) models to compute the difference in index strength between the observed and reference velocity dispersion at the metallicity of each galaxy.888This correction varies from to over the range in velocity dispersion covered by the sample. The average absolute correction is only 0.8 percent of the percent percentile range in index strength. For a consistent comparison with the CMR and with the evolution-corrected light-weighted ages, we also correct the index strengths so that they are relative to the present rather than to the redshift of observation, assuming passive evolution. The corrections are obtained by fitting simple linear relations between index strength and time for SSPs of different metallicities and velocity dispersions. The value measured for each galaxy is then corrected by adding the expected change in index strength over a time interval equal to the look-back time at the redshift of the galaxy.999The fitted slopes, averaged over velocity dispersion, are for respectively.
Fig. 8 shows the – relation defined by the early-type galaxies in our primary sample. We have arranged galaxies in narrow bins of and (of widths 0.01 and 0.036, respectively). By analogy with Fig. 3, the grey scale in Fig. 8 indicates, for each bin, the relative distribution of galaxies in the different bins (we do not show bins containing less than 2 percent of the total number of galaxies at given velocity dispersion). The solid straight line shows the result of a robust linear fit obtained by minimising the absolute deviation in strength as a function of . This has a slope of , i.e. very close to that found by Bernardi et al. (2003d) for a sample of co-added, high-quality spectra of SDSS early-type galaxies (see also Guzman et al., 1992; Colless et al., 1999). The dashed lines in Fig. 8 are the mean positive and negative absolute deviations in strength ( mag) relative to this fit (also in agreement with previous work). These results are summarized in Table 1. We also indicate in the table the slightly lower slope of the – relation obtained for sample B (). This is because sample B includes fewer (emission-line) galaxies with weak absorption than our primary sample at low and more (low-S/N) galaxies with weak absorption at large (Section 3.1.1).
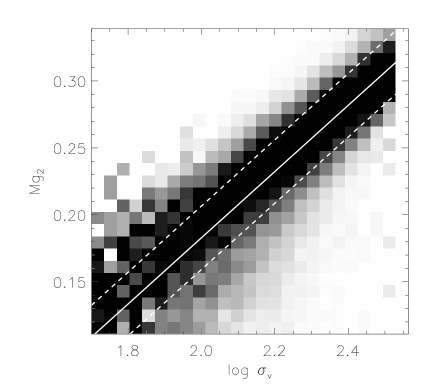
The tightness of the – relation has been used in the past to argue that early-type galaxies have nearly coeval stellar populations, perhaps within 15 percent, at given composition (e.g. Bender et al., 1993). However, as noted by Trager et al. (2000a), the small scatter about the relation could also conceal significant age spreads, if these are accompanied by metallicity spreads such that the strength remains roughly constant at fixed velocity dispersion (see also Jørgensen, 1999). Assuming a moderate anticorrelation between age and metallicity, Colless et al. (1999) find that the intrinsic scatter in the – relation translates into an upper limit of 40 (50) percent on the age (metallicity) spread. Moreover, it has been pointed out that, at fixed , the distribution of residuals relative to the mean – relation is not symmetric but skewed toward low values, and that this effect tends to increase at low velocity dispersion (Burstein et al., 1988; Bender et al., 1993; Jørgensen et al., 1996; Trager et al., 2000a; Worthey & Collobert, 2003). Our data confirm this finding. Fig. 9 shows the distribution of residuals at different velocity dispersions (increasing from the top-left to the bottom-right panels) for our primary sample. At large velocity dispersion, the distribution of residuals is symmetric and centred around zero, while at smaller velocity dispersions, a tail of negative residuals appears. This could result from either an age or a metallicity spread, or both. The observation that galaxies with negative residuals are often morphologically disturbed (presumably because of recent star formation) led to the idea that low values at fixed are associated with younger ages (Schweizer & Seitzer, 1992).

The availability of independent constraints on the ages and metallicities of early-type galaxies in our sample allows us to re-examine the physical origin of the – relation. Fig. 10 shows how metallicity, age, /Fe ratio and stellar mass change along this relation. We have binned and colour-coded the , plane to reflect the average properties of the galaxies falling into each bin. As in Fig. 8, the brightness of each bin at a given is proportional to the number of galaxies falling into this bin. Panels (a)–(c) show how (the median-likelihood estimates of) age, metallicity and stellar mass are distributed along the – relation. Panel (d) shows the distribution of the offset between observed and predicted index strengths, which traces the /Fe ratio (Section 2).
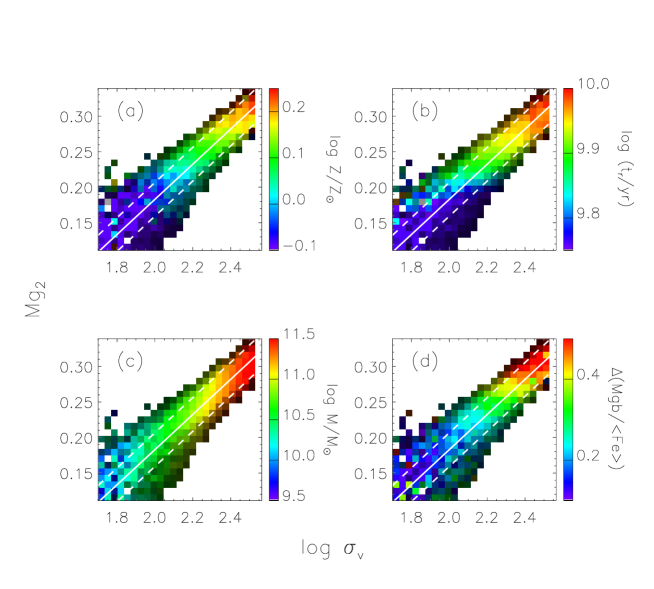
The most remarkable result from Fig. 10 is that, like the CMR, the – relation for early-type galaxies appears to be primarily a sequence in stellar mass (panel c). In fact, stellar mass correlates tightly with velocity dispersion, which is a tracer of dynamical mass (e.g., Cappellari et al., 2006). Panel (a) further shows that stellar metallicity increases along the relation, from to from low to high velocity dispersions. Galaxies with large are also older than those with low , though for age appears to correlate with index strength as well. Another striking result from Fig. 10 is the similarity between the metallicity and gradients along the – relation (panels a and d). This shows that massive early-type galaxies with large velocity dispersions are both more metal-rich and more abundant in elements relative to iron than less massive galaxies.
As in the case of the CMR (Section 3.1.2), we have checked that the trends identified above are not caused by aperture effects. In particular, we find similar trends in stellar mass, metallicity, age and along the – relation when considering galaxies in narrow ranges of . Galaxies along the relation have roughly constant apparent size arcsec, implying that the average fraction of total galaxy flux sampled by the fibre is almost constant.
As above for the CMR, we can quantify the relative contribution of metallicity and age to the scatter in the – relation. We note that there must be another parameter, most likely the -elements-to-iron abundance ratio, that is responsible for the scatter in the relation. In fact, the scatter in of [/Fe]=0 models with the ages and metallicities of the galaxies in our sample is only , i.e. much smaller than the observed scatter (0.0237).101010For each galaxy in the sample, we adopt here the median of the likelihood distribution in obtained by weighting each model by . We obtain a similar scatter () in the index strength of models with the same metallicity as the galaxies in our sample but with a fixed imposed (average) age at fixed . On the other hand the scatter in index strength of models with the ages of the galaxies in our sample but with a fixed imposed (average) metallicity at fixed is only . This indicates that metallicity has a stronger influence than age on the scatter in the – relation.
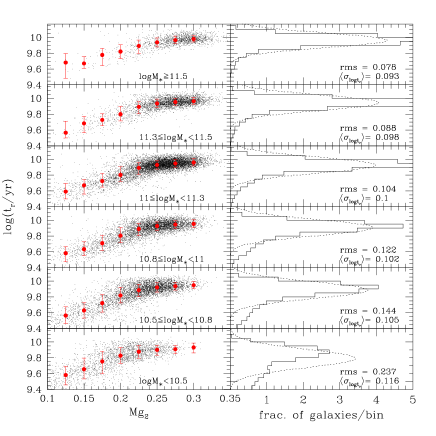
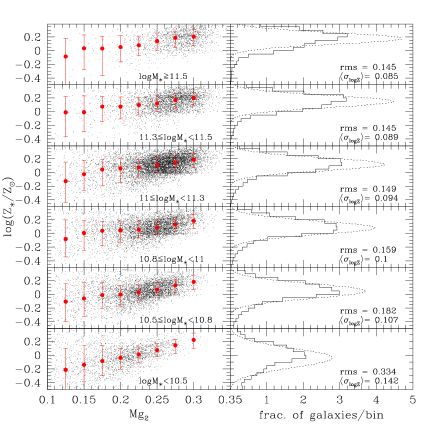
Figure 11 is obtained in a similar way as Fig. 7. As in Fig. 7, the left-hand panels of Fig. 11 show that the scatter in light-weighted age of high-mass ellipticals () is negligible and consistent with the errors on the age estimates. Only at masses below does a significant tail of younger ages appear. These young galaxies are responsible for the scatter in at fixed mass, but the relation between age and index strength saturates for . Also in agreement with Fig. 7, the right-hand plot shows that we detect (above the measurement error) a small scatter in metallicity at fixed mass in all mass bins. There is a correlation between metallicity and at fixed mass, in particular for galaxies with (left-hand panels), where light-weighted age saturates to a constant mean value.
The – relation is, therefore, primarily a sequence in galaxy stellar mass. It reflects the fact that early-type galaxies form a sequence of increasing total stellar metallicity and -elements to iron abundance ratio from shallow to deep potential wells. Our results also confirm the trend of increasing age with increasing velocity dispersion (e.g. Caldwell et al., 2003; Thomas et al., 2005; Nelan et al., 2005). At high masses, the small scatter in the relation correlates with the scatter in stellar metallicity at fixed stellar mass, while light-weighted age is almost independent of index strength. At the low-mass end of the relation, the fraction of young ellipticals increases and variations in age between and Gyr correlate with index strength at fixed mass.
| Sample | Slope | Intercept | Scatter |
|---|---|---|---|
| Colour-magnitude relation | |||
| sample Aa | 0.40 | 0.051 | |
| sample Ba | 0.41 | 0.043 | |
| sample Ab | 0.22 | 0.050 | |
| sample Bb | 0.14 | 0.043 | |
| sample Ac | 0.14 | 0.051 | |
| sample Bc | 0.37 | 0.043 | |
| sample Ad | 0.050 | ||
| sample Bd | 0.09 | 0.044 | |
| – relation | |||
| sample Ae | 0.024 | ||
| sample Be | 0.023 | ||
| sample Af | 0.024 | ||
| sample Bf | 0.023 | ||
ak-corrected colour and magnitude. bk+e-corrected colour and magnitude (the evolution correction is the one provided by Bernardi et al., 2005). ck-corrected colour and magnitude dereddened applying the average dust corrections of Fig. 5. dFully corrected colour and magnitude. e index strength corrected for velocity dispersion. f index strength corrected for velocity dispersion and evolution.
3.3 Environmental dependence
Several authors have addressed the dependence on environment of the properties of the stellar populations in early-type galaxies. Studies of the colour-magnitude relation and the relations between absorption indices and velocity dispersion on relatively small samples of early-type galaxies in different environments have shown that galaxies in low-density environments tend to be younger and more metal-rich than those in high-density environments (e.g. Kuntschner et al., 2002; Thomas et al., 2005; Denicoló et al., 2005). Bernardi et al. (1998), later confirmed by Bernardi et al. (2006) on a larger sample of SDSS early-type galaxies, found differences in the relation of galaxies in different environments, implying that galaxies in dense environments are at most 1 Gyr older than galaxies in low-density environments and that they have the same metallicity.
Kauffmann et al. (2004) provide estimates of environmental density for a sample of SDSS DR2 galaxies in the redshift range and with apparent -band magnitude in the range , complete down to a stellar mass of . The density is expressed in terms of the number of spectroscopically-observed neighbouring galaxies (down to a fixed absolute magnitude) within 2 Mpc of projected radius and km/s in velocity difference from the target galaxy, corrected for galaxies missed due to fibre collisions (). We take advantage of these density estimates to address any environmental dependence of the physical properties of the stellar populations for the galaxy sample studied here. This can be achieved for only 1765 galaxies in our sample, for which an estimate of is available. We consider three bins in environmental density, defined by , and , which contain, respectively, 693, 388 and 684 galaxies. As mentioned in Section 2, we can classify the galaxies in our sample on the basis of their emission-line properties. As expected, the sample is dominated by ‘unclassifiable’ galaxies (without emission lines), but there is also contamination by galaxies with a low level of star formation (SF and C galaxies). Fig. 12 illustrates the fraction of unclassifiable, SF, low-S/N SF, C and AGN galaxies as a function of environment. This plot quantifies the statement of Section 3.1.1 that the fraction of galaxies showing emission lines in our sample increases in lower-density environments. This class of galaxies also contributes to increase the scatter blueward of the colour-magnitude relation.
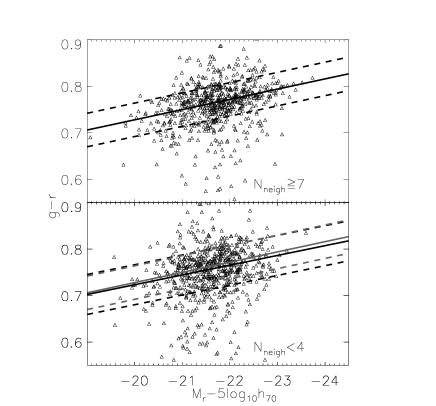
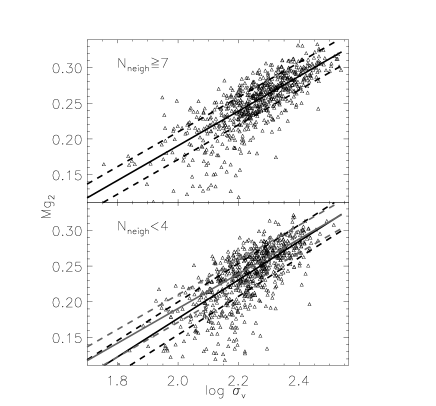
In Fig. 13, we explore how the CMR (left-hand panels) and the relation (right-hand panels) depend on environment. The relations found in the highest-density bin are compared to those defined in the lowest-density bin. The results of the linear fits (also for the intermediate bin of ) are given in Table 2. Fig. 13 and Table 2 show that there is no systematic variation in the slope of the CMR as a function of environment, while the relation appears to steepen at low densities because of a larger fraction of galaxies with low index strength at low velocity dispersions (columns 3 and 6). Between the two extreme density bins there are differences of and in the zero-points of the CMR and the relation, respectively (columns 4 and 7). This is in agreement with the small shift of mag measured by Bernardi et al. (1998) in the relation of a sample of 931 early-type galaxies in different environments. We also identify a systematic increase of the scatter about both relations from high- to low-density environments, in agreement with earlier findings, as mentioned above (e.g. Hogg et al., 2004).
It is of interest to understand how the change in the scatter along the two scaling relations reflects differences in the physical parameters of galaxies in different environments. We note that the distribution in stellar mass does not vary significantly111111When comparing the stellar mass distribution of galaxies in the low-density bin with that of galaxies in the high-density bin, the probability obtained from a Kolmogorov-Smirnov test is not low enough to reject the hypothesis that the two distributions are drawn from the same parent distribution. with environment, but that the median stellar mass of galaxies in the lowest-density bin is lower by about 0.05 dex than the median stellar mass in the highest-density bin (it increases from to ). Since stellar metallicity, age and element abundance ratio all increase with stellar mass, any effect induced by changes in stellar mass must be removed when quantifying variations in these parameters with environment. To do this, we calculate the median stellar metallicity, light-weighted age and element abundance ratio as a function of stellar mass for the sample as a whole (see Fig. 17). For the 1765 galaxies with an estimate of environmental density, we then consider the offsets in , , from the median values of these parameters at fixed stellar mass in the whole sample. The distributions in and are skewed toward negative values, independently of environment, and this effect is stronger at small masses. If galaxies at low densities are distributed preferentially to smaller masses than galaxies in dense environments, the distributions in and will show a stronger tail toward negative values in the low-density bin. To separate this effect from an intrinsic dependence of metallicity and age on environment, we further distinguish between galaxies with stellar masses above and below .
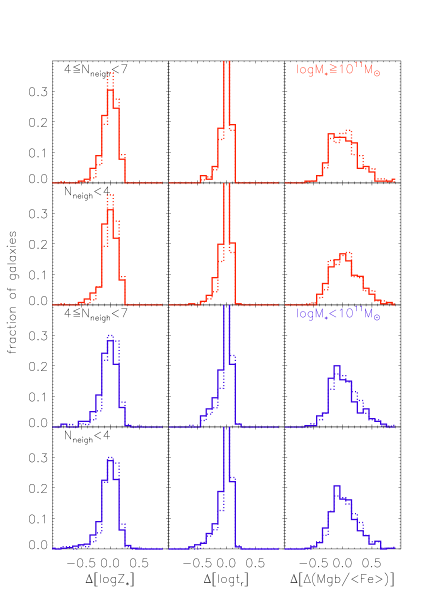
The result of this analysis is shown in Fig. 14 for the same three environmental bins as considered above. The distributions of the offsets in , and for the two low-density bins ( and , solid lines) are compared to the corresponding ones in the high-density bin (, dotted line in each panel), for massive and low-mass galaxies separately (red and blue histograms, respectively). The comparison is also summarized in Table 3, where we give the difference of the average parameter offset between the highest- and the lowest-density bins, for galaxies with stellar mass above and below separately. There, we also indicate the probability for the two distributions to be drawn from the same parent distribution, according to a Kolmogorov-Smirnov test. Element abundance ratio, as expressed by , does not show any significant variation with environment, either in the average value or in the scatter. In contrast, light-weighted age (independently of mass) and metallicity (for massive galaxies) show a small dependence on environment in the sense that there is a higher fraction of young, metal-poor galaxies in low-density environments. Massive early-type galaxies in dense environments tend to be dex more metal-rich than their field counterparts. Similarly, the light-weighted ages of galaxies in dense environments are dex older than in the field. It is interesting to mention that we also find a systematic increase in the scatter of metallicity and age from dense to low-density environments. From the highest- to the lowest-density bins the scatter in both metallicity and age increases by about 0.02 dex for massive galaxies (from 0.118 to 0.135 for , from 0.083 to 0.103 for ) and by about 0.01 dex for (from 0.16 to 0.17 for and from 0.12 to 0.136 for ). Although very small, these trends hint at a possibly very relevant environmental dependence of metallicity and age. Future analysis of larger samples of galaxies (provided, e.g., by the complete SDSS) with well characterized environmental properties will allow to draw firmer conclusions.

| colour-magnitude | |||||||
| Environment | Slope | Intercept | Scatter | Slope | Intercept | Scatter | |
| (1) | (2) | (3) | (4) | (5) | (6) | (7) | (8) |
| 693 | 0.043 | 0.023 | |||||
| 388 | 0.041 | 0.020 | |||||
| 684 | 0.036 | 0.019 | |||||
| 0.0030 | 0.0217 | |
| 0.0053 | 0.0017 | |
| 0.5321 | 0.1499 |
3.4 Correlations between physical parameters
So far, we have considered separately the constraints set by the colour-magnitude and the – relations on the ages, chemical compositions and stellar masses of early-type galaxies in our sample. Here, we explore in more detail the potential correlations between these different physical parameters, the dynamical mass and the stellar surface mass density of galaxies.
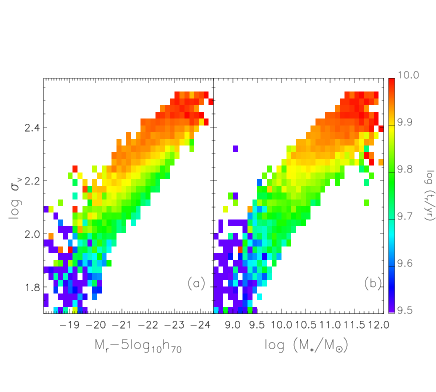
We first turn our attention to the relation between age, luminosity, velocity dispersion and stellar mass inferred from the distribution in the full parameter space described by the colour-magnitude and the – relations. Figs 6b and 10b taken together indicate that brighter galaxies or galaxies with large velocity dispersions are on average older than fainter or smaller velocity dispersion ones (consistent with the ‘downsizing’ scenario; Cowie et al. 1996, see also Section 4). In Fig. 15a, we show the relation between absolute magnitude, velocity dispersion and light-weighted age for the galaxies in our primary sample. At fixed luminosity, galaxies with large tend to be older than those with small (a result already pointed out by Forbes & Ponman 1999 and Bernardi et al. 2005). Conversely, at fixed velocity dispersion, luminous galaxies tend to be younger than faint galaxies. The dispersion in the - relation and the dependence of luminosity on age at fixed cannot be accounted for entirely by the fact that the stellar mass-to-light ratio of an evolving stellar population increases with light-weighted age. This is shown in Fig. 15b, where we plot the relation between stellar mass and velocity dispersion for the same galaxies as in Fig. 15a. The scatter of 0.252 dex about this relation is consistent with the scatter of 0.579 mag in the relation between and . There appears to be a real dependence of age on stellar mass at fixed velocity dispersion, in the sense that galaxies with large stellar masses tend to be slightly younger than those with low stellar masses (Table 4 provides simple linear fits to the relations shown in Figs 15a and b).
| Slope | Intercept | Scatter | |
|---|---|---|---|
| vs | 0.073 | ||
| vs | 0.071 | ||
| vs | 8.628 | 0.085 | |
| vs | 8.678 | 0.088 | |
| vs | 0.119 | ||
| vs | 0.122 | ||
| vs | 0.199 | ||
| vs | 0.204 |
The results of Fig. 15 motivate us to investigate more closely the relation between stellar mass and dynamical mass for early-type galaxies. We can estimate the dynamical mass (including stars and dark matter) within the optical radius of a galaxy from a combination of velocity dispersion and optical size (Cappellari et al., 2006). Here we use the radius containing 50 percent of the Petrosian flux in the -band () rather than the effective de Vaucouleurs radius (), because we do not explicitly select early-type galaxies on the basis of the shape of their light profile. Thus, a de Vaucouleurs profile may not always be an optimal fit to the photometric data, and the empirical half-light radius is more straightforward to interpret.121212The de Vaucouleurs effective radii of the galaxies in our sample are on average times larger than the Petrosian half-light radii. This arises presumably from the fact that the Petrosian flux represents typically 80 percent of the total flux in the de Vaucouleurs model (Padmanabhan et al., 2004), but this could also result (at least for a class of objects) from forcing a de Vaucouleurs fit to a flatter galaxy light profile. To estimate the dynamical mass within , we must also account for the fact that the velocity dispersion of SDSS galaxies is measured within a fixed 1.5 arcsec fibre radius. Following Jørgensen (1999), we assume that the radial profile of the velocity dispersion has a slope . The velocity dispersion at the radius is then given by
| (1) |
and the dynamical mass within by
| (2) |
In this expression, is the gravitational constant, and is a scaling factor given in Table 5, which depends on the shape of the velocity dispersion profile (this factor would be equal to 5 if we estimated the dynamical mass within the effective de Vaucouleurs radius; see Cappellari et al. 2006).
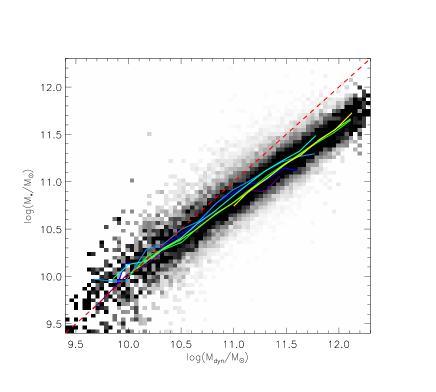
In Fig. 16, we compare the dynamical masses obtained in this way to the stellar masses derived in Paper I for the early-type galaxies in our primary sample.131313We recall that the total stellar mass is obtained by multiplying the stellar mass-to-light ratio derived from a fit of the fibre spectrum by the total luminosity of the galaxy. This assumes that the stellar mass-to-light ratio outside the fibre is the same as that inside the fibre (see Paper I). We focus on the slope of the relation, because the zero point is sensitive to our assumptions about the radius within which the dynamical mass is estimated, the conversion factor between dynamical and virial masses, and the stellar initial mass function (IMF; which we assume constant for all the galaxies). A linear fit to the relation in Fig. 16 yields
| (3) |
with a scatter of dex. The specific correction applied to has little effect on the fitted slope. As a check, we tried steeper velocity dispersion profiles, with slopes (Mehlert et al., 2003) and (Cappellari et al., 2006). These yielded relations between and with slopes and , respectively, i.e. consistent within 1 with the slope of the relation in Fig. 16. We also tested the effect of estimating the dynamical mass within the effective de Vaucouleurs radius instead of . The dynamical masses obtained in this case were systematically higher, by 0.13 dex, than those derived within . The relation between and had a slope of , i.e. slightly higher but consistent within 1 with the slope of the relation in Fig. 16. These results are summarised in Table 5.
| Radius | profile | Slope | Intercept | Scatter | |
|---|---|---|---|---|---|
| 7.14 | 2.19 | 0.127 | |||
| 6.98 | 2.18 | 0.128 | |||
| 7.02 | 2.17 | 0.128 | |||
| 5.00 | 1.93 | 0.113 |
A robust result from Fig. 16, therefore, is that the ratio between dynamical mass and stellar mass increases from the least massive to the most massive early-type galaxies in our sample. Structural non-homology does not appear to be responsible for this effect. We have built different subsamples of galaxies, based on the value of the Sersic index fitted to the light profile in the SDSS database. The slope of the relation between and within each subsample remains close to that of the relation in Fig. 16, changing from 0.847 for to 0.801 for (a de Vaucouleurs profile corresponding to ). Instead, the decrease in with stellar mass in Fig. 16 is consistent with the increase in the dynamical mass-to-light ratio () of early-type galaxies implied by the Fundamental Plane under the assumption of structural homology (Bender et al. 1992; Pierini et al. 2002; Zibetti et al. 2002; see also Cappellari et al. 2006, where no assumption on homology is made). This is also consistent with the increase in with luminosity found by Padmanabhan et al. (2004) for a sample of 29,469 SDSS elliptical galaxies. The decrease of with stellar mass could result from a more efficient mixing of dark matter and stars within the optical radius of massive galaxies relative to low-mass galaxies, as expected if the most massive early-type galaxies assembled through multiple mergers of dissipationless systems (see for discussion White, 1980; Humphrey et al., 2005; De Lucia et al., 2006; , Boylan-Kolchin, Ma & Quataert2005).
The trend in with stellar mass shows a weak dependence on galaxy light-weighted age. This is shown in Fig. 16, where lines of different colours indicate the median stellar mass as a function of dynamical mass for galaxies in various age bins, from (purple) to 10.1 (yellow). Lines of constant age run parallel to the relation and, in spite of the small scatter, it appears that, at given dynamical mass, galaxies with more mass in stars are younger than those with small stellar mass (see also Fig. 15b). This weak trend cannot be accounted for entirely by the larger amount of mass returned to the interstellar medium by evolved stars in older galaxies relative to younger ones. For the Chabrier (2003) IMF adopted here, the returned stellar mass fraction of a simple stellar population increases by about 0.03 dex from to 10 (with little dependence on metallicity; the differential change is similar for a Salpeter 1955 IMF). This effect can thus account for only about 10 percent of the trend in with age in Fig. 16.141414For example, at , stellar mass increases from for to for . The bulk of the trend might result from a systematically higher baryonic fraction and/or higher efficiency of conversion of baryons into stars in young early-type galaxies relative to old ones. For example, if many of our early-types form by a merger of star-forming systems, those which currently have the youngest populations are presumably the most recently merged and so spent the longest time in the star-forming phase.
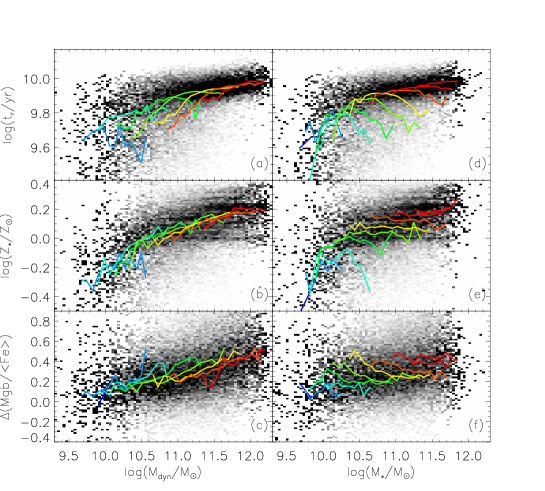
We now examine in more detail how age, stellar metallicity and /Fe ratio depend on stellar and dynamical mass. This is shown in Fig. 17 for the early-type galaxies in our primary sample (Table 4 provides simple linear fits to the relations shown in the figure). The relations followed by age, metallicity and /Fe ratio as a function of stellar mass (right-hand panels) reflect the conclusions drawn from our analysis of the CMR and – relations in Section 3.1 and 3.2. In particular, we find that light-weighted age increases (with a small scatter) with stellar mass in galaxies more massive than , while there is a clear indication of a tail towards younger ages in less massive galaxies (Panel d; see also fig.12 of Paper I). This confirms the results of several previous studies of smaller samples of early-type galaxies at low- and slightly higher redshifts (e.g. Caldwell & Rose, 1998; Poggianti et al., 2001; Thomas et al., 2005; van Dokkum & Ellis, 2003; Treu et al., 2005). Stellar metallicity increases all the way from the least massive to the most massive galaxies in our sample (Panel e). The relation tends to steepen at stellar masses less than about , i.e. the characteristic mass scale of several observed bimodalities (see Paper I, Kauffmann et al. 2003; Baldry et al. 2004). We note that the dependence of stellar metallicity on stellar mass found here for early-type galaxies resembles quite closely the relation presented by Tremonti et al. (2004) for a sample of SDSS star-forming galaxies.
The increase in metallicity with stellar mass, and hence the CMR, is a natural prediction of different scenarios of early-type galaxy formation. In models in which the galaxies form monolithically in a single dissipationless collapse, star formation and chemical enrichment are generally assumed to be interrupted by the onset of galactic winds following the major episode of star formation. Since massive galaxies with deep potential wells are able to retain their gas for much longer times and so to reach higher metallicities than less massive galaxies, this scenario accounts for the CMR as a metallicity sequence (Larson, 1974; Bressan et al., 1994; Tantalo et al., 1996; Arimoto & Yoshii, 1987). Early models of hierarchical galaxy formation neglected chemical enrichment and failed to produce sufficiently red, luminous elliptical galaxies (Kauffmann et al., 1993; Cole et al., 1994). However, subsequent renditions of these models have been able to reproduce the observed slope and scatter of the CMR and of the – relation by including chemical evolution and strong feedback even in massive galaxies together with metallicity-dependent population synthesis models (Kauffmann & Charlot, 1998; De Lucia et al., 2004). In this respect, the CMR of early-type galaxies does not represent a powerful tool to discriminate between the monolithic and merger formation scenarios (Kaviraj et al., 2005).
Additional clues about the formation of early-type galaxies may lie in their chemical abundance patterns. Fig. 17f shows that the /Fe abundance ratio, as traced by the quantity (Section 2), increases linearly with . This result, which was anticipated in several previous studies of early-type galaxies (Worthey et al., 1992; Jørgensen, 1999; Greggio, 1997), has been quantified using stellar population models with variable metal abundance ratios (Trager et al., 2000b; Mehlert et al., 2003; Thomas et al., 2005). If we consider as -enhanced those galaxies with (to account for the typical observational error on ), Fig. 17f indicates that early-type galaxies with solar abundance ratios are found only at , corresponding roughly to velocity dispersions km s-1. This is similar to the conclusion drawn by Kuntschner et al. (2001), based on the analysis of a sample of 72 early-type galaxies in groups and clusters.
The observed range in /Fe abundance ratio and the increase of this ratio with stellar mass constitute a challenge for galaxy formation models. If the enrichment in elements relative to iron reflects the star formation timescale, as is assumed in standard chemical evolution models, the values found in high-mass early-type galaxies require star formation timescales of the order 1–2 Gyr (see Section 4). Such short timescales are plausible for the onset of galactic winds in the classical monolithic collapse scenario. Hierarchical models can also produce star formation histories which are peaked at high redshift for massive early-type galaxies, although subsequent star formation is expected at lower redshift in most models (Kauffmann, 1996; Thomas, 1999). A possible solution to this problem may be the suppression of late gas cooling (and hence star formation) by AGN-driven outflows in massive early-type galaxies. As shown by various recent models of hierarchical galaxy formation accounting for the combined effects of star formation and black hole accretion, the feedback provided by active galactic nuclei can halt star formation on short timescales (Granato et al., 2001, 2004; Springel et al., 2005; Croton et al., 2006; De Lucia et al., 2006). This mechanism is expected to be most effective in massive halos hosting supermassive black holes, for which the timescale to drive outflows could be as short as 1 Gyr (Granato et al., 2004). Hence, the increase in the /Fe abundance ratio with stellar mass adds important constraints to models of early-type galaxy formation.
Fig. 17 also allows us to compare how age, metallicity and /Fe ratio vary with dynamical mass (left-hand panels) versus stellar mass (right-hand panels). In the left-hand panels, lines of different colours show the median relations between each parameter and followed by galaxies in different bins of stellar mass, increasing from to 11.7 in steps of 0.3 dex (from blue to red). In the right-hand panels, analogous lines show the median relations between each parameter and followed by galaxies in different bins of dynamical mass. Fig. 17d shows that, at fixed dynamical mass, galaxies with large tend to be younger than those with small (in agreement with the result of Fig. 15b above). This trend is noticeable for dynamical masses in the range . In contrast, at fixed dynamical mass, stellar metallicity is almost independent of (Fig. 17e). In Fig. 17f, galaxies with large tend to have slightly lower and hence /Fe than those with small at fixed . This is consistent with the trend between and age identified in Fig. 18 below. A remarkable conclusion from the comparison between the right- and left-hand panels in Fig. 17 is that the chemical composition of early-type galaxies appears to depend primarily on dynamical mass rather than stellar mass.
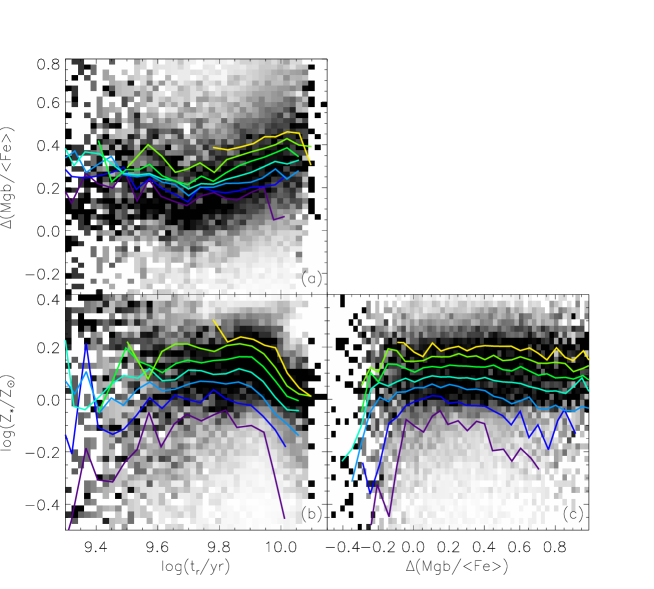
It is also of interest to examine the relations between age, metallicity and /Fe ratio. These are shown in Fig. 18 for our primary sample of early-type galaxies. In each panel, lines of different colours indicate the median trends followed by galaxies in different bins of velocity dispersion, from km s-1 (purple) to km s-1 (yellow). Fig. 18b shows that, at fixed velocity dispersion, age and metallicity are strongly anticorrelated for galaxies older than . Bernardi et al. (2005), who assume that the scatter about the CMR is caused entirely by age variations, suggest that young galaxies may be more metal-rich than older galaxies at fixed velocity dispersion. Other previous studies also invoked an age-metallicity anticorrelation to explain the tightness of the colour-magnitude and the – relations (e.g., Jørgensen 1999; Ferreras et al. 1999; Trager et al. 2000a; Terlevich & Forbes 2002, but see Kuntschner et al. 2001). However, the slope of this anticorrelation in Fig. 18b is consistent with the slope of the age-metallicity degeneracy for individual galaxies quantified in Paper I using the same sample of early-type galaxies. Thus, we cannot conclude here whether this anticorrelation is real or induced by correlated errors, but we note that the apparent scatter in age of massive, old ellipticals is consistent with the measurement error and the scatter in metallicity is quite small.
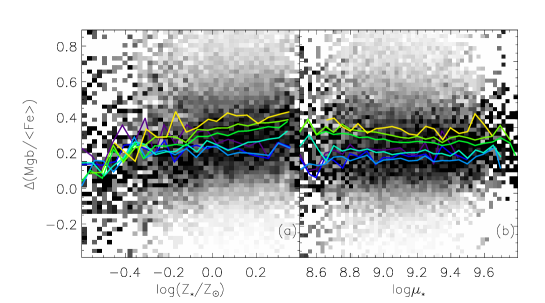
Fig. 18c shows the relation between and metallicity for the galaxies in our sample. Interestingly, even though both the colour-magnitude and the – relations imply an increase in both total metallicity and /Fe with mass, we do not identify any significant correlation between these two quantities (but see Fig. 19a below). This is true for the sample as a whole and for subsets of galaxies with fixed velocity dispersion. Instead, appears to correlate more strongly with light-weighted age for , independent of galaxy velocity dispersion (Fig. 18a). Old galaxies appear to have larger /Fe ratio than younger ones. This may be expected from the late enrichment in iron by Type Ia supernovae in galaxies which completed their star formation more recently, if the /Fe ratio reflects the star formation timescale. We might be tempted to relate star formation efficiency (and hence -enhancement) to stellar surface mass density, if the scaling between star formation rate and gas surface mass density in spiral galaxies can be extended to the progenitors of early-type galaxies (e.g. Schmidt, 1959; Kennicutt, 1998). Fig. 19b shows as a function of surface stellar mass density for the galaxies in our sample. The lines of different colours indicate the median trends followed by galaxies in different age bins, from to 10 Gyr. We do not detect any significant correlation between and surface stellar mass density. For completeness, in Fig. 19a, we show again as a function of metallicity, as in Fig. 18c (the grey scale in this case indicates the distribution of galaxies as a function of at fixed metallicity). There appears to be a mild correlation between /Fe and metallicity for galaxies in fixed age bins, in agreement with the results of Trager et al. (2000b).
4 Summary and conclusions
We have analysed a sample of 26,003 early-type galaxies selected from the SDSS DR2 on the basis of their light concentration. Light-weighted ages, stellar metallicities and stellar masses for this sample were previously derived through the comparison of a set of carefully selected spectral absorption features with a comprehensive library of high-resolution population synthesis models, encompassing the full range of physically plausible star formation histories (paper I). In addition to these physical parameters, we have considered here an empirical estimate of the -elements-to-iron abundance ratio, given by the offset between the observed ratio of the Mgb and indices of a galaxy and that predicted by the best fitting model in the library (which has scaled-solar abundance ratios). We have used these data to investigate the physical origin of two well-known scaling relations for early-type galaxies: the colour-magnitude and the – relations.
Our analysis demonstrates unambiguously and with unprecedentedly good statistics that both the colour-magnitude and the – relations are primarily sequences in galaxy stellar mass. At increasing stellar mass, as traced by either luminosity or velocity dispersion, the increasing colour and Mg-absorption line strength along the relations reflect an increase in both total metallicity and /Fe ratio. Moreover, the galaxies in our sample cover a range in age of about Gyrs, with more massive galaxies being on average older than low-mass galaxies. While at high masses early-type galaxies have the same mean age (and a small scatter in metallicity), at lower masses there is an increasing spread toward younger ages. This age spread dominates the scatter about the observed relations at low masses, in the sense that younger galaxies deviate toward bluer colours and lower index strengths than older galaxies of the same mass. These results are consistent with the conclusions from previous studies based on smaller samples of early-type galaxies (Kodama & Arimoto, 1997; Colless et al., 1999; Vazdekis, 2001; Worthey & Collobert, 2003). In addition, we find that the scatter in metallicity at fixed stellar mass contributes significantly to the scatter about the two observational scaling relations, in particular at high masses.
We have checked that our main conclusions are not affected by possible dust effects and that they are robust against sample selection. In particular, the possible contamination of our sample by bulge-dominated star-forming galaxies, which could amount to 10 percent, does not substantially affect on our results.
For a small subsample of 1765 galaxies we used information on environmental density available from Kauffmann et al. (2004) to explore the dependence of the observed scaling relations and the stellar physical parameters on environment. We have found a small but detectable difference in the zero-point of the two relations, in the sense that early-type galaxies in dense environments tend to have redder colours and stronger absorption indices than galaxies in low-density regions, at fixed luminosity or velocity dispersion. We also find a systematic increase in the scatter about both relations from high to low densities. These variations appear to be induced by small differences in the light-weighted age and metallicity of galaxies located in different environments. While galaxies with similar mass have the same element abundance ratio regardless of environment, there is an increasing spread toward younger ages and lower metallicities in low-density environments. At fixed stellar mass, early-type galaxies in dense regions are on average 0.02 dex older and more metal-rich than early-type galaxies in low-density regions. We note that these trends are very small and it will be worth re-examining them when a better statistics is available. If confirmed, these results are in agreement with previous studies indicating that early-type galaxies in clusters started to form stars earlier than, but on the same timescale as early-type galaxies in the field (e.g. Thomas et al., 2005; Bernardi et al., 2006; Clemens et al., 2006).
We have also studied the dependence of the stellar mass on the dynamical mass estimated within the -band Petrosian half-light radius of a galaxy. The relation is well described by a power law of exponent (equation 3), implying a decrease in the stellar-to-dynamical mass ratio from low- to high-mass galaxies. The correlations of physical parameters with the dynamical mass estimated in this way suggests that metallicity and element abundance ratios in early-type galaxies are more fundamentally related to dynamical mass than to stellar mass.
The increase in total metallicity with dynamical mass favours the classical interpretation of the colour-magnitude and – relations in terms of supernova-driven winds (e.g. Trager et al., 2000a; Thomas et al., 2005). To account for the simultaneous increase in total metallicity and /Fe ratio with mass, galactic winds should occur at early times, i.e. prior to the onset of Type Ia supernovae (on a timescale of a few Gyr), which are the main contributors to Fe-peak elements. The winds will be more effective in removing elements (produced by Type II supernovae on a time scale of yr) from low-mass galaxies with shallow potential wells, while they should not reduce significantly the fraction of primordial gas and hence star formation (Mac Low & Ferrara, 1999). Much observational evidence has been accumulated for the importance of galactic outflows in galaxies with masses up to at least (Lehnert & Heckman, 1996; Heckman et al., 2000; Pettini et al., 2000). Our results, if interpreted in terms of galactic winds, indicate that even more massive galaxies (with masses up to in stars) have been affected by the ejection of metals through galactic winds.
The above scenario, however, cannot account alone for the observed values of /Fe in early-type galaxies. In a galactic-wind scenario, massive galaxies are predicted to have solar /Fe abundance ratios, while low-mass galaxies, which lose elements at early times, should have lower than solar /Fe ratios. Instead, galaxies with stellar masses less than about (corresponding to velocity dispersions less than km s-1) are observed to have nearly solar /Fe ratios, while this ratio increases to super-solar values in more massive galaxies (the quantity reaching values around 0.3 in galaxies with stellar masses near ; see Fig. 17).
The super-solar /Fe abundance ratios of massive early-type galaxies suggest that these formed on a relatively short timescale and/or have/have had an IMF skewed towards high-mass stars. An IMF enriched in massive stars will produce a larger ratio of Type II to Type Ia supernovae, and hence a larger /Fe ratio. Nagashima et al. (2005) have shown that a top-heavy IMF during the burst ignited by the major merger that formed an elliptical galaxy can reproduce the observed range in /Fe ratios. However, none of the models they explore yields the observed correlation of /Fe with velocity dispersion (a model in which thermal conduction prevents the gas from cooling at the centres of massive halos is able to produce an increase in the -element abundance, but not the /Fe ratio, with mass).
An interpretation of the /Fe ratio in terms of the star formation timescale is supported by the correlation we find between and light-weighted age, independent of mass (Fig. 18). This suggests that galaxies with longer star formation timescales (and thus with more recently formed stellar populations) have lower /Fe ratio than galaxies formed on shorter timescales, because they had time to recycle the Fe-peak elements ejected by Type Ia supernovae. We also find that light-weighted age increases with stellar mass with negligible scatter at masses above (Fig. 17d). Early-type galaxies less massive than about display an extended tail toward younger ages, the mean age declining markedly with decreasing mass. This suggests either that low-mass galaxies formed more recently than high-mass galaxies, or that they have a more extended star formation history (consistent with their solar /Fe ratios).
Our results represent further evidence for a shift in stellar growth toward less massive galaxies in recent epochs (Cowie et al., 1996; De Lucia et al., 2004; Kodama & et al., 2004; Yi et al., 2005; Treu et al., 2005). This ‘downsizing’ scenario may appear at odds with the expectations of original hierarchical models of galaxy formation. However, observations and the hierarchical paradigm can be reconciled if detailed physics of feedback from supernovae, active galactic nuclei or thermal conduction is introduced (e.g. Benson et al., 2003; Granato et al., 2004; Nagashima et al., 2005). These sources of feedback could inhibit star formation on timescales short enough for the bulk of the star formation to be completed before Type Ia supernovae can substantially increase the iron abundance in massive galaxies. Springel et al. (2005) have shown that, in major mergers of spiral galaxies hosting supermassive black holes, AGN feedback provides a mechanism that can quench star formation on short timescales. This mechanism is more efficient in the most massive early-type galaxies and leaves dwarf spheroids almost unaffected. We also note that the short star formation timescales (i.e. high formation redshifts) of massive early-type galaxies do not preclude longer assembly timescales (De Lucia et al., 2006): massive early-type galaxies could appear old even if they assembled relatively recently. In this context, the new constraints derived here on the physical origin of the colour-magnitude and – relations for early-type galaxies represent a valuable reference for future models.
Acknowledgments
We thank Mariangela Bernardi for helpful discussion on sample selection and the anonymous referee for valuable suggestions that have improved our analysis. A.G. and S.C. thank the Alexander von Humboldt Foundation, the Federal Ministry of Education and Research, and the Programme for Investment in the Future (ZIP) of the German Government for funding through a Sofja Kovalevskaja award. A.G. thanks the European Association for Research in Astronomy training site (EARA) and the European Community for a Marie Curie EST fellowship (MEST-CT-2004-504604). J.B. acknowledges the receipt of FCT fellowship BPD/14398/2003.
Funding for the creation and distribution of the SDSS Archive has been provided by the Alfred P. Sloan Foundation, the Participating Institutions, the National Aeronautics and Space Administration, the National Science Foundation, the US Department of Energy, the Japanese Monbukagakusho, and the Max Planck Society. The SDSS Web site is http://www.sdss.org/. The Participating Institutions are the University of Chicago, Fermilab, the Institute for Advanced Study, the Japan Participation Group, the Johns Hopkins University, the Max Planck Institute for Astronomy (MPIA), the Max Planck Institute for Astrophysics (MPA), New Mexico State University, Princeton University, the United States Naval Observatory, and the University of Washington.
References
- Abazajian et al. (2004) Abazajian K., et al. 2004, AJ, 128, 502
- Abraham et al. (1996) Abraham R. G., Smecker-Hane T. A., Hutchings J. B., Carlberg R. G., Yee H. K. C., Ellingson E., Morris S., Oke J. B., Rigler M., 1996, ApJ, 471, 694
- Arimoto & Yoshii (1987) Arimoto N., Yoshii Y., 1987, A&A, 173, 23
- Baldry et al. (2004) Baldry I. K., Glazebrook K., Brinkmann J., Ivezić Ž., Lupton R. H., Nichol R. C., Szalay A. S., 2004, ApJ, 600, 681
- Baldwin et al. (1981) Baldwin A., Phillips M. M., Terlevich R., 1981, PASP, 93, 817
- Baum (1959) Baum W. A., 1959, PASP, 71, 106
- Bender et al. (1992) Bender R., Burstein D., Faber S. M., 1992, ApJ, 399, 462
- Bender et al. (1993) Bender R., Burstein D., Faber S. M., 1993, ApJ, 411, 153
- Benson et al. (2003) Benson A. J., Bower R. G., Frenk C. S., Lacey C. G., Baugh C. M., Cole S., 2003, ApJ, 599, 38
- Bernardi et al. (1998) Bernardi M., Renzini A., da Costa L. N., Wegner G., Alonso M. V., Pellegrini P. S., Rité C., Willmer C. N. A., 1998, ApJ, 508, L143
- Bernardi et al. (2003a) Bernardi M., et al. 2003a, AJ, 125, 1817
- Bernardi et al. (2003b) Bernardi M., et al. 2003b, AJ, 125, 1849
- Bernardi et al. (2003c) Bernardi M., et al. 2003c, AJ, 125, 1866
- Bernardi et al. (2003d) Bernardi M., et al. 2003d, AJ, 125, 1882
- Bernardi et al. (2005) Bernardi M., Sheth R. K., Nichol R. C., Schneider D. P., Brinkmann J., 2005, AJ, 129, 61
- Bernardi et al. (2006) Bernardi M., Nichol R. C., Sheth R. K., Miller C. J., Brinkmann J., 2006, AJ, 131, 1288
- Blakeslee et al. (2003) Blakeslee J. P., et al. 2003, ApJ, 596, L143
- Bower et al. (1992) Bower R. G., Lucey J. R., Ellis R. S., 1992, MNRAS, 254, 589
- (19) Boylan-Kolchin M., Ma C-P., Quataert E., 2005, MNRAS, 362, 184
- Bressan et al. (1994) Bressan A., Chiosi C., Fagotto F., 1994, ApJS, 94, 63
- Brinchmann et al. (2004) Brinchmann J., Charlot S., White S. D. M., Tremonti C., Kauffmann G., Heckman T., Brinkmann J., 2004, MNRAS, 351, 1151
- Bruzual & Charlot (2003) Bruzual G., Charlot S., 2003, MNRAS, 344, 1000
- Burstein et al. (1988) Burstein D., Davies R. L., Dressler A., Faber S. M., Lynden-Bell D., Terlevich R., Wegner G., 1988, in IAU Symp. 130: Large Scale Structures of the Universe Spiral Galaxies, Elliptical Galaxies and the Large-Scale Velocity Field Within 3500 Km/s of the Local Group. pp 177–+
- Caldwell & Rose (1998) Caldwell N., Rose J. A., 1998, AJ, 115, 1423
- Caldwell et al. (2003) Caldwell N., Rose J. A., Concannon K. D., 2003, AJ, 125, 2891
- Cappellari et al. (2006) Cappellari M., et al. 2006, MNRAS, 366, 1126
- Chabrier (2003) Chabrier G., 2003, PASP, 115, 763
- Clemens et al. (2006) Clemens M. S., Bressan A., Nikolic B., Alexander P., Annibali F., Rampazzo, R., 2006, astro-ph/0603714
- Cole et al. (1994) Cole S., Aragon-Salamanca A., Frenk C. S., Navarro J. F., Zepf S. E., 1994, MNRAS, 271, 781
- Colless et al. (1999) Colless M., Burstein D., Davies R. L., McMahan R. K., Saglia R. P., Wegner G., 1999, MNRAS, 303, 813
- Cowie et al. (1996) Cowie L. L., Songaila A., Hu E. M., Cohen J. G., 1996, AJ, 112, 839
- Croton et al. (2006) Croton D. J., Springel V., White S. D. M., De Lucia G., Frenk C. S., Gao L., Jenkins A., Kauffmann G., Navarro J. F., Yoshida N., 2006, MNRAS, 365, 11
- De Lucia et al. (2004) De Lucia G., Kauffmann G., White S. D. M., 2004, MNRAS, 349, 1101
- De Lucia et al. (2004) De Lucia G., Poggianti B. M., Aragón-Salamanca A., Clowe D., Halliday C., Jablonka P., Milvang-Jensen B., Pelló R., Poirier S., Rudnick G., Saglia R., Simard L., White S. D. M., 2004, ApJ, 610, L77
- De Lucia et al. (2006) De Lucia G., Springel V., White S. D. M., Croton D., Kauffmann G., 2006, MNRAS, 366, 499
- Denicoló et al. (2005) Denicoló G., Terlevich R., Terlevich E., Forbes D. A., Terlevich A., 2005, MNRAS, 358, 813
- de Vaucouleurs (1961) de Vaucouleurs G., 1961, ApJS, 5, 233
- Djorgovski & Davis (1987) Djorgovski S., Davis M., 1987, ApJ, 313, 59
- Faber (1973) Faber S. M., 1973, ApJ, 179, 731
- Faber & Jackson (1976) Faber S. M., Jackson R. E., 1976, ApJ, 204, 668
- Ferreras et al. (1999) Ferreras I., Charlot S., Silk J., 1999, ApJ, 521, 81
- Forbes & Ponman (1999) Forbes D. A., Ponman T. J., 1999, MNRAS, 309, 623
- Gallazzi et al. (2005) Gallazzi A., Charlot S., Brinchmann J., White S. D. M., Tremonti C. A., 2005, MNRAS, 362, 41
- Gonzalez et al. (1993) Gonzalez J. J., Faber S. M., Worthey G., 1993, Bulletin of the American Astronomical Society, 25, 1355
- Granato et al. (2004) Granato G. L., De Zotti G., Silva L., Bressan A., Danese L., 2004, ApJ, 600, 580
- Granato et al. (2001) Granato G. L., Silva L., Monaco P., Panuzzo P., Salucci P., De Zotti G., Danese L., 2001, MNRAS, 324, 757
- Greggio (1997) Greggio L., 1997, MNRAS, 285, 151
- Guzman et al. (1992) Guzman R., Lucey J. R., Carter D., Terlevich R. J., 1992, MNRAS, 257, 187
- Heckman et al. (2000) Heckman T. M., Lehnert M. D., Strickland D. K., Armus L., 2000, ApJS, 129, 493
- Hogg et al. (2004) Hogg D. W., et al. 2004, ApJ, 601, L29
- Humphrey et al. (2005) Humphrey P. J., Buote D. A., Gastaldello F., Zappacosta L., Bullock J. S., Brighenti F., Mathews W. G., 2005, astro-ph/0510819
- Jørgensen (1999) Jørgensen I., 1999, MNRAS, 306, 607
- Jørgensen et al. (1996) Jørgensen I., Franx M., Kjaergaard P., 1996, MNRAS, 280, 167
- Kauffmann (1996) Kauffmann G., 1996, MNRAS, 281, 487
- Kauffmann & Charlot (1998) Kauffmann G., Charlot S., 1998, MNRAS, 294, 705
- Kauffmann et al. (2003) Kauffmann G., et al. 2003, MNRAS, 341, 54
- Kauffmann et al. (2004) Kauffmann G., White S. D. M., Heckman T. M., Ménard B., Brinchmann J., Charlot S., Tremonti C., Brinkmann J., 2004, MNRAS, 353, 713
- Kauffmann et al. (1993) Kauffmann G., White S. D. M., Guiderdoni B., 1993, MNRAS, 264, 201
- Kaviraj et al. (2005) Kaviraj S., Devriendt J. E. G., Ferreras I., Yi S. K., 2005, MNRAS, 360, 60
- Kennicutt (1998) Kennicutt R. C., 1998, ApJ, 498, 541
- Kodama & Arimoto (1997) Kodama T., Arimoto N., 1997, A&A, 320, 41
- Kodama et al. (1998) Kodama T., Arimoto N., Barger A. J., Arag’on-Salamanca A., 1998, A&A, 334, 99
- Kodama et al. (1999) Kodama T., Bower R. G., Bell E. F., 1999, MNRAS, 306, 561
- Kodama & et al. (2004) Kodama T., et al. ., 2004, MNRAS, 350, 1005
- Kormendy (1977) Kormendy J., 1977, ApJ, 218, 333
- Korn et al. (2005) Korn A. J., Maraston C., Thomas D., 2005, A&A, 438, 685
- Kuntschner et al. (2001) Kuntschner H., Lucey J. R., Smith R. J., Hudson M. J., Davies R. L., 2001, MNRAS, 323, 615
- Kuntschner et al. (2002) Kuntschner H., Smith R. J., Colless M., Davies R. L., Kaldare R., Vazdekis A., 2002, MNRAS, 337, 172
- Larson (1974) Larson R. B., 1974, MNRAS, 166, 585
- Larson et al. (1980) Larson R. B., Tinsley B. M., Caldwell C. N., 1980, ApJ, 237, 692
- Lehnert & Heckman (1996) Lehnert M. D., Heckman T. M., 1996, ApJ, 462, 651
- Mac Low & Ferrara (1999) Mac Low M., Ferrara A., 1999, ApJ, 513, 142
- Mehlert et al. (2003) Mehlert D., Thomas D., Saglia R. P., Bender R., Wegner G., 2003, A&A, 407, 423
- Nagashima et al. (2005) Nagashima M., Lacey C. G., Baugh C. M., Frenk C. S., Cole S., 2005, MNRAS, 358, 1247
- Nagashima et al. (2005) Nagashima M., Lacey C. G., Okamoto T., Baugh C. M., Frenk C. S., Cole S., 2005, MNRAS, 363L, 31
- Nelan et al. (2005) Nelan J. E., Smith R. J., Hudson M. J., Wegner G. A., Lucey J. R., Moore S. A. W., Quinney S. J., Suntzeff N. B., 2005, ApJ, 632, 137
- Padmanabhan et al. (2004) Padmanabhan N., et al. 2004, New Astronomy, 9, 329
- Pettini et al. (2000) Pettini M., Steidel C. C., Adelberger K. L., Dickinson M., Giavalisco M., 2000, ApJ, 528, 96
- Pierini et al. (2002) Pierini D., Gavazzi G., Franzetti P., Scodeggio M., Boselli A., 2002, MNRAS, 332, 422
- Pimbblet et al. (2002) Pimbblet K. A., Smail I., Kodama T., Couch W. J., Edge A. C., Zabludoff A. I., O’Hely E., 2002, MNRAS, 331, 333
- Poggianti et al. (2001) Poggianti B. M., Bridges T. J., Carter D., Mobasher B., Doi M., Iye M., Kashikawa N., Komiyama Y., Okamura S., Sekiguchi M., Shimasaku K., Yagi M., Yasuda N., 2001, ApJ, 563, 118
- Poggianti et al. (2001) Poggianti B. M., Bridges T. J., Mobasher B., Carter D., Doi M., Iye M., Kashikawa N., Komiyama Y., Okamura S., Sekiguchi M., Shimasaku K., Yagi M., Yasuda N., 2001, ApJ, 562, 689
- Renzini (2006) Renzini A., 2006, astro-ph/0603479
- Salpeter (1955) Salpeter E. E., 1955, ApJ, 121, 161
- Schmidt (1959) Schmidt M., 1959, ApJ, 129, 243
- Schweizer & Seitzer (1992) Schweizer F., Seitzer P., 1992, AJ, 104, 1039
- Shimasaku et al. (2001) Shimasaku K., et al. 2001, AJ, 122, 1238
- Springel et al. (2005) Springel V., Di Matteo T., Hernquist L., 2005, MNRAS, 361, 776
- Stanford et al. (1998) Stanford S. A., Eisenhardt P. R., Dickinson M., 1998, ApJ, 492, 461
- Strateva et al. (2001) Strateva I., et al. 2001, AJ, 122, 1861
- Tantalo et al. (1996) Tantalo R., Chiosi C., Bressan A., Fagotto F., 1996, A&A, 311, 361
- Terlevich & Forbes (2002) Terlevich A. I., Forbes D. A., 2002, MNRAS, 330, 547
- Terlevich et al. (1999) Terlevich A. I., Kuntschner H., Bower R. G., Caldwell N., Sharples R. M., 1999, MNRAS, 310, 445
- Thomas (1999) Thomas D., 1999, MNRAS, 306, 655
- Thomas et al. (2003) Thomas D., Maraston C., Bender R., 2003, MNRAS, 339, 897
- Thomas et al. (2005) Thomas D., Maraston C., Bender R., de Oliveira C. M., 2005, ApJ, 621, 673
- Thomas et al. (2004) Thomas D., Maraston C., Korn A., 2004, MNRAS, 351, L19
- Trager et al. (2000a) Trager S. C., Faber S. M., Worthey G., González J. J., 2000a, AJ, 120, 165
- Trager et al. (2000b) Trager S. C., Faber S. M., Worthey G., González J. J., 2000b, AJ, 119, 1645
- Tremonti et al. (2004) Tremonti C. A., et al. 2004, ApJ, 613, 898
- Treu et al. (2005) Treu T., Ellis R. S., Liao T. X., van Dokkum P. G., 2005, ApJ, 622, L5
- van Dokkum & Ellis (2003) van Dokkum P. G., Ellis R. S., 2003, ApJ, 592, L53
- Vazdekis (2001) Vazdekis A., 2001, Ap&SS, 276, 921
- Vazdekis et al. (2001) Vazdekis A., Kuntschner H., Davies R. L., Arimoto N., Nakamura O., Peletier R., 2001, ApJ, 551, L127
- Visvanathan & Sandage (1977) Visvanathan N., Sandage A., 1977, ApJ, 216, 214
- White (1980) White S. D. M., 1980, MNRAS, 191, 1P
- Worthey (1994) Worthey G., 1994, ApJS, 95, 107
- Worthey & Collobert (2003) Worthey G., Collobert M., 2003, ApJ, 586, 17
- Worthey et al. (1992) Worthey G., Faber S. M., Gonzalez J. J., 1992, ApJ, 398, 69
- Yi et al. (2005) Yi S. K., et al. 2005, ApJ, 619, L111
- York et al. (2000) York D. G., et al. 2000, AJ, 120, 1579
- Zibetti et al. (2002) Zibetti S., Gavazzi G., Scodeggio M., Franzetti P., Boselli A., 2002, ApJ, 579, 261