Early multi-wavelength emission from Gamma-ray Bursts: from Gamma-ray to X-ray
Abstract
The study of the early high-energy emission from both long and short Gamma-ray bursts has been revolutionized by the Swift mission. The rapid response of Swift shows that the non-thermal X-ray emission transitions smoothly from the prompt phase into a decaying phase whatever the details of the light curve. The decay is often categorized by a steep-to-shallow transition suggesting that the prompt emission and the afterglow are two distinct emission components. In those GRBs with an initially steeply-decaying X-ray light curve we are probably seeing off-axis emission due to termination of intense central engine activity. This phase is usually followed, within the first hour, by a shallow decay, giving the appearance of a late emission hump. The late emission hump can last for up to a day, and hence, although faint, is energetically very significant. The energy emitted during the late emission hump is very likely due to the forward shock being constantly refreshed by either late central engine activity or less relativistic material emitted during the prompt phase. In other GRBs the early X-ray emission decays gradually following the prompt emission with no evidence for early temporal breaks, and in these bursts the emission may be dominated by classical afterglow emission from the external shock as the relativistic jet is slowed by interaction with the surrounding circum-burst medium. At least half of the GRBs observed by Swift also show erratic X-ray flaring behaviour, usually within the first few hours. The properties of the X-ray flares suggest that they are due to central engine activity. Overall, the observed wide variety of early high-energy phenomena pose a major challenge to GRB models.
pacs:
98.70.Rz, 95.85.Nv, 95.85.Pw, 97.60.Lf1 Introduction
Gamma-ray bursts (GRBs) are detected as bright, brief flashes of gamma-rays which occur at some random location on the sky. For a short time, typically a few tens of seconds, the GRB is the brightest single object in the gamma-ray sky, and more importantly is the intrinsically brightest object in the Universe. It is now generally accepted that long-duration GRBs result from the death of a rapidly-rotating massive star (a collapsar) while short-duration GRBs arise from a merger of two compact objects, most likely two neutron stars or a neutron star and a black hole (see [1, 2, 3, 4] and references therein). Either the collapsar or merger result in a black hole fed for a short time by an accretion disk or torus. The accreting black hole can somehow power a relativistic jet, presumably oriented along the rotation axis of the black hole. The jet contains a relatively modest amount of baryonic material moving at very high Lorentz factor – the fireball. Within the jet the flow is not homogeneous, leading to internal shocks which produce the initial, prompt gamma-rays that can be viewed if our line-of-sight lies within the jet beam. As the jet moves out from the progenitor, it also encounters circum-stellar and inter-stellar material which results in classical afterglow emission produced by an external shock ([4] and references therein). We observe some combination of these emission components and require as continuous and lengthy an observation as possible in order to disentangle them and hence test GRB models.
In this article we discuss the early gamma-ray and X-ray emission from GRBs, concentrating on the observed temporal and spectral behaviour as the GRB evolves over the first few hours. Early GRB observations have been revolutionized following the launch of the Swift satellite on 20 November 2004 [5]. Although gamma-ray emission can typically be detected by the Burst Alert Telescope (BAT; [6]) on Swift for only a few tens of seconds, the satellite can rapidly (s) slew to point its Ultraviolet and Optical Telescope (UVOT; [7]) and X-ray Telescope (XRT; [8]) at the GRB. The XRT permits observations in the 0.3–10 keV band. This capability has ended what might be termed the“X-ray dark ages” for GRBs as previous missions rarely obtained X-ray data in the period from a few minutes to a few hours. It is this capability that we will exploit to describe the early high-energy emission from GRBs.
In section 2 we provide an historical overview and outline why Swift was built. The observational results are summarised in section 3, in which the emphasis is on the new phenomena revealed by Swift. Conclusions are given in section 4.
2 Historical overview
Gamma-ray bursts were first announced as MeV events lasting between 0.1 and 30s, not from the Earth or Sun [9]. Their discovery led to the inclusion of the BATSE instrument on the Compton Gamma-Ray Observatory, which was operational between 1991 and 2000. See [10] for a BATSE-era review. BATSE acted as an all sky monitor over 20–600 keV, detecting around 2,700 GRBs. The striking isotropy of these GRBs indicated an origin either very close by or at cosmological distances, but the BATSE GRB position uncertainties of 4 arc-minutes or larger prevented identification of possible counterparts in other regions of the electromagnetic spectrum. Even so, tantalising details did emerge from the large BATSE GRB sample: the burst duration distribution was found to be bimodal, with a population of short and spectral hard bursts having durations of around 0.1–2s and a larger group of slightly softer bursts with typical durations of 10–100s [11]; and the distribution of burst intensities was non-Euclidian, pointing to a distance effect in the population.
Over the BATSE bandpass, GRB spectra were shown to be non-thermal and usually well fitted by a broken power law or Band function [12, 13]. A minority of the GRBs detected by BATSE were also detected at higher energies by the EGRET or COMPTEL instruments on CGRO. Aside from a few exceptions [14], the extrapolation of the Band function fitted the very high energy spectra well [15, 16]. The burst profiles, which were highly variable, defied classification.
It was not until the Beppo-SAX satellite (1996–2002) coded-mask hard X-ray Wide Field Camera detected bursts, that a GRB was rapidly observed with an imaging X-ray telescope. The discovery of a fading X-ray afterglow to GRB970228 [17] ushered in a new era in which positions sufficiently precise became available quickly enough for ground-based follow up observations. Faint optical afterglows were discovered, and it was quickly established that GRBs occurred at very large distances (the first redshift was measured for GRB970508 at [18]).
With the distance scale known, the energetics of GRBs were thrown into sharp relief. The observed fluences (the flux integrated over the duration of the burst) and redshifts led to isotropic energies of erg, comparable to or larger than those of supernovae. The very high gamma-ray luminosity leads to a compactness problem caused by the high electron-positron pair production rate. This can be solved by invoking a very high outflow velocity, with Lorentz factor, – 300 [19, 20].
A connection with supernovae was soon revealed by GRB980425/SN1998bw, although this was an atypically nearby and low energy burst [21, 22]. The supernova nevertheless showed very high velocities (tens of thousands of kilometers per second), and was given a new classification as a hypernova. The more typical GRB030329 confirmed the hypernova connection [23, 24], firmly establishing the collapsar model for long GRBs. Optical observations of GRB afterglow decays also showed a break to an increased decay rate at around a few days. This was taken to be a sign that the relativistic beaming of the slowing collapsar ejecta had declined to the opening angle of the ejecta jet, , derived to be – 40 degrees, [25]). This evidence for a jet rather than isotropic ejecta simultaneously reduced the energetics of the GRB to erg, and of course increased the implied GRB production rate. See [4] for an excellent review of GRB knowledge before the launch of Swift.
Prior to Swift, afterglows had only been securely detected for long GRBs. The expectation was that short GRBs might have a different progenitor (e.g., a neutron star – neutron star collision), however the lack of any short GRB afterglows and hence precise positions for these bursts had prevented the kind of progress made with the long GRBs. Swift was created to provide accurate and prompt positions for both short and long GRBs. The great difficulty of obtaining early X-ray observations with existing satellites had led to very poor knowledge of the afterglow behaviour before around 8 hours. Swift has shown the richness of this interval, and has clarified the nature of the short GRBs. There is much still to be understood, but Swift is delivering a wonderfully rich scientific return.
3 Observations in the Swift era
Since launch Swift has detected an average of 2 GRBs per week. The standard sequence of observations starts with detection by the BAT. The on-board software then determines if it is safe to slew, and if so commands the spacecraft to turn and point its narrow-field instruments at the burst location. The slew typically takes 1–2 minutes. Thus, for the longest duration bursts, XRT and UVOT observations can begin while the BAT is still detecting the GRB. This capability of rapid, autonomous response provides data which have revealed a wealth of phenomena in the X-ray afterglow. Swift has detected a wide range of bursts including the highest redshift GRB to date [26] and the first localization of a short burst [27].
We adopt the convention here of describing GRBs as long or short in terms of the timescale over which 90% of the gamma-rays were detected — the T90 parameter. GRBs with T90 greater than or less than 2s are denoted long or short bursts respectively [11]. The GRB X-ray flux can be represented as a function of time and frequency using a function , where is the spectral index and is the temporal index. The photon index is related to by .
The Swift data presented here were processed using the standard analysis software. The BAT data were processed using Swift software v2.0 as described in the BAT Ground Analysis Software Manual [28] and then light curves and spectra were extracted over 15–150 keV. Power laws were fitted over the T90 period to provide spectral indices (). In most cases a single power law provides a statistically acceptable fit (i.e., reduced chi-squared, ), although on occasion a cutoff power law provides a better fit. Similar power law fits were used to parameterise the XRT spectra (), over 0.3–10 keV. For many GRBs intrinsic absorption in addition to the Galactic column is required to provide a good fit. The required intrinsic column is in the range 2–35 cm2 [29, 30].
Analysis of a large GRB sample [30] shows that the XRT spectra of GRBs usually require a softer power law than the BAT spectra (i.e. ). To form unabsorbed, 0.3–10 keV flux light curves for each GRB, we therefore (a) converted the XRT count rates into unabsorbed fluxes using the XRT power law spectral model and (b) converted the BAT count rates into unabsorbed fluxes by extrapolating the BAT data to the XRT band using a power law spectral model with an absorbing column derived from the XRT data and a spectral index which is the mean of the XRT and best-fit BAT spectral indices. In those GRBs which have high signal-to-noise ratio data, more complex spectral evolution can be seen, but the above procedure has been applied for consistency for all bursts discussed in this paper.
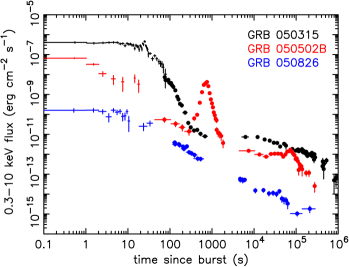
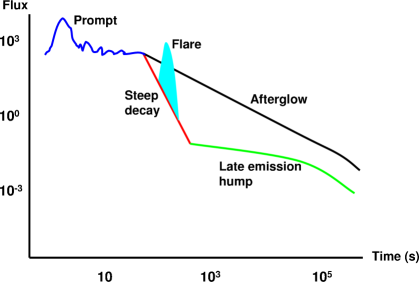
The initial Swift results appeared contradictory; some long-duration bursts displayed a rapid decline in the first hour, with temporal decay indices, [31, 32], while in others the early X-ray flux declined more gradually with [33]. Several of those with a steep decline also displayed a shallower decay starting within an hour and lasting up to a day from trigger. A large fraction of GRBs also have X-ray “flares” during the first few hours superimposed on the declining light curves. Examples of the various observational phenomena are shown in Fig. 1. Here, GRB050315 shows a steep decline followed by a long shallower decay before breaking again at late times; GRB050502B displays a large X-ray flare, while GRB050826 shows a gradual decline after the prompt emission. As more bursts have been observed a pattern has emerged which is summarised schematically in Fig. 2 (see also [34, 35, 30]). Each of these phenomena are discussed below, but the overall behaviour is as follows:
-
1.
The “prompt” emission is that emitted directly during the burst. With Swift this emission is seen by the BAT but can also be detected by the XRT if the burst is long enough to last until the completion of the first slew to target. Most bursts observed by Swift typically have a 15–150 keV spectral index of – 2 during the prompt phase.
-
2.
The prompt phase is followed by a power law decline phase. The first temporal index, , during this phase can be very large (up to ) and in most GRBs , but in a significant minority, perhaps 20–30%, a gradual decline is observed with . The wide range in temporal index suggests several emission processes may be involved. The spectral index in the 0.3–10 keV band during this phase is usually in the range 0.5–2.5, although occasionally larger values are seen.
-
3.
For those bursts which initially decline steeply, the decay breaks to a shallower rate, typically within the first hour, such that . This “late emission hump”, can last for up to s before breaking to a steeper decay. The late emission hump appears to have a harder spectrum on average than the steep decline phase (section 3.3). It can have a fluence equal to that of the prompt phase [30], so although faint in observed flux, this phase is energetically very significant.
-
4.
For those bursts which initially decline gradually the temporal and spectral indices are broadly consistent with a “classical afterglow” interpretation, in which the X-ray emission comes from the external shock. In these GRBs the late emission hump is usually not seen. This does not mean that the late emission hump is absent as it may be hidden by the classical afterglow component.
-
5.
Limited statistics make quantifying later phases difficult, but both the initially steeply declining bursts and those that decline more gradually can show a late temporal break (typically at – s) to a steeper decay. These late breaks are not seen in all GRBs — some decay continuously beyond s until they fade below the Swift XRT detection limit. There is usually no evidence for spectral changes during late temporal breaks, which can be represented either as a series of temporal breaks using multiple broken power laws or a smoothly curving decay (e.g. [32]).
-
6.
X-ray flares are seen in the first few hours for around half of the GRBs observed by Swift, and occur in GRBs which decline rapidly or gradually. The majority of these flares are only detected in the XRT but in some bright, long bursts flares are observed simultaneously with the BAT. Strong spectral evolution can be observed in some cases. Most of the X-ray flares are energetically small, but a few are very powerful [36, 37, 38] with a fluence comparable to that of the prompt phase. Late flares are also occasionally seen.
-
7.
The X-ray light curves for short bursts have been less well studied by Swift as they are fainter (on average) and Swift has detected fewer examples of short bursts. To date, the short burst light curves display a range in phenomena remarkably similar to those seen in the long bursts, including either rapid or gradual decay, flares and a late emission hump [39, 40].
The behavioural pattern of prompt emission followed by a steep X-ray decay and then a shallow decay has been characterised as the “canonical GRB light curve” [34]. But, while this pattern is seen in a majority of GRBs, as outlined above, it is not observed in all. To understand the various phases we need to consider each of them in turn.
3.1 The prompt phase
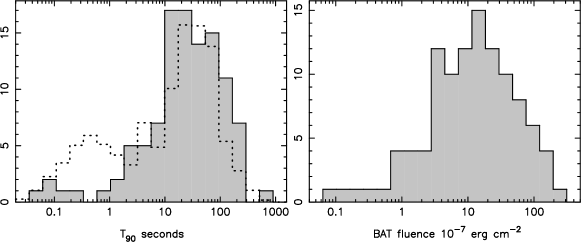
BAT has detected and located on-board the prompt emission of GRBs at a rate of approximately 100 yr-1. In terms of duration, BAT GRBs span the same range as those detected by the BATSE instrument, as illustrated in Fig. 3. The BAT data are for those GRBs with values of T90, 15–150 keV fluence and spectral index available from the data table on the Swift web site [41] as of mid-February 2006. While the parameters given in the data table are preliminary, the shape of the distribution does not change significantly if data from the forthcoming Swift catalog are used (T. Sakamoto, private communication). The BATSE data plotted in Fig. 3 are those from the revised 4B catalog [42]. Comparing the BAT and BATSE distributions is difficult due to their different energy-dependent sensitivities and trigger software [43], but as for BATSE, most Swift GRBs have durations of 10 to 100s and have a 15–150 keV fluence within a factor of 10 of erg cm-2. Fig. 4 shows how BAT fluence correlates with T90, illustrating that the shortest GRBs have much less fluence than the longest.
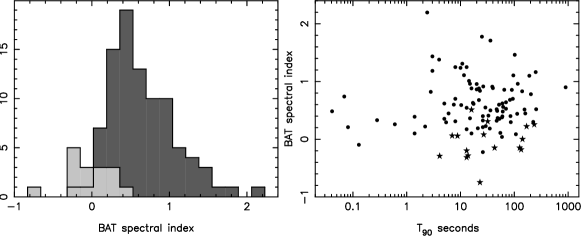
The spectral indices derived from spectral fits to the 15–150 keV BAT data are shown in Fig. 5. Due to differences between the BAT and BATSE detector energy bands and how BAT uses rate triggers plus image-accumulation to find a point source, the BAT is more sensitive than BATSE to long, soft bursts and detects relatively fewer short, hard bursts than might be expected despite its greater sensitivity to short triggers [43]. Thus, the large majority of all BAT detected bursts lie in the long, soft category, and include amongst them the highest redshift bursts yet detected. There is some indication from Fig. 5 that shorter bursts are spectrally harder, as previously noted for BATSE bursts [11], but a much larger sample is required to confirm this trend.

3.2 The early decay phase
One of the most surprising results from Swift has been the rapid decay observed in many bursts starting, typically, within a few minutes of the trigger. The steep decay rates, with , are significantly larger than those routinely observed in the optical or X-ray for GRBs discovered pre-Swift, although it must be remembered that those observations were usually at half a day or more post-trigger.
The early rapidly fading X-ray emission could have a variety of possible explanations [35], including high-latitude emission from the fading burst [44], the interaction of the jet with the surroundings — the classical afterglow emission produced by an external shock [45], or thermal emission from a photosphere around the outflow [46] or from a hot cocoon associated with the jet [47].
For almost all of the GRBs observed by Swift the X-ray light curve derived from the BAT data joins smoothly to that from the XRT. If the BAT and the XRT are initially detecting the prompt emission from the jet, when this emission stops (for example the end of internal shocks) we would continue to observe photons coming from regions of the jet which are off the line of sight — the “curvature effect” or “high-latitude emission” [44, 48, 34, 35, 49, 30]. For such a model emission at angles from the line of sight which are in excess of will start to dominate the observed emission. If the jet has uniform surface brightness, the observed X-ray flux will fall as where the spectrum is . Thus this model predicts a relation such that for the early, rapidly declining part of the temporal decay. It is possible to get a shallower decay if viewing a structured-jet off-axis [50] although the general trend is similar to the standard high-latitude model. When considering high latitude emission, the zero-time used to calculate the decay index need not correspond to the trigger time if the light curve is dominated by a later event, such as a large flare.
The possible contribution of standard afterglow emission as the jet interacts with its surroundings complicates the comparison between models and observations. Indeed as afterglow emission can begin within minutes of the burst we are likely to be observing a mixture of emission components, each contributing to the observed temporal and spectral indices. To disentangle the relative contribution of emission from the central engine and that due to the afterglow, O’Brien et al. [30] systematically analysed the temporal and spectral properties of a large GRB sample combining data from the BAT and XRT. The sample comprised 40 GRBs detected by Swift prior to 2005 October 1 for which Swift slewed to point its narrow-field instruments within 10 minutes of the burst trigger time. Of the 40 GRBs, 38 are long bursts.
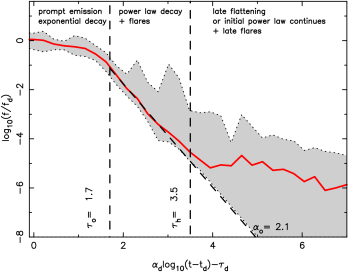
In order to compare light curves for GRBs with different power law decay indices, O’Brien et al. [30] developed a procedure to fit light curves assuming there is a common intrinsic form to the early X-ray light curve. An average X-ray decay curve expressed by log(time) as a function of log(flux), , and log(flux) as a function of log(time), , was derived by taking the sum of scaled versions of each of the individual light curves, , where is approximately the time since the largest/latest peak in the BAT light curve. The data points were transformed to normalised log(flux), , and log(time) delay values, . Four decay parameters (suffix d) specify the transformation for each GRB: , the mean prompt flux; , the start of the decay; , a time scaling; and , a stretching or compression of time. The best fit , , and for each GRB were found using a least squares iteration procedure, excluding bright flares. The resultant composite light curve for the entire sample is shown in Fig. 6.

Under the transformation all the light curves conform to an approximately universal behaviour with an initial exponential decline followed by a power law decay . The transition between the two decay phases occurs when the exponential and power law functions and their first derivatives are equal, and is given for the average decay curve by (). Adopting this transition, for each GRB we define the division between the prompt and power law decay phases to be , corresponding to a prompt time T seconds. This prompt time definition provides us with an alternative estimate of the duration of the prompt phase for each burst which depends on the physical shape of the BAT+XRT light curve rather than the sensitivity of the BAT. As shown in Fig. 7, Tp is comparable to T90 for many bursts, but it can be considerably shorter or longer.
The average decay curve relaxes into a power law with a decay index , found by linear regression on the average decay curve for . This power law fit is shown as a dashed line in Fig. 6. The fitting procedure results in those GRBs which follow a fairly continuous decay lying close to the power law. At the average decay curve starts to rise above the power law decay in the majority of bursts. This is the start of the late emission hump, which we define to start at .
The initial temporal decay index for individual GRBs can be calculated by multiplying by the best fit . GRBs with have decays steeper than average and those with shallower. The resultant are based on all the available data from both the BAT and XRT and are expected to be a more robust estimate of the initial power law decay rate than fitting a power law to a short section of light curve.
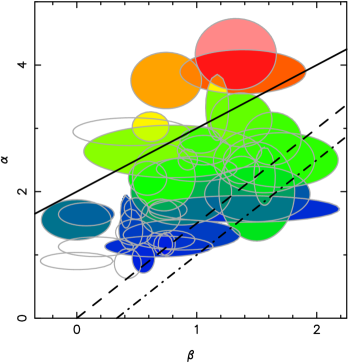
The values of and can be used to test the high latitude and afterglow models, where is taken as the average of the BAT and XRT spectral indices. The correlation between these quantities is shown in Fig. 8. In principle, the relationship between the temporal decay index and spectral index has two components such that . The coefficient arises from the redshift of the peak of the spectral distribution of the synchrotron emission as a function of time and arises from the temporal decay in the peak flux value of the same spectral distribution. The solid line in Fig. 8 shows the expected relationship for the high latitude model with and . The dashed line shows the relationship expected for an afterglow model of a jet expanding into a constant density medium observed at a frequency below the cooling break () and before a jet break, with and [51]. If then is unchanged and . This is plotted as a dot-dashed line on Fig. 8. All of the GRBs lie on or above these afterglow lines. Very similar conclusions are reached if a wind afterglow model is adopted.
It is clear from Fig. 8 that the decay and spectral indices correlate well with the strength of the late emission hump. The bursts with the most significant humps do not have large X-ray flares but they do have steep decays and straddle the high latitude line [30]. The bursts with weaker humps lie below the high latitude line reaching down to the afterglow lines. The majority of GRBs lie below the high latitude prediction. For these it is likely that we are seeing a combination of high latitude prompt emission and conventional, pre-jet-break afterglow.
We note that those GRBs which decay more gradually are more likely to have an early optical detection. Using the initial Swift UVOT V-band exposure to quantify the early optical brightness, for the GRBs in our sample with UVOT observations in the first 10 minutes, those with are four times more likely to have been optically detected.
3.3 The late emission hump
Both the rapid-decay and classical afterglow models have difficulties explaining the late emission hump. Using the light-curve fitting procedure described above, for , the maximum fluence of the late emission hump is commensurate with the prompt fluence [30], suggestive of some kind of equipartition in energy between the emission phases. A number of models have been proposed to explain the late emission hump. It may be due to forward shock emission, which is refreshed with energy either due to continued emission from the central engine or because the ejecta has a range in initial Lorentz factor [52, 53, 54, 34, 35, 55]. As the injection process adds energy the decay does not simply resume the previous decay curve following the shallow phase but rather shows a step (Figs 1 and 2).
We can use the spectral characteristics to test possible relationships between emission phases. Spectral index distributions for those GRBs with a steep decay phase taken from [30], plus a few others, are shown in Fig. 9. The prompt (BAT) spectra have a mean spectral index of and standard deviation . The steep decay phase has a steeper mean spectral index of and , while during the late emission hump the mean spectral index is , and . Interestingly, the late emission hump exhibits a far narrower range in spectral shape than the earlier phases. The narrowness of the spectral index distribution during this phase argues in favour of a universal energy generation mechanism for this segment of the light-curve.

The late emission hump spectra are, on average, harder than the steep-decline spectra, supporting the concept of late-time shock refreshing. These two spectral indices are uncorrelated (, ). There is a much stronger correlation between the difference in the spectral indices (steep-late hump) and the steep-decline spectral index (, ). There is no correlation between the late emission hump spectral index and the prompt spectral index (, ).
3.4 Late evolution and jet breaks
It has been previously shown that GRBs can show a wavelength-independent late break in their optical and infrared light curves [56, 57]. If this break is associated with the jet slowing down, such that becomes larger than (the jet also starts to expand laterally), it can be used to estimate the jet opening angle and hence the actual emitted energy. The derived imply a tightly clustered intrinsic, beaming-corrected, luminosity of erg, which, if confirmed over a wider redshift range, could allow the use of GRBs as standard candles [58].
A significant number of the GRBs found by Swift are at high redshift. The mean redshift of the Swift sample is , more than twice the mean redshift pre-Swift. This allows for a test of the idea of GRBs as standard candles, but also poses a challenge for Swift. The late temporal breaks previously observed in the optical and infrared occur at a few days, and will appear later, on average, for Swift due to the increased time dilation. By this time the X-ray count rates can be down by around five orders of magnitude, or more, from peak. In the spectroscopy sample discussed above, only 9 GRBs have sufficient counts to derive a spectral index after the end of the late emission hump. Of these, 3 show spectral steeping, 5 shown no evidence for spectral variation, and the remaining GRB is inconclusive.
The late temporal decay slope and the usual absence of clear spectral variability suggests that this segment is associated with the normal afterglow phase seen in pre-Swift bursts at those epochs. Currently it is unclear if any jet breaks have been detected in long bursts using data from Swift (although see [59]). The discovery of the late emission hump further complicates detection, as the end of that phase could be mistaken for a jet break. Sato et al. [60] analysed Swift data for three GRBs with extended light curves and known redshifts. They show that the bursts do not show an achromatic break at the times expected, derived from an empirical relationship between the peak in the energy spectrum of the prompt emission and the isotropic luminosity [61]. If confirmed for a larger sample, this would indicate that the jet opening angle has a wider dispersion than previously thought and hence GRBs have a wider range in intrinsic luminosity.
3.5 X-ray flares
The standard model for GRB afterglows, a spherical blastwave expanding into a uniform density ambient medium, predicts smooth afterglow light-curves. At least half of the GRBs observed by Swift show X-ray flares [30]. Suggested models for the origin of flares include density fluctuations in the surrounding medium into which the blastwave expands, structured jets, reverse shocks, refreshed shocks and late-time central engine activity. These models predict relative fluctuation amplitudes and timescales which can be used to rule out some scenarios for the origin of the flares.
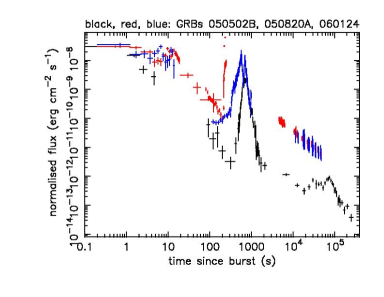
Three of the strongest X-ray flares, observed in GRB050502B, GRB050820A and GRB060124, are shown in Fig. 10 [36, 37, 38]). These flares are quite late, and beyond the burst duration measured by T90. It can be argued that the initial flux is a “pre-cursor”, in which case the “flare” is actually the burst. This is a distinct possibility, although we note that without a flare all three light curves would still have been classified as that of a GRB. This illustrates the uncertain definition of pre-cursors, bursts and flares.
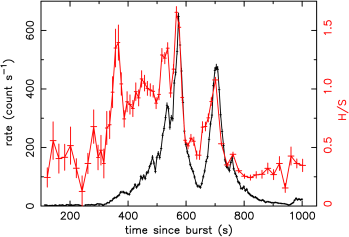
The X-ray flares can show considerable sub-structure. Fig. 11 shows a close-up view of the large flare event in GRB060124. This large flare shows several episodes of flux increase during which the spectrum rapidly hardens, followed by a more gradual softening as the flux declines. The simplest explanation for the observed spectral behaviour is the movement of the break energy to higher energies at the onset of the flare, which then falls to lower energies as the intensity decreases. This behaviour is consistent with that seen in gamma-ray flares observed during the prompt phase [62, 63].
The rapid rise and fall in flux during these early X-ray flares is inconsistent with an explanation involving interaction of the external jet shock with the surrounding medium. In addition, where large energy output is seen it is likely due to the central engine being fed matter as late times due to fragmentation of the progenitor [64] and/or a clumpy accretion flow [65, 66]. The timescale over which large X-ray flares occur is mostly confined to the first hour after the trigger, consistent with the previously known range in burst duration.
4 Short bursts
The discussion above is based mainly on the observed properties of long GRBs (i.e. Ts). Pre-Swift no accurate localizations had been obtained for short bursts, but now both Swift and HETE-2 have provided data which has allowed for the accurate localization of several short bursts. From the first two which were localized, GRB050509B [27] and GRB050709 [67], it was apparent that short bursts are associated with host galaxies that have less active star formation than long bursts and that they are in lower density local environments [27, 68, 40]. Follow-up observations have provided redshifts for most of the localized short bursts and show they have systematically lower redshifts than the long bursts. The lower redshifts and lower fluences imply lower luminosities, although as for long bursts determining the jet opening angle is problematic [40, 69]. The long-burst progenitor is thought to be a collapsar (section 1) whereas the properties of the short-bursts are consistent with a neutron star–neutron star or neutron star – black hole binary progenitor. Short-lifetime massive stars (collapsars) are very unlikely progenitors for the observed short bursts because of both the lack of recent star formation in the host galaxies and the absence of a supernova which should be detectable at low redshifts [68, 70].
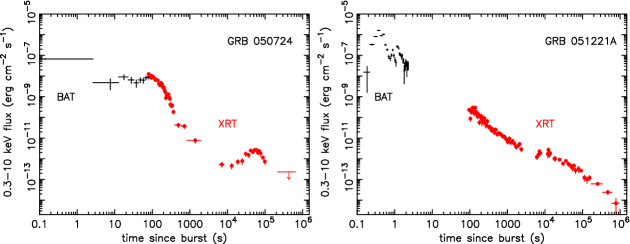
Despite the environmental and likely progenitor differences, the X-ray light curves of short bursts are very similar to those of long bursts. In Fig. 12 the BAT+XRT light curves of two well studied short bursts display the full range of X-ray phenomena: steep decay and flares (GRB050724); and gradual decay and late emission hump (GRB051221A). To Swift GRB050724 is technically a long burst, but it would have appeared as a short burst to the BATSE instrument [39]. The long duration of X-ray emission for the short bursts suggests that their central engines can also be fuelled for many hours, possibly due to the same processes discussed above to explain X-ray flares.
5 Conclusions
The Swift era has truly energized the study of Gamma-ray Bursts. In its first year of operation Swift has provided the first accurate X-ray localization for a short burst, found the highest redshift and highest X-ray luminosity source, GRB050904, observed large X-ray flares which can occur up to an hour or more after the burst and observed a wide variety of temporal and spectral shapes for GRBs. The early high-energy emission from most GRBs appears to be dominated by central engine activity, which may continue low energy output for up to a day after the burst. This phase, plus X-ray flares, are seen in both long and short bursts. In a significant minority of GRBs, the early X-ray emission is consistent with a classical afterglow, where we see early interaction of the jet with the circum-burst environment. The wealth of observational phenomena challenge practically all of the theories as to how GRBs are powered, the nature of the relativistic jet and the interaction between a GRB and its environment.
References
References
- [1] B. Paczyński, 1998, ApJ, 494, L45
- [2] A.L. MacFadyen and S.E. Woosley, 1999, ApJ, 524, 262
- [3] P. Mészáros, 2002, An.Rev.Astron.Astrophys., 40, 137
- [4] B. Zhang and P. Mészáros, 2004, Internat.J.Mod.Phys. A, 19, 2385
- [5] N. Gehrels et al., 2004, ApJ, 611, 1005
- [6] S.D. Barthelmy et al., 2005a, Sp.Sc.Rev., 120, 143
- [7] P.W.A. Roming et al., 2005, Sp.Sc.Rev., 120, 95
- [8] D.N. Burrows et al., 2005, Sp.Sc.Rev., 120, 165
- [9] R.W. Klebesadel, I.B. Strong and R.A. Olson, 1973, ApJ, 182, L85
- [10] G.J. Fishman and C.A. Meegan, 1995, An.Rev.Astron.Astrophys., 33, 415
- [11] C. Kouveliotou et al., 1993, ApJ, 413, L101
- [12] D. Band et al., 1993, ApJ, 413, 281
- [13] R.D. Preece, M.S. Briggs, R.S. Mallozzi, G.N. Pendleton, W.S. Paciesas, D.L. Band, 2000, ApJS, 126, 19
- [14] M.M. Gonzalez, B.L. Dingus, Y. Kaneko, R.D. Preece, C.D., Dermer, M.S. Briggs, 2003, Nature, 424, 751
- [15] C. Winkler et al., 1992, A&A, 255, L9
- [16] L.O. Hanlon et al., 1994, A&A, 285, 161
- [17] E. Costa et al., 1997, Nature, 387, 783
- [18] M.R. Metzger et al., 1997, Nature, 387, 878
- [19] M.G. Baring, 1993, ApJ, 418, 391
- [20] E.E. Fenimore, R.I. Epstein, C. Ho, 1993, A&A Suppl., 97, 59
- [21] T.J. Galama et al., 1998 Nature, 395, 670
- [22] S.R. Kulkarni et al., 1998 Nature, 395, 663
- [23] K.Z. Stanek et al., 2003, ApJ, 591, L17
- [24] J. Hjorth et al., 2003, Nature, 423, 847
- [25] J.S. Bloom, D.A. Frail and S.R. Kulkarni, 2003 ApJ, 594, 674
- [26] D. Watson et al., 2006, ApJ, 637, 69
- [27] N. Gehrels et al., 2005, Nature, 437, 851
- [28] H. Krimm, A. Parsons, C. Markwardt, 2004, “BAT Ground Analysis Software Manual” (http://heasarc.gsfc.nasa.gov/docs/swift/analysis)
- [29] S. Campana et al., 2006, A&A, 449, 61
- [30] P.T. O’Brien et al., 2006, ApJ, in press (astro-ph/0601125)
- [31] G. Tagliaferri et al., 2005, Nature, 436, 985
- [32] S. Vaughan et al., 2006, ApJ, 638, 920
- [33] S. Campana et al., 2005, ApJ, 625, L23
- [34] J.A. Nousek et al. 2006, ApJ, in press (astro-ph/0508332)
- [35] B. Zhang et al., 2006, ApJ, in press
- [36] D.N. Burrows et al., 2005b, Science, 309, 1833
- [37] J. Osborne et al., 2006, in preparation
- [38] P. Ramano et al., 2006, A&A, submitted
- [39] S.D. Barthelmy et al., 2005b, Nature, 438, 994
- [40] A.M. Soderberg et al., 2006, ApJ, submitted (astro-ph/0601455)
- [41] http://swift.gsfc.nasa.gov/docs/swift/swiftsc.html
- [42] W.S. Paciesas et al., 1999, ApJS, 122, 465
- [43] D. Band, ApJ, submitted (astro-ph/0602267)
- [44] P. Kumar and A. Panaitescu, 2000, ApJ, 541, L51
- [45] P. Mészáros and M.J. Rees, 1997, ApJ, 476, 232
- [46] P. Mészáros and M.J. Rees, 2000, ApJ, 530, 292
- [47] P. Mészáros and M.J. Rees, 2001, ApJ, 556, L37
- [48] G. Tagliaferri et al., 2005, Nature, 436, 985
- [49] A. Panaitescu, P. Mészáros, N. Gehrels, D. Burrows and J. Nousek, 2006, MNRAS, 366, 1357
- [50] J. Dyks, B. Zhang and Y.Z. Fan, 2006, ApJ, in press (astro-ph/0511699)
- [51] R. Sari, T. Piran and R. Narayan, 1998, ApJ, 497, L17
- [52] M.J. Rees and P. Mészáros, 1998, ApJ, 496, L1
- [53] R. Sari and P. Mészáros, 2000, ApJ, 535, L33
- [54] B. Zhang and P. Mészáros, 2001, ApJ, 566, 712
- [55] J. Granot and P. Kumar, 2006, MNRAS, 366, 13
- [56] J.E. Rhoads, 1997, ApJ, 487, l1
- [57] R. Sari, T. Piran and J.P. Halpern, 1999, ApJ, 519, L17
- [58] D.A. Frail et al. 2001, ApJ, 562, L55
- [59] A. Blustin et al., 2005, ApJ, 637, 901
- [60] G. Sato et al., 2006, ApJ, submitted
- [61] G. Ghirlanda, G. Ghisellini and D. Lazzati, 2004, ApJ, 616, 331
- [62] L.A. Ford et al., 1995, ApJ, 439, 307
- [63] E.E. Fenimore, 1999, ApJ, 518, 375
- [64] A. King, P.T. O’Brien, M.R. Goad, J. Osborne, E. Olsson and K. Page, 2005, ApJ, 630, L113
- [65] R. Perna, P. Armitage and B. Zhang, 2006, ApJ, 636, 29
- [66] D. Proga and B. Zhang, 2006, ApJ, in press (astro-ph/0601272)
- [67] D. Fox et al., 2005, Nature, 437, 845
- [68] J. Hjorth et al., 2005, Nature, 437, 859
- [69] D.N. Burrows et al., 2006, ApJ, submitted (astro-ph/0604320)
- [70] J.S. Bloom et al., 2006, ApJ, 638, 354