COMMISSIONS 27 AND 42 OF THE IAU
INFORMATION BULLETIN ON VARIABLE STARS
Number
Konkoly Observatory Budapest HU ISSN 0374 – 0676
VARIABILITY OF V838 Mon BEFORE ITS OUTBURST
KIMESWENGER, S.1; EYRES, S.P.S.2
1Institut für Astro- und Teilchenphysik,
Universität Innsbruck,
Technikerstraße 25, A-6020 Innsbruck,
Austria
2Dept. of Physics, Astronomy & Mathematics, University
of Central Lancashire, Preston PR1 2HE, UK
V838 Mon had an unusual ”nova-like” outburst in 2002 (Munari et al. 2002, Kimeswenger et al 2002). Several attempts at photometry of the progenitor on archival plates led to different results (Munari et al. 2002 Kimeswenger et al. 2002, Goranskij et al. 2004). While the first two used scans based on the SERC J plate from 1983 and the UKST ER plate from 1989, Goranskij et al. (2004) added the UKST I plate from 1982 and the POSS-I plates from 1952. Munari et al. (2005) used the USNO-B1 catalogue and a revised calibration based on their CCD sequence. The USNO-B1 is based on scans with an 8 bit linear greyscale only. Thus the stellar images are without grey wings and no de-blending can be done. There are also two bright objects (USNO-B1.0 0861-0120005 and USNO-B1.0 0861-0120000) at/near the target position. It is also not clear to the reader how Munari et al. (2005) averaged the different bands used in USNO-B1 (POSS-I O and SERC-J). The investigation of the ”older twin” of this unusual object - V4332 Sgr (Nova Sgr 1994) - shows the progenitor might be variable during the last years before outburst (Kimeswenger, 2006). This is essential for the investigation of the spectral energy distribution (SED).
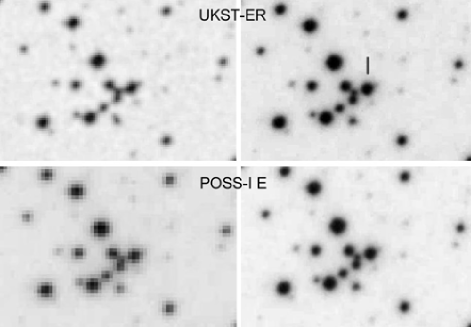
Here we used not DSS scans, but the SuperCOSMOS scans (except POSS-I O) of the same plates used by Munari et al. (2002) and Goranskij et al. (2004). These scans have a much higher spatial resolution. Bacher et al. (2005) have shown, that this does not normally improve the photometry of unblended stars. But as already mentioned there, blended objects have often been rejected in their work. V838 Mon is within a small group of stars. Small apertures and high resolution are thus essential here (for a calibration of the ”best aperture” see Bacher et al. 2005). Figure 1 shows the increase of quality and better de-blending capabilities using the SuperCOSMOS scans. In addition to the surveys used up to now, the SuperCOSMOS server also provides us with the scans of the new UKST-SR survey. This plate was taken in parallel to the UKST H survey for off-band continuum subtraction. It was obtained less than four years before the outburst of V838 Mon and was overlooked up to now. It gives us valuable additional information. All photographic plates were calibrated using the CCD sequence of Munari et al. (2005) and the nonlinear tuning for digitized sky surveys by Bacher et al. (2005). The latter change of the method is the main difference to the calibration used by Kimeswenger et al. (2002). They only used a linear approximation to a few stars having the same magnitude.

The blue bands of the POSS-I and of the SERC-J survey strongly differ in their bandpass. Thus the conversion to standard B magnitudes was used for the comparison. While the BJ conversion is well studied (Bacher et al. 2005) there exist no such extensive studies for the POSS-I O. Dorschner et al. (1966) assume there is no color correction required. We found with the field stars . This correction was applied to derive magnitudes of the stars of the CCD sequence for calibration purposes. As most of the field stars are foreground stars with typically 04 (B-V) 08, this effect is small. This led Goranskij et al. (2004) to the conclusion, that color corrections need not be applied at all. They used a comparison with stars in that color range only. While these field stars do have spectral types of A-F with a strong Balmer jump, the progenitor of V838 Mon is a heavily reddened blue object without any Balmer jump. Thus the effective wavelength differs even when they have about the same (B-V) color. This is certainly true for the BB conversion. However it is weak at the wavelengths of the SERC-J survey, so it may not affect the work of Goranskij et al. (2004) significantly. It is more significant for the B calculation (with the filter just on the Balmer continuum absorption).
The last data before the outburst was taken by the DENIS and the 2MASS surveys. The 2MASS survey visited the target twice due to an overlap of neighboring tiles. While the 02/11/1998 data is in the point source data base, another plate was taken just 37 days after that. We have loaded both images from the data base, to redo the photometry on both of them. This gives a good error estimate by using the stars in the overlap of the two observations. Finally we have access to the non–public DENIS images. The DENIS survey is known to sometimes have systematic zero point shifts. The standard survey operations calibration is insufficient here. Also the Ks band was at its limits for this source. Thus the question arises, whether the difference to 2MASS is therefore high in this band. Using the 2MASS data of the field stars around the target and the improvement of the calibration for DENIS data by Kimeswenger et al. (2004) We obtained a more accurate photometric calibration in J and Ks. The corrected values are given in the table below.

The target seems to be stable before 1990. This corresponds to the finding of Goranskij et al (2004) who had their last Sonneberg plate 13/03/1991. After this a fading clearly started. The 2MASS data gives a weak indication in all three bands, that this fading continued in late 1998. At the end of 1999 the DENIS J and Ks data show a small re-brightening by about 10%. This is also consistent with the fact that II1982 = 0363 is different from RR1989 = 0461 by about KK1998 JJ1998 -01 .
| date | JD - | material | band name | mag | err | |
| 2400000.0 | [m] | |||||
| 16/01/1953 | 34393.32 | POSS-I | E | 0.650 | 1458 | 013 |
| 16/01/1953 | 34393.41 | POSS-I | O | 0.405 | 1568 | 015 |
| 22/01/1982 | 44990.57 | SERC-I | Ip | 0.840 | 1415 | 008 |
| 17/01/1983 | 45350.52 | SERC-J | BJ | 0.475 | 1549 | 009 |
| 05/03/1989 | 47589.47 | UKST-ER | r | 0.650 | 1445 | 009 |
| 01/02/1998 | 50844.45 | UKST-SR | r | 0.650 | 1491 | 010 |
| 02/11/1998 | 51119.86 | 2MASS | J | 1.150 | 1386 | 003 |
| H | 1.650 | 1350 | 004 | |||
| Ks | 2.150 | 1331 | 004 | |||
| 09/12/1998 | 51156.83 | 2MASS | J | 1.150 | 1396 | 004 |
| H | 1.650 | 1355 | 003 | |||
| Ks | 2.150 | 1343 | 005 | |||
| 12/12/1999 | 51524.76 | DENIS | Ic | 0.790 | 1452 | 0032) |
| J | 1.150 | 1382 | 006 | |||
| Ks | 2.150 | 1312 | 007 |
1) based the the SED with TK
and E(B-V) 07
2) single band - thus error estimate taken from survey point source catalogue
In our opinion the discrepancies of the photometry mentioned in the introduction originate in the blend with neighboring objects and the different handling of color equations. The new photometry provided here now gives more accurate values for SED fitting. The fading found here might be important for interpreting the nature of this unique object. But even more important is the fact that the photographic data before 1990 should not be used together with the 1998/1999 NIR survey data when fitting the SED or when deriving the foreground extinction. The fading lowered the NIR data and thus leads to an overestimate of the interstellar extinction and/or an overestimate of the progenitors effective temperature. As we do not have blue data during the late nineties, we do not have any idea about a possible color change. Thus we cannot decide, if the fading is caused by a change of the temperature, a contraction of the photosphere, or any other kind of geometric effects.
Reference:
Bacher A., Kimeswenger S., Teutsch P., 2005, MNRAS, 362, 542
Dorschner J., Gürtler J., Schielicke R., Schmidt K.-H., 1966, AN, 289, 51
Goranskij V.P., Shugarov S.Yu., Barsukova E.A., Kroll P., 2004, IBVS, 5511
Kimeswenger S., 2006, AN, 327, 44
Kimeswenger S., Lederle C., Richich A., et al., 2004, A&A, 413, 1037
Kimeswenger S., Lederle C., Schmeja S., Armsdorfer B., 2002, MNRAS, 336, L43
Monet D.G., Levine S.E., Canzian B., et al., 2003, AJ, 125, 984
Munari U., Henden A., Kiyota S., et al., 2002, A&A, 389, L51
Munari U., Henden A., Vallenari A, et al., 2005, A&A, 434, 1107