Spitzer Observations of V838 Monocerotis: Detection of a Rare Infrared Light Echo
Abstract
We present Spitzer observations of the unusual variable V838 Monocerotis. Extended emission is detected around the object at 24, 70 and 160 m. The extended infrared emission is strongly correlated spatially with the HST optical light echo images taken at a similar epoch. We attribute this diffuse nebulosity to be from an infrared light echo caused by reprocessed thermal emission from dust heated by the outward-propagating radiation from the 2002 eruption. The detection of an IR light echo provides an opportunity to estimate the mass in dust of the echo material and hence constrain its origin. We estimate the dust mass of the light echo to be on the order of a solar mass - thereby implying the total gas plus dust mass to be considerably more - too massive for the echo material to be the ejecta from previous outburst/mass-losing events. This is therefore suggestive that a significant fraction of the matter seen through the light echo is interstellar in origin. Unresolved emission at 24 and 70 m is also seen at the position of the central star possibly indicating the presence of hot dust freshly condensed in the outburst ejecta.
Subject headings:
infrared: stars-novae, cataclysmic variables - stars: individual (V838 Monocerotis)1. Introduction
The eruption of V838 Monocerotis (V838 Mon) in January 6, 2002 has introduced a seemingly new kind of object in the realm of cataclysmic variables. It was detected in eruption by Brown (2002) with a peak outburst amplitude of = 10 which was followed by two more outbursts – within the next two months – reaching 6.7 and 7 magnitudes respectively. V838 Mon also showed fast cooling, on a timescale of a few months, to a cool, late M spectral type or beyond (Evans et al., 2003). The multi-peaked outbursts in the object and the decrease of its effective temperature with time suggested that the object was different from a classical nova or other known classes of eruptive variables (Munari et al. 2002; Kimeswenger et al. 2002). An expanding light-echo was also seen around the star (Henden et al., 2002) whose expansion and accompanying morphological changes are strikingly illustrated by HST (Bond et al., 2003) and other images (Crause et al., 2005). Distance estimates to the object, converging to a large value in the range of 7-10 kpc, have been made based on varied approaches such as the rate of the expanding light echo (e.g., Tylenda 2004; Crause et al. 2005), and the detection of SiO maser emission from the source (Deguchi et al., 2005). Considerable near-infrared studies of the source have been done yielding spectra showing an oxygen rich atmosphere with prominent molecular features of CO, AlO, SiO, TiO and water (Lynch et al., 2004; Evans et al., 2003; Banerjee & Ashok, 2002; Rushton et al., 2005). Though not firmly established, similarities in outburst properties between V838 Mon and two other potential analogs viz. V4332 Sgr and M31-RV, suggest that they could be unified into a new class of eruptive variables. While the cause for the intriguing outbursts in such objects is yet to be securely established, various mechanisms have been proposed viz. the merger between main sequence stars (Soker & Tylenda, 2003); the capture of multiple planetary companions (Retter & Marom, 2003) or a late flash in a born-again AGB star (Lawlor, 2005). Aspects relating to the spectral type of the progenitor and whether it is a single or binary star have also been the subject of investigations (Munari et al., 2005; Tylenda et al., 2005).
Here, we present our results on V838 Mon from GO Cycle 1 observations of the Spitzer Space Telescope (Spitzer). The highlight of the Spitzer observations is the striking infrared echo seen around V838 Mon in the mid- and far-IR images. While optical light echoes around novae or supernovae are rare but not unknown, an infrared “echo” is a rare complementary phenomenon – we are only aware of one other instance of a resolved infrared light echo, Cas A (Krause et al., 2005). When photons from the illuminating source interact with the dust grains of the echo material, they can either be absorbed or scattered according to the albedo of the grain. Photons scattered into the line of sight result in an optical light echo, a direct “image” of the impinging radiation. On the other hand, IR “echoes” result from the absorption of the impinging radiation; the thermalized energy of the absorbed photons is re-emitted in the IR. Our observations are presented in §2. Details of the nature of the IR emission are discussed in §3. In §4, the important question regarding the origin of the light echo material around V838 Mon is discussed.
2. Observations and Data reduction
V838 Mon was imaged with the Multiband Imaging Photometer for Spitzer (MIPS; Rieke et al. 2004) at 24, 70 and 160 m in 2004 and 2005. The log of the observations is given in Table 1.
| Instrument | Exp. per frame | Integration | AOR | |||||
|---|---|---|---|---|---|---|---|---|
| Date | Array | m | m | Mode | (sec) | Cycles | on-source (sec) | Key |
| 2004 Oct 14 | MIPS/24 | 23.7 | 4.7 | Fixed Photometry | 3 | 2 | 92.3 | 10522624 |
| 2005 Apr 01 | MIPS/70F | 71 | 19 | Phot. w/ 8 clus. pointings | 10 | 2 | 615.3 | 10523648 |
| 2004 Oct 15 | MIPS/160 | 156 | 35 | Phot. w/ 4 clus. pointings | 3 | 2 | 50.2 | 10523904 |
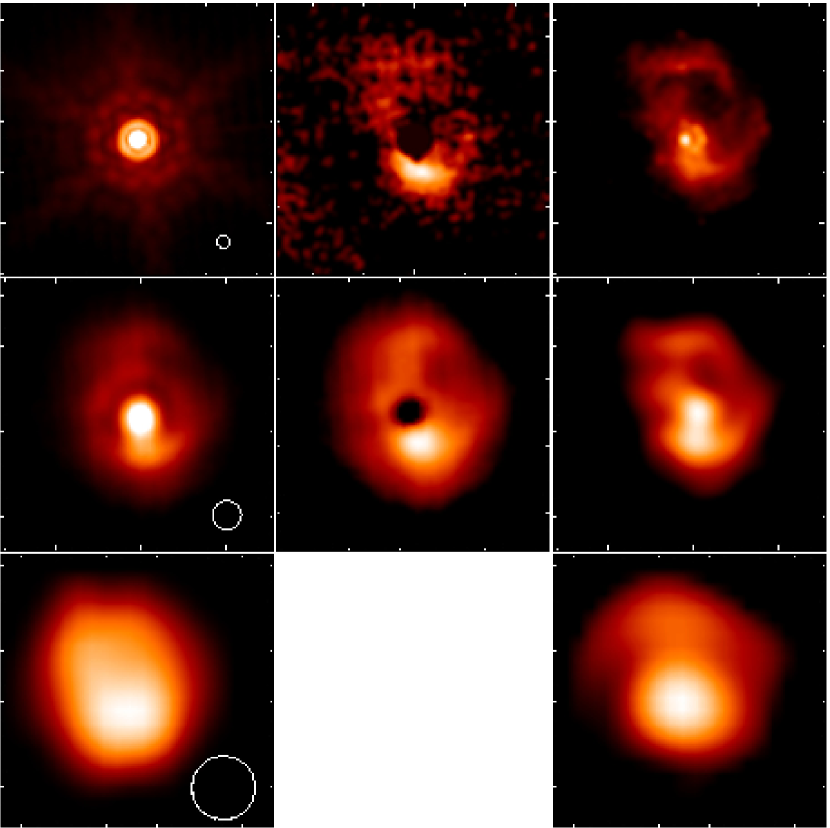
The MIPS data were reduced using the Data Analysis Tool (DAT; Gordon et al. 2005). Images at 24, 70, and 160 m are shown in the first column of Figure 1. While at 24 m, V838 Mon appears as a bright point source (hard saturation in the core), extended nebulosity offset from the central star is readily apparent at 70 and 160 m. Detailed comparison of the 24 m radial profiles between the target and an observed standard star indicates that the profiles matched very well between the first bright and dark Airy rings, suggesting most of the flux at the central region is from an unresolved source, and the extended nebulosity contributes very little flux at the core. To correct the saturation in the 24 m image, an observed point spread function (PSF) was scaled to match the brightness of the first bright Airy ring. The saturated core of V838 Mon was then replaced with the scaled PSF. Total fluxes observed through 80″ apertures are reported in column 2 of Table 2. To separate the extended emission from the unresolved point source, PSF subtraction was performed on the 24 and 70 m images (at 160 m, there is no discernible unresolved central source). The flux density of the central source estimated from the subtracted PSF is reported in column 3 of Table 2. The PSF subtracted images are presented in column 2 of Figure 1. Extended emission is clearly evident at 24 m in the PSF subtracted images, especially a bright extension to the south of V838 Mon. The total diffuse flux observed toward V838 Mon, obtained by subtracting the unresolved point source flux from that measured in the 80″ aperture, is given in column 4 of Table 2.
| Flux Density (Jy)11Absolute calibration errors are 5, 10, and 10%, respectively. | |||
|---|---|---|---|
| m | TotalaaTotal flux density, 80″ aperture. | CorebbUnresolved point source from PSF fitting. | ExtendedccResidual emission (TotalPSF). |
| 23.68 | 15.97 | 15.06 | 0.91 |
| 71.42 | 14.72 | 3.82 | 10.9 |
| 155.89 | 17.53 | 17.53 | |
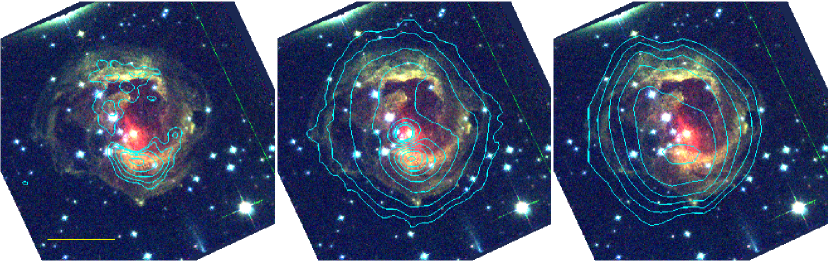
In order to compare our infrared images with the optical light echo, we have also obtained archival HST ACS images of V838 Mon (Hubble Heritage, GO/DD 10392). The data were obtained with the ACS/WFC using the F435W, F606W, and F814W filters and were completed on 23 Oct 2004, within days of our 24 and 160 m observations and a few months of our 70 m observations. The F814W image convolved with the MIPS beams is shown in column 3 of Figure 1 for comparison. A three color composite image was constructed using all three HST filters and is presented in Figure 2 with our 24, 70, and 160 m contours superposed. The 24160 m spectral energy distribution (SED) of the extended nebulosity around V838 Mon is shown in Figure 3.
3. Source of the IR Emission
The infrared emission associated with V838 Mon consists of an extended component associated with the light echo and a compact, unresolved component spatially coincident with the central star. The unresolved component evident at 24 and 70 m possibly indicates the condensation of newly formed dust around the central star of V838 Mon. Evidence that such a dust shell had formed after the outburst has already been seen from the mid-IR data of Lynch et al. (2004) in early 2003. These authors show the prominent presence of a 650K component in their SED in the 8-13 m region. The detection of water around V838 Mon (Banerjee et al., 2005), from near-IR data in 2002-2003, also supports the existence of a cool envelope at 800K. Our MIPS data for the unresolved component (Table 2, Col. 3) are consistent with a temperature T100 K. However, a more detailed and accurate characterization of the properties of this unresolved component – such as determining its temperature more accurately, estimating the mass of the newly formed dust around the central star to get a better insight on how much mass is lost in V838 Mon-type of outbursts, and also a detailed study of its spectrum in the 5-40 m region – will be undertaken in a separate study involving additional Spitzer data.
The extended component of emission in V838 Mon is strongly indicative of an “infrared light echo”. The strong spatial correlation of the infrared emission with the contemporaneous optical light echo (Oct 2004; see Figs. 1 & 2) indicates that the IR emission is also linked to the radiation from the initial outburst. The detection of light echo emission at wavelengths where the scattering efficiency of typical dust grains is small relative to their absorption efficiency indicates that the IR light echo - unlike the optical light echo - is very unlikely to be due to scattering, but rather thermal emission from grains heated by the outburst pulse.
Simple energy arguments also support a thermal origin for the IR emission. During the first two months of its multi-peaked outburst, when V838 Mon can be thought to have emitted most of its radiation in the form of a prolonged pulse, the star showed an SED well represented by effective temperatures between 5250 to 4250 K (Munari et al., 2002). The magnitudes ranged from 10 to 6 during the outburst, corresponding to an energy flux output in the V band, corrected for reddening using = 0.5, of between 3.910-16 and 1.610-14 W cm-2 m-1. Assuming a black body temperature of 5000 K and extrapolating to 160 m, this results in 10-24 to 10-23 W cm-2 m-1 available from the outburst in the 160 m band. However, our observed flux density at 160 m of 17.53 Jy corresponds to an energy flux of 2.010-19 W cm-2 m-1. Even if we unrealistically assume 100% scattering efficiency, the outburst provides 3 to 5 orders of magnitude too little energy to power the 160 m emission through scattering alone. Thus scattering is ruled out as the source of the infrared light echo. Instead, the heating of dust grains by optical and UV photons from the outburst pulse and the subsequent re-processing of the absorbed energy into the thermal infrared remains the likely source of the infrared light echo in V838 Mon.

4. Origin of the IR echo material: Interstellar or Circumstellar?
The origin of the light echo material has been the source of some debate in the literature. Bond et al. (2003) and van Loon et al. (2004) suggest that the echo material has been produced in previous mass loss episodes while, eg. Tylenda (2004) has argued that the light echo material is interstellar in origin. This is an important aspect to address since it can help establish whether the progenitor has undergone previous outbursts (eg., AGB-like behavior; van Loon et al. (2004)) or steady mass-loss through winds in the past, and therefore give a deeper insight into the nature of the central star. The discovery of an IR light echo provides an opportunity to estimate the mass in dust of the echo material and hence constrain its origin. The flux density measured for the light echo material is given in the fourth column of Table 2.
The infrared flux received from a mass of dust grains can be estimated from
| (1) |
where is the object’s distance, is the wavelength dependent mass absorption coefficient, is the Planck function at dust temperature , and the sum extends over all dust components contributing to the emission at the observed wavelengths. To estimate the mass of the emitting echo material observed by MIPS, we can use Eq. 1 and our measured MIPS flux densities. While the echo likely arises from material with a range of temperatures, a minimum of two components is required to fit the 24-160 m echo emission and we therefore elect to fit the data with this minimum number of components consistent with the data. We use Eq. 1 combined with a Monte Carlo technique to explore the range of temperatures and masses that can fit the data. Allowing a range of size from m and compositions (silicate/amorphous carbon; indices from Laor & Draine (1993) and Zubko et al. (1996), respectively), the derived temperatures and masses for the two components are K and M☉, respectively, assuming a distance of 8 kpc. Estimates of the uncertainty are derived from the distribution. The temperature and mass uncertainty in the warm component is due largely to the lack of constraining short wavelength data. However, it is important to note that the dominant component of the derived mass of the light echo, arises from the cold 25K component which is reasonably well constrained in the fit in Figure 3. Even assuming a lower limit on the distance to V838 Mon of 5 kpc, the mass in the cold component must be M☉. As can be seen in Figure 3, the need for a large mass of colder dust is primarily driven by the 160 m point. The close correspondence of the distribution of emission at 160 m and the optical light echo (see the bottom row of Figure 1 and the last panel of Figure 2) argue that the cold emission is associated with the echo material; indeed, the emission at 160 m rapidly falls off away from the echo location. Thus the mass we are estimating from our IR flux measurements is directly associated with the echo material. With a gas-to-dust ratio of 100, we estimate the total mass of the material in the echo to be on order of a few tens to a few hundred solar masses. At a distance of 8 kpc, the size of the IR echo is 3 pc; a large diffuse interstellar cloud of this size may have a mass of a few tens of M☉ while denser clouds could range up to a few hundred M☉ in mass (Whittet, 2003). Therefore, the observed mass of the echo material is consistent with an origin in interstellar material.
Conversely, it is extremely unlikely that a single previous outburst could have ejected a total mass of the order of 10 M☉ or above. In novae eruptions, typically M☉ matter is ejected; an amount in the range M☉ is suggested from limits/estimates of the ejecta mass in V838 Mon (Banerjee & Ashok, 2002; Rushton et al., 2003). Steady mass loss from the progenitor in the past also does not appear to be favored as the sole contributor to the echo matter. The radius of the emitting zone (), either derived from the light travel distance since the outburst 2.75 years ago or from the angular radius of the echo in December 2004 (70”), is on the order of parsecs. The amount of matter that could have been lost in such a zone of radius R from a star with a wind velocity , ejecting mass at a rate of M☉/year can then be easily computed. Even a massive AGB star with a high mass-loss rate of M☉/year (van Loon et al., 2005) in a slow wind with = 10 km/s can only generate a total echo mass (gas plus dust) of 1 M☉. Even this is just at the margin of the lower limits of our estimate for the echo material mass and we are thus led to believe that a considerable part of the echo material is likely to lie in an intervening dust sheet. This is consistent with some of the models explaining the light echo expansion rate and observed morphological changes in the light echo (Tylenda, 2004). However our calculations do not completely preclude a component of circumstellar origin for the echo material; indeed the presence of an unresolved core of emission at 24 and 70 m argues that some of the material may well be “circumstellar” in origin.
5. Conclusion
We report the detection of a rare infrared “light echo” around the unusual variable V838 Mon. Our Spitzer data reveal both an unresolved hot component and an extended cooler component. The unresolved component is attributed to the formation of dust in the ejecta of the 2002 outburst. The extended component is spatially coincident with the optical light echo and is likely caused by thermal emission from dust heated by the energy of the outburst pulse. The large derived mass of the infrared light echo makes it unlikely that the echo material is the remnant of previous mass loss episodes in V838 Mon, but rather is interstellar material along the line of sight to V838 Mon.
References
- Banerjee & Ashok (2002) Banerjee, D. P. K., & Ashok, N. M. 2002, A&A, 395, 161
- Banerjee et al. (2005) Banerjee, D. P. K., Barber, R. J., Ashok, N. M., & Tennyson, J. 2005, ApJ, 627, L141
- Bond et al. (2003) Bond, H. E., et al. 2003, Nature, 422, 405
- Brown (2002) Brown, N. J. 2002, IAU Circ., 7785, 1
- Crause et al. (2005) Crause, L. A., Lawson, W. A., Menzies, J. W., & Marang, F. 2005, MNRAS, 358, 1352
- Deguchi et al. (2005) Deguchi, S., Matsunaga, N., & Fukushi, H. 2005, PASJ, 57, L25
- Evans et al. (2003) Evans, A., Geballe, T. R., Rushton, M. T., Smalley, B., van Loon, J. T., Eyres, S. P. S., & Tyne, V. H. 2003, MNRAS, 343, 1054
- Gordon et al. (2005) Gordon, K. D., et al. 2005, PASP, 117, 503
- Henden et al. (2002) Henden, A., Munari, U., & Schwartz, M. 2002, IAU Circ., 7859, 1
- Laor & Draine (1993) Laor, A., & Draine, B. T., 1993, ApJ, 402, 441
- Lawlor (2005) Lawlor, T. M. 2005, MNRAS, 361, 695
- Lynch et al. (2004) Lynch, D. K., et al. 2004, ApJ, 607, 460
- Kimeswenger et al. (2002) Kimeswenger, S., Lederle, C., Schmeja, S., & Armsdorfer, B. 2002, MNRAS, 336, L43
- Krause et al. (2005) Krause, O., et al. 2005, Science, 308, 1604
- Munari et al. (2002) Munari, U., et al. 2002, A&A, 389, L51
- Munari et al. (2005) Munari, U., et al. 2005, A&A, 434, 1107
- Retter & Marom (2003) Retter, A., & Marom, A. 2003, MNRAS, 345, L25
- Rieke et al. (2004) Rieke, G. H., et al. 2004, ApJS, 154, 25
- Rushton et al. (2003) Rushton, M. T., et al. 2003, A&A, 412, 767
- Rushton et al. (2005) Rushton, M. T., Geballe, T. R., Evans, A., Smalley, B., van Loon, J. T., & Eyres, S. P. S. 2005, MNRAS, 359, 624
- Soker & Tylenda (2003) Soker, N., & Tylenda, R. 2003, ApJ, 582, L105
- Tylenda (2004) Tylenda, R. 2004, A&A, 414, 223
- Tylenda et al. (2005) Tylenda, R., Soker, N., & Szczerba, R. 2005, A&A, 441, 1099
- van Loon et al. (2004) van Loon, J. T., Evans, A., Rushton, M. T., & Smalley, B. 2004, A&A, 427, 193
- van Loon et al. (2005) van Loon, J. T., Cioni, M.-R. L., Zijlstra, A. A., & Loup, C. 2005, A&A, 438, 273
- Whittet (2003) Whittet, D. C. B. 2003, Dust in the Galactic Environment (Bristol, UK: IoP Publishing)
- Zubko et al. (1996) Zubko, V. G., Mennella, V., Colangeli L., & Bussoletti E. 1996, MNRAS, 282, 1321