Photometric study of selected cataclysmic variables ††thanks: The Appendix is only available in electronic form at http://www.edpsciences.org. Table 1, as well as Table 7 and Fig 11 – Fig 15 of the Appendix, are also available at the CDS via anonymous ftp to cdsarc.u-strasbg.fr (130.79.128.5) or via http://cdsweb.u-strasbg.fr/cgi-bin/qcat?J/A+A/.
Abstract
Aims. We present time-resolved photometry of five relatively poorly-studied cataclysmic variables: V1193 Ori, LQ Peg, LD 317, V795 Her, and MCT 2347-3144.
Methods. The observations were made using four 1m-class telescopes for a total of more than 250 h of observation and almost 16,000 data points. For LQ Peg WHT spectroscopic data have been analysed as well.
Results. The light curves show a wide range of variability on different time scales from minutes to months. We detect for the first time a brightness variation of 0.05 mag in amplitude in V1193 Ori on the same timescale as the orbital period, which we interpret as the result of the irradiation of the secondary. A 20-min quasi-periodic oscillation is also detected. The mean brightness of the system has changed by 0.5 mag on a three-month interval, while the flickering was halved. In LQ Peg a 0.05 mag modulation was revealed with a period of about 3 h. The flickering was much smaller, of the order of 0.025 mag. A possible quasi-periodic oscillation could exist near 30 min. For this object, the WHT spectra are single-peaked and do not show any radial-velocity variations. The data of LD 317 show a decrease in the mean magnitude of the system. No periodic signal was detected but this is certainly attributable to the very large flickering observed: between 0.07 and 0.1 mag. For V795 Her, the 2.8-hour modulation, thought to be a superhump arising from the precession of the disc, is present. We show that this modulation is not stable in terms of periodicity, amplitude, and phase. Finally, for MCT 2347-3144, a clear modulation is seen in a first dataset obtained in October 2002. This modulation is absent in August 2003, when the system was brighter and showed much more flickering.
Key Words.:
accretion, accretion discs – stars: V1193 Ori, LQ Peg, LD 317, V795 Her, MCT 2347-3144 – cataclysmic variables1 Introduction
Cataclysmic variables (CVs) are close binary systems with an orbital period () in the range of a few hours. They consist of a low-mass star, that fills its Roche lobe and transfers mass to its white-dwarf (WD) companion. In non-magnetic systems, an accretion disc (AD) forms around the WD, which can go through different phases of activity. These systems have been classified according to their photometric and spectroscopic properties. In dwarf novae (DN), changes in the state of the AD are responsible for the outbursts that are observed, with most typical ones reaching 2–5 mag. On the other hand, nova-like (NL) CVs exhibit such a high mass-transfer rate that the disc is permanently stuck in outburst. The VY Scl stars are also included in the NL category. They reveal occasional reductions in brightness of the order of a few magnitudes, due to temporary lowering of the mass transfer rate.
CVs play a crucial role in the understanding of several physical phenomena and in particular in the study of the origin of viscosity in ADs, which are ubiquitous in astrophysics. Their short makes them an ideal target for observational studies. CVs present a range of variability from a few seconds to several years and as such are very interesting for photometric campaigns. These variations are indicative of many different physical processes that must be understood. These processes are discovered through a variety of behaviours visible in the light curves, e.g. flickering, quasi-periodic oscillations (QPOs), outbursts, humps, superhumps, eclipses, etc. Thus, when observing a CV, one is almost guaranteed to see the system in a different state than it was before, whose comparison should allow us to comprehend the system better.
However, there are systems which attract more attention than others. Thus, in 1999, a programme that started at the Royal Observatory of Belgium by one of us (HMJB), aimed at photometrically following poorly-known CVs, mostly of the NL type. The programme was based on the use of 1m-class telescopes. In this paper, we present some of the results of this campaign. Data are presented for five stars, V1193 Ori, LQ Peg, LD 317, V795 Her, and MCT 2347-3144 and have been collected over the period 2002-2005 in four observatories.
The paper is organised as follows: in Sect. 2, we present our observations and data reduction methodology. Sect. 3 gives the data collected for each star individually and in Sect. 4, we discuss the results.
2 Observations and data reduction
We performed our photometric observations at four different observatories: at the South African Astronomical Observatory (SAAO), at the Observatorium Hoher List in Germany (OHL), and at two observatories in Greece: Kryoneri (KR) and Skinakas (SK). At the SAAO we used the 1-m telescope equipped with a back-illuminated 1024x1024, 24-micron pixel STE4 CCD camera with a field of view (FOV) of . At the OHL, we used the 1-m Cassegrain-Nasmyth telescope with the 2048x2048, 15-micron pixel HoLiCam CCD camera with a 2-sided read-out. We used the focal reducer and an effective FOV of . As one side occasionally encountered problems during the reading, we moved our targets to the other side, therefore decreasing the FOV to . At KR, the 1.2-m Cassegrain telescope was used with a 512x512, 24-micron pixel CCD camera and a FOV. Finally, we performed observations with the 1.3-m Ritchey-Cretien telescope at SK, giving a FOV of and used the 1024x1024 pixel SITe CCD camera. Most of the runs were unfiltered, unless noted.
The CCD frames were processed for bias removal and flat-field correction. Small sets of biases were taken at regular time intervals during the night and were then combined into one median bias frame, which was then subtracted from all images. In case of non-negligible drops in the CCD temperature, new biases were obtained at that point and neighbouring images were processed with the new combined bias frame. For each night we obtained a median flat frame. In case of bad weather during both evening and morning twilight, the flat frame of the previous or next observing night was used.
Aperture photometry was made using the IRAF package apphot. The circular aperture used for the integration of the flux and the computation of the instrumental magnitudes was equal to . When the nights were photometric and stable, a mean was calculated, resulting in a fixed nightly aperture. In case of unstable sky quality and therefore great changes of the during the night, it was divided into parts and each time interval was treated independently by calculating a different aperture in each case. Differential photometry was then applied to the resulting magnitudes of the CV and the selected comparison stars. The behaviour of the differences of the magnitudes between the comparison stars throughout the campaign was checked. Only those comparisons with stable differences were selected.
The same reduction technique and light curve generation has been applied to all CVs analysed in this paper. Whenever any offset takes place it will be stated in the corresponding section.
3 Selected targets and results
3.1 V1193 Ori
V1193 Ori was accidentally discovered in 1985 as a very blue variable star by M. Hamuy (Hamuy & Maza 1986; Maza et al. 1986). Filippenko & Ebneter (1986) obtained spectra that revealed H and H emission superposed on broad absorption lines. The classification of V1193 Ori as a NL CV of the UX UMa subtype was made by Bond et al. (1987), who conducted photometric and spectroscopic observations. V1193 Ori showed irregular flickering with a peak-to-peak amplitude approaching 0.2 mag, typical of NLs. No QPOs, , or eclipses were found. The only definite spectral feature was a broad and shallow H absorption line with a central emission peak, observed in other NLs. One 3.6 h photometric run was obtained by Warner & Nather (1988). The light curve showed flickering with a total range of 0.25 mag and no coherent modulations or eclipses were detected.
A spectroscopic of 0.165 d () was reported by Ringwald et al. (1994). The average of their spectra in 1989 showed H in emission, while slight absorption wings flanked H and He i (5876 Å), positively contributing to the classification of V1193 Ori as a UX UMa star. Other He i lines were also weakly seen in emission. From H emission line-profile variations in 1988, Ringwald et al. (1994) suggested that this is the result of irradiation of the secondary. The variations in 1989 revealed red wing spikes that occurred twice per orbit at and 0.8.
Recently, Ak et al. (2005) reported three periodicities from their analysis of unfiltered photometric CCD observations during 24 nights between November 2002 and January 2003. Those are 0.1430 d, 0.1362 d, and possibly 2.98 d, and they are interpreted as the , the negative superhump period , and the precession period of the disc , respectively. They believe that the 0.1430 d periodicity, being consistent with the 1d-1 alias of the proposed of 0.165 d (Ringwald et al. 1994; Papadaki et al. 2004) and exceeding its power by a factor of 5, should be considered as a refined value of the .
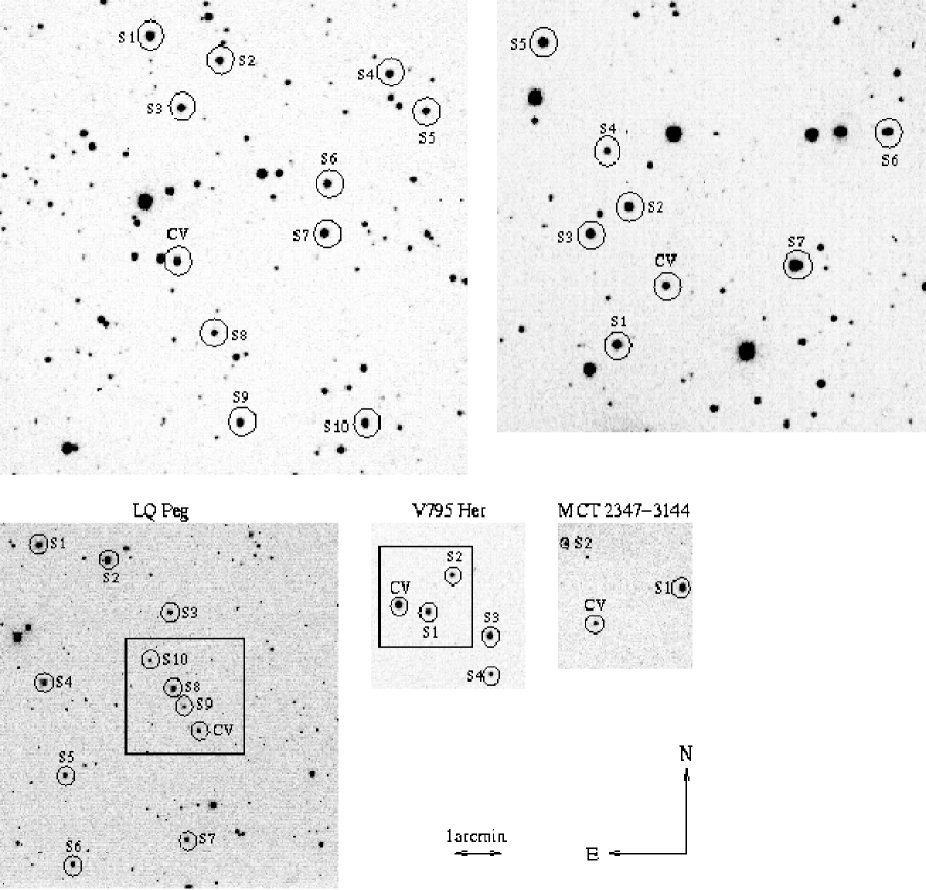
Our dataset consists of photometric observations conducted at the SAAO (5 nights) and at the OHL (10 nights spreading over 3 periods). A preliminary analysis of the results was presented by Papadaki et al. (2004). All observations were unfiltered, while the exposure time varied between 30 and 60 s according to the telescope used and the atmospheric conditions. Table 7 gives the observing log. For the purpose of differential photometry seven comparison stars were selected, as indicated in Fig. 10: S1 ([HH95] V1193 Ori-5, =13.513), S2 ([HH95] V1193 Ori-9, =13.829), S3 ([HH95] V1193 Ori-7, =13.920), and S4 ([HH95] V1193 Ori-11, =15.110) from Henden & Honeycutt (1995), as well as S5 (U0825_01407649), S6 (U0825_01402900), and S7 (U0825_01404164) from the USNO (United States Naval Observatory) catalogue at ESO (European Southern Observatory).
Given the fact that no filters were used, we were not able to perform any transformations to a photometric system. Nevertheless, we have applied the following procedure that yields the most reliable magnitudes in our case. From our comparisons we have chosen S1–S4 for which Henden & Honeycutt (1995) give their magnitudes. Based on their differential magnitudes, we could derive the magnitude of V1193 Ori. Moreover, by checking the behaviour of the magnitude differences between two comparison stars at the SAAO and OHL, we applied the appropriate magnitude shift and were in this way able to compare all light curves.
| UT date | UT date | UT date | ||||||
|---|---|---|---|---|---|---|---|---|
| 22oct02a | 13.83(6) | 0.298(5) | 18jan04a | 14.34(8) | 0.406(36) | 06nov03b | 14.70(10) | 0.329(10) |
| 23oct02a | 13.87(7) | 0.293(8) | 10oct04a | 14.27(7) | 0.397(25) | 08nov03b | 14.81(7) | 0.341(14) |
| 24oct02a | 13.89(8) | 0.299(6) | 12oct04a | 14.12(5) | 0.399(11) | 12jan05b | 16.15(13) | 0.328(6) |
| 25oct02a | 13.89(6) | 0.299(4) | 10jan05a | 14.75(7) | 0.410(12) | 24oct02c | 16.77(11) | 1.912(11) |
| 26oct02a | 13.89(6) | 0.302(5) | 14jan05a | 14.75(6) | 0.434(9) | 25oct02c | 16.94(9) | 1.915(8) |
| 04nov03a | 14.43(7) | 0.412(12) | 11sep03b | 13.90(5) | 0.332(14) | 26oct02c | 16.98(9) | 1.909(8) |
| 05nov03a | 14.48(6) | 0.415(12) | 13sep03b | 14.01(8) | 0.327(12) | 27oct02c | 16.80(7) | 1.877(11) |
| 06nov03a | 14.46(6) | 0.415(13) | 14sep03b | 13.90(9) | 0.332(11) | 13aug03c | 15.86(6) | 1.896(8) |
| 08nov03a | 14.47(7) | 0.425(25) | 04nov03b | 14.63(11) | 0.330(13) | 16aug03c | 16.00(8) | 1.903(4) |
| 17jan04a | 14.36(3) | 0.399(17) | 05nov03b | 14.67(10) | 0.329(10) | 17aug03c | 15.99(9) | 1.895(5) |
Notes: is the mean nightly magnitude of our object ; is the nightly mean of the shift between two comparison stars ; a,b, & c indices correspond to observing runs of V1193 Ori, LD 317, and MCT 2347-3144, respectively.
Table 1 shows , the system’s mean nightly magnitude and the variation of the difference between the mean magnitudes of two comparison stars, . Even though the difference between the standards’ mean magnitudes varies up to 0.1 mag, this is negligible compared to the much larger variability of V1193 Ori. Not much attention should be paid to the significance of the system’s shift in 2004 and 2005, since all individual runs belonging to these sequences are of small duration compared to the , so the system’s mean magnitude could be misleading. This is also why only the runs of 2002 and 2003 will be used for interpretation, as will be mentioned later.
In our analysis we have divided the observing sequences into three different datasets, taking the different sites and brightness states into account. The first one contains the light curves obtained at the SAAO, the second one those of November 2003 at the OHL, and the third one the remaining obtained at OHL. In Fig. 11 the individual light curves can be seen in detail, while in the upper left part of each light curve, the mean of the comparison stars is indicated for correlation with the corresponding of V1193 Ori.
For this CV, as well as for the rest of this paper, frequency analysis was performed by using the period04 package (Lenz & Breger 2005), based on the Discrete Fourier Transform method. Calculations of the uncertainties for the fitted parameters were performed by means of Monte Carlo simulations from the same package. For the first dataset, we confirm the previously reported spectroscopic of 3.96 h. In more detail, we find a periodicity of 6.046(6) c d-1 with a semi-amplitude of 0.047(2) mag. The corresponding frequency spectrum and the folded data on this periodicity can be seen in Fig. 1a and Fig. 1b, respectively. To reduce the noise from random variability, the folded data have been smoothed in Fig. 1c with a boxcar of 5. In the power spectrum (PS), the peaks surrounding the 6.046 c d-1 frequency are nothing but aliases, since they disappear as soon as this frequency is removed. Frequency analysis of the residuals did not reveal other coherent periodicities. The sinusoidal representation of the has been plotted in the light curves of Fig. 11.

For the second dataset, the same periodicity is still clearly visible only in the night of 4 November 2003. Its amplitude, though, has decreased to 0.037 mag. The rest of the sequences belonging to this dataset show no clear evidence of this periodicity. Its low amplitude, as well as the folding, leads us to the conclusion that it either does not exist any more or must have fallen below the detection limits. We note that none of the periodicities mentioned at Ak et al. (2005) could be detected. Their application to the data gave amplitudes that were too small and unsatisfying foldings.
The third dataset consists of all the short runs obtained mainly in non-photometric conditions making it unsuitable for period analysis. However, the data seem to be consistent with the existence of a periodic signal. The sine-curve of the orbital frequency has been fitted individually to the last two datasets (Fig. 11) only for comparison purposes and no conclusions should be drawn.
In order to obtain the orbital ephemeris, the timings of the photometric maxima were determined by fitting a parabola to the corresponding peaks. We have only used the 6 maxima belonging to the runs in which the periodicity of 3.97 h was detected. In this way we get:
| (1) |
Had we not detected the periodicity in the first night of the second dataset, we would have believed that its detection only at the SAAO data could have been associated with how the system at that time was brighter than all the other datasets. In the first dataset it has a mean value of 13.9 mag, in the second one 14.4 mag, while in the third dataset it varies between 14.1 and 14.7 mag. Even though the periodicity exists in the data of 4 November 2003, its amplitude has decreased, so there could still be a possible correlation between the shifts in the system’s brightness and the non-detection of the signal.

We also searched for possible QPOs but no coherent signals were detected. Each night’s PS showed many peaks, predominantly between 50–100 c d-1. Since Fourier analysis could omit signals that are unstable in amplitude and frequency, the following procedure was applied. We averaged the PSa of all nights, excluding the two shorter ones and plotted them in log-log scale as shown in Fig. 2. A broad feature is evident from 50 c d-1 on, with a peak around 70 c d-1. This feature is the counterpart of the QPO evident in our light curves. Inspection of the individual average PSa of 2002 and 2003 revealed similar behaviour in the same frequency range, albeit more prominent in 2003.
The PSa of CVs show so-called ”red noise” characterised by a power-law decrease of the power with the frequency (the power decreases linearly in log-log scale). It is usually assumed that “red noise” is due to flickering through a shot noise-like process (an extensive discussion of the flickering properties and origin in CVs can be found in Bruch 1992). In the shot noise model, the light curve is generated by overlapping of many random ”shots” (or pulses) of a given shape. If all shots have equal duration, the PS of the resulting light curve is simply the PS of the single pulses; i.e. it is determined by the shape of the individual pulses. For example, if the shots have an infinite short rise-time and then decay exponentially (sometimes called classic ”shot noise”), the power law index (or the slope of the linear part in log-log scale) is 2. If on the other hand the shots’ durations are different and follow some distribution, which is to be expected given the suggested mechanisms for generating the flickering (Bruch 1992), then gets smaller. Therefore, can be changed in the shot noise model by at least two ways, either by changing the distribution of the shots’ duration or by changing the shape of the shots (see e.g., Kraicheva et al. 1999). Mineshige et al. (1994) (see also Takeuchi et al. 1995) propose a model for the ”red noise” from accreting compact objects, based on the self-organised criticality concept of Bak et al. (1988), which could explain both the power-law shape of the PS and variability of the power-law index. We would like to emphasise, however, that the measurements of are very difficult to interpret and, despite the numerous measurements for many CVs, this has so far not led to significant progress in our understanding of the physical origin of flickering. Nevertheless, we measured for the stars we study and specifically looked for any seasonal variations that might indicate change of the flickering properties. At least for one CV, TT Ari, Kraicheva et al. (1999) detected a decrease in and the activity of the flickering when the star switched from a ”negative” to a ”positive” superhump state.
It is clear from Fig. 2 that ”red noise” is also present in the mean V1193 Ori PS. The linear part from 100 c d-1 on was fitted by a least-square linear fit to determine . From the average log-log PSa of 2002 and 2003, was found to be 2.10(2) and 1.57(2), respectively. However, as discussed in Kraicheva et al. (1999), these errors should be considered as a lower limit. The PSa were very noisy and small changes in the fitting interval caused changes in the value of reaching 0.1 for the average PS and 0.15 for the individual ones. These errors should be considered as the real ones.
The amount of flickering has also been measured by subtracting the sinusoidal periodicity from our light curves and measuring the in each light curve. Then the average of all and its as uncertainty, were computed and found equal to 0.0584(120) mag. Moreover, from the light curves of Fig. 11, we can see that the increase in the CV’s mean magnitude by 0.5 mag between the two first datasets has been followed by a decrease in the amplitude of the flickering activity. The total range was found to be 0.2 mag for the first dataset and 0.15 mag or lower for the second, in agreement with previously reported values.
3.2 LQ Peg
LQ Peg (PG 2133+115) was first discovered in the Palomar-Green (PG) survey (Green et al. 1982) and identified as a CV in 1984 (Ferguson et al. 1984). The same authors argue that LQ Peg is a thick-disc CV probably of the UX UMa subtype of NL CVs.
Ringwald (1993) performed a radial-velocity study of LQ Peg that yielded a period of 2.9 h, identified as the . This result, though, does not stand on solid ground because of the weak emission lines that makes the velocity measurements difficult. Private communication with Dr. Ringwald clarified that there was indeed a very significant false-alarm probability for the determination, a highly noisy periodogram, as well as insufficient spectra sampling. Until a new radial-velocity study has been done, we therefore must assume that the of LQ Peg is not known.
Interest in LQ Peg began to rise after the discovery of dramatic fadings of up to 5 mag at irregular intervals. The first one was recorded on photographs taken in 1969 (Sokolov et al. 1996), a second one in 1999 (Watanabe 1999; Kato & Uemura 1999), and recently a third one, albeit poorly sampled (Honeycutt & Kafka 2004). Judging by the general pattern and the time-scale of the recovery from minimum, Kato & Uemura (1999) placed LQ Peg among the VY Scl subgroup of NL CVs.
Time-resolved photometry of LQ Peg is scarce. Misselt & Shafter (1995) obtained a single-night 6-h photometry. The data showed no periodicity and there was fairly strong flickering. Schmidke et al. (2002) conducted a photometric study during the star’s return to normal brightness on eight nights in 1999–2000 (Schmidke et al. 2002). Considerable flickering was present during all nights (0.09 to 0.02 mag) with a decline in amplitude as the system brightened. But again, no coherent periodicity was found.
Photometric observations of LQ Peg were conducted at SK and KR observatories. The exposure times varied from 45 to 60 s depending on the telescope, the filter used (if any), and the atmospheric conditions. As indicated in Table 7, we observed for 10 nights in total, from early June till late August 2004. For the SK observations, we used the Johnson- filter, while the KR ones were unfiltered.
The comparison stars used to accomplish the differential photometry were always the same except at KR, where there were fewer due to the smaller FOV of the camera, indicated with a box in Fig 10. The comparisons are: S1 ([HH95] PG2133+115-2, =13.544), S2 ([HH95] PG2133+115-8, =13.097), S3 ([HH95] PG2133+115-23, =15.132), S4 ([HH95] PG2133+115-27, =13.916), S5 ([HH95] PG2133+115-31, =14.888), S6 ([HH95] PG2133+115-4, =14.693), S7 ([HH95] PG2133+115-35, =14.692) from Henden & Honeycutt (1995), as well as S8 (GSC 01128-00678) from the General Sky Catalogue, and S9 (U0975_20472734) and S10 (U0975_20473384) from the USNO catalogue at ESO. A detailed view of the individual light curves with the night-to-night variations removed and a constant added to the arbitrary magnitude units is shown in Fig. 12. In the upper left part of each light curve, the mean of the comparison stars is indicated for comparison with the corresponding of LQ Peg.
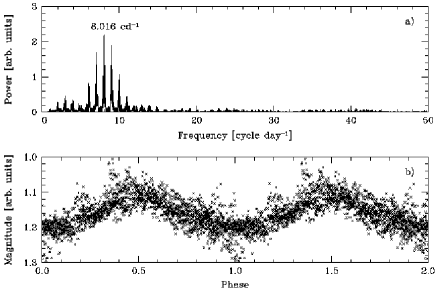
Night-to-night variations in the system’s mean magnitude may introduce false peaks in the periodograms. Prior to frequency analysis, we therefore removed those variations by subtracting its mean from each light curve. We detected a periodicity with frequency 8.0164(1) c d-1 and semi-amplitude 0.047(1) mag. This frequency corresponds to a periodicity of 2.99 h, and the resulting sine curve is shown in Fig. 12. The PS, as well as the data folded on the detected periodicity, are given in Fig. 3a and Fig. 3b, respectively. The 2.99-h periodicity does not only appear when the data are treated all together but even if the -filtered and unfiltered runs are treated separately.

Following the same procedure as for V1193 Ori, the amount of flickering and its corresponding were found to be 0.0241(184) mag. The nights with the largest mean of the comparison stars, were not used to derive the aforementioned value. The flickering source is also evident in Fig. 4. It is characterised by , while small changes in the fitting interval have given a real error of 0.15. The average PS of the June and August runs yielded and with real errors, reaching 0.2–0.3.
A period analysis that was carried out on the residuals of the 2.99 h revealed no coherent periodicities. We have searched for possible QPOs by applying the same method as in Sec. 3.1. In this case, a broad feature seems to exist between 26–45 c d-1, as shown in Fig. 4. However this 30 min candidate QPO has a power that only exceeds the continuum by a factor of 1.5. Therefore, its reality cannot be secured.
The observations cover 14 photometric maxima. After fitting a parabola to the corresponding peaks, the timings were determined and the following orbital ephemeris was obtained:
| (2) |
We also extracted spectroscopic data from the Isaac Newton Group (ING) Archive. The spectra were obtained on the 15 August 1997 at the 4.2-m William Herschel Telescope (WHT) with ISIS, a high-efficiency, double-armed, medium-resolution spectrograph that permits simultaneous observing to be done in both red and blue channels. All the relevant information concerning the spectroscopic data can be found in Table 2.
| BLUE | RED | |
| UT Date | 15 Aug 1997 | 15 Aug 1997 |
| Grating | H2400B | R1200R |
| Dispersion(Å/pixel) | 0.11 | 0.41 |
| Total spectral range (Å) | 442 | 420 |
| (Å) | 4798 | 6562 |
| 675.576 | 675.591 | |
| Duration(h) | 2.8 | 2.5 |
| # Spectra | 14 | 10 |
| Exptime(sec) | 600 | 600 |
After bias subtraction, the spectra were processed, using the IRAF task doslit. Continuum division was then applied from the corresponding task continuum. No flat field correction or flux calibration was made. We looked for radial-velocity variations in the emission lines but found variations only at the level below 10 km s-1 for H, i.e. below the spectral resolution in the red. We thus conclude that no radial-velocity variations are present within our limits.
The median combined spectra for the blue and red arm can be seen in the upper and lower panels of Fig. 5, respectively.

They show emission lines identified as He ii (4686 Å), H, H, and He i (6678 Å). As is evident from Fig. 5, all lines are weak compared to continuum, with only H and H clearly visible in the individual spectra. No absorption lines were unambiguously detected. The full widths and equivalent widths of the emission lines are shown in Table 3; however, the values for He i are quite uncertain since its flux was the lowest one, being close to the continuum with a profile that is not well-defined. Only by computing the median spectrum did this peak reveal itself.
| FW(km s-1) | EQW(Å) | |
|---|---|---|
| He ii(4686 Å) | 758 | 0.52 |
| H | 784 | 1.46 |
| H | 889 | 3.65 |
| He i(6678 Å) | 550 | 0.24 |
As mentioned before, Ferguson et al. (1984) obtained a spectrum covering the range 3850–4950 Å, showing emission cores within the broad absorption lines of He ii (4686 Å) and H. However, both He ii (4686 Å) and H have appeared as pure emission lines in the WHT spectra we studied. The set of optical spectra of LQ Peg from Ringwald (1993) also showed H and He i (6678 Å) in emission, but H supposedly revealed radial velocities up to 300 km s-1, in contrast to the present spectra. A closer inspection of a spectrum kindly sent to us by Dr. Ringwald revealed that the values of the full widths of the two emission lines were almost double compared to ours.
3.3 LD 317
LD 317 was discovered by Dahlmark (1999) based on approximately 68 magnitude estimates from photographic plates taken between 1967 and 1999. A spectrum obtained by Thorstensen confirmed it as a CV (www.cvcat.net), while H spectroscopy (June 2001–October 2002) revealed a of 3.69 h (Fenton et al. in preparation). Although it is still uncertain uncertain, LD 317 has been classified as a NL CV (www.cvcat.net).
Our photometric dataset consists of eight observing sequences in total, performed at the OHL. All runs were unfiltered, while the exposure time varied between 15 and 60 s, depending on the atmospheric conditions. A log of the details of all sequences can be seen in Table 7.
The comparison stars used for the differential photometry are S1–S10, as shown in Fig. 10. Unfortunately, no well-defined magnitudes have been published for those present in our FOV. In order to obtain the transform equation, we used the magnitudes of those comparisons just as they are given in the USNO catalogue at ESO. Those are S1 (U1275_18605964, =14), S2 (U1275_18604470, =14.4), S3 (U1275_18605222, =14.4), S4 (U11275_18600804, =14.4), S5 (U1275_18600027, =14.7), S6 (U1275_18602067, =14.6), S7 (U1275_18602099, =14.4), S8 (U1275_18604486, =15.3), S9 (U1275_18603877, =14.9), and S10 (U1275_18601201, =14.8). From each light curve we removed night-to-night variations by subtracting its mean We then added a constant to the arbitrary magnitude units and the result is shown in Fig. 13. In the upper left of each panel in the same figure, the mean of the comparisons’ variations are presented through the error bar, which serves as a comparison to the system’s variation.
We performed a frequency analysis by treating all light curves as a whole, as well as by dividing them into two sets. The first one consists of the observing runs of September 2003 and the second of November 2003. This was done because the system between these two sets has faded by 1 mag and a different behaviour could be expected. The reality of this fading can be seen in Table 1 when comparing to the much smaller shift between two comparison stars, .
Nevertheless, no dominant periodicities were revealed. The only exception could be a periodicity of approximately 3.27 h found at the two individual sets and one of 3.48 h found from all light curves together. These two could be related to the 2-d alias of the reported periodicity of 3.69 h. However, in both cases, the amplitudes are low and the fit of the data to these periodicities is not very satisfying. Our light curves (Fig. 13) indeed show random variability with the exception of the 13 and 14 September 2003 sequences where a trend seemed to exist.
The flickering activity is found to differ between the observing runs of September and November 2003, where the system’s mean magnitude has increased by almost 1 mag. In September 2003 the flickering’s mean value and corresponding (computed in the same way as V1193 Ori) were found to be 0.0689(51) mag. However, in November 2003 the flickering increased to 0.0949(177) mag. These light curves are dominated by much more random variability than before, as seen in Fig. 13, making the detection of any modulation even more difficult. Furthermore, in January 2005 the system had further faded by 1.5 mag with respect to November 2003. The light curve, however, still resembled that of November 2003, both in the amplitude of its flickering and in its random variability. To find the amount of flickering for November, the first short run was not used and the visible trend as seen in Fig. 13 was removed from the remaining two. The rest of the runs were kept as they were. Moreover, the power law index of the flickering source’s average PS was found to be . For September and November it was 1.44(2) and 1.86(2), respectively. Following the same procedure as before, the real error of the average PS approached 0.05 while of the individual ones 0.05–0.1. We also searched for possible QPOs but none was evident.
3.4 V795 Her
V795 Her (PG1711+336) was discovered in the PG survey (Green et al. 1982) and identified as a CV candidate because of the weak hydrogen emission lines observed in its spectrum. Observations during the period 1983–2002 revealed a periodicity around 2.8 h, occasionally vanishing below detection limits, as summarised in Table 4. At the beginning it seemed that each value was just a more precise, “corrected” one. But it appears that this modulation might not be such a stable “clock”, its phase stability only being kept on a timescale of less than 20 d (Patterson & Skillman 1994). Besides, V795 Her shows pronounced flickering activity over all the years, as well as variations exhibiting a timescale of 10–20 min (Rosen et al. 1989). QPO-like activity has also been reported at 15 min (Rosen et al. 1995) and 1160 s (Patterson & Skillman 1994).
| Years | Period (d) | Source |
|---|---|---|
| 1983 | 0.115883 | Mironov et al. (1983) |
| 1983–1985 | 0.114488 | Baidak et al. (1985) |
| 1983–1985 | 0.1157550 | Rosen et al. (1989) |
| or 0.1158807 | ||
| 1983–1988 | 0.1166728 | Kaluzny (1989) |
| 1983–1989 | 0.1164865 | Shafter et al. (1990) |
| 1983–1990 | 0.1164683 | Zhang et al. (1991) |
| or 0.1164489 | ||
| 1992–1994 | Absent | Patterson & Skillman (1994) |
| 1992–1994 | Absent | Casares et al. (1996) |
| 2002 | 0.116959 | Patterson et al. (2002) |
Further periodicities have been detected for V795 Her (see Table 5). Among them lies a 2.6-h periodicity from the radial velocities of the emission lines (Shafter et al. 1990), which is strongly believed to be the system’s .
| Type | Source | |
|---|---|---|
| 14.8 h | Spectroscopic (Optical) | Thorstensen (1986) |
| 2.60 h | Spectroscopic (Optical) | Shafter et al. (1990) |
| Spectroscopic (Optical) | Dickinson et al. (1997) | |
| Spectroscopic (HST UV) | Rosen et al. (1998) | |
| 4.86 h | UV resonance lines | Prinja et al. (1992) |
| UV resonance lines | Prinja & Rosen (1993) |
Thorstensen (1986) found an unusually long spectroscopic periodicity of 14.8 h, which he believed to be the , but also no sign of the 2.8-h photometric signal. He proposed that, if both periods were true, then V795 Her could be a slow DQ Her. This opinion was partly abandoned when the 2.6-h spectroscopic period was detected (Shafter et al. 1987). Shafter et al. (1990), also in favour of an Intermediate Polar (IP) interpretation, came to the conclusion that the 2.6-h and not the 14.8-h is the , while the 2.8-h photometric modulation is the beat period between the and the rotation period of the WD. However, the main disadvantages of the IP-model are that (1) X-ray observations have not revealed any of the periodicities reported, (2) the expected rotational period of the WD has not been detected, and (3) the UV spectrum was found to be consistent with the properties of non-magnetic CVs rather than IPs (Prinja et al. 1992). Nevertheless the IP model is not ruled out, taking into account a similar circumstance of the IP EX Hya.
Another interpretation was put forward involving a precessing disc (Zhang et al. 1991; Patterson & Skillman 1994). In this case, it is thought that 2.6 h is , while the 2.8-h modulation is the beat period between the and the , corresponding in that way to a positive superhump period . The 2.8-h modulation is slightly unstable both in period and amplitude, just as superhumps are known to be. Last but not least, this interpretation is characterised by its physical plausibility. Theoretical studies suggest that ADs in binaries with a mass ratio , which are large enough to make the tidal forces adequately strong, should indeed experience an eccentric instability. Considering the small of V795 Her that would lead to a small q (around 0.2 as deduced in Warner 1995) and that discs are larger when the system is brighter and V795 Her is comparably bright to DN in outburst,together give firm ground for applying this theory (Patterson & Skillman 1994).
Casares et al. (1996), who conducted medium-high resolution spectroscopy, claim that V795 Her displays some of the key properties of SW Sex stars: Balmer line radial-velocity lag, attenuation of Balmer, and He i flux around phase 0.5, accompanied by marked double peaks or central absorption. However, in contrast to the majority of SW Sex stars, it shows no eclipses and lies inside the period gap. A similar behaviour between the V795 Her emission lines and the ones of SW Sex stars was also noted by Dickinson et al. (1997).
Photometric CCD observations of V795 Her were performed at the KR, SK, and OHL observatories between June 2003 and May 2005. Depending on the telescope and the atmospheric conditions at that time, the exposure time varied between 20 and 100 s. We observed for 30 nights in total, of which 20 are unfiltered, 5 are in Johnson- filter, and 5 in Johnson- filter. Table 7 gives the observing log.
The comparison stars used to perform the differential photometry are indicated in Fig. 10, the box corresponding to the KR FOV. S1 ([HH95] V795 Her-11), S2 ([HH95] V795 Her-12), S3 ([HH95] V795 Her-4), S4 ([HH95] V795 Her-5) were used for SK and OHL, while S1–S2 for KR.
No transforms between the different runs were made, because different filters were used and a check of the difference between two comparison stars did not prove stable. Therefore, any comparison between light curves belonging to different runs could be misleading. Consequently, further analysis will be performed after removing any night-to-night variations by subtracting from each light curve its mean. The resulting light curves, after adding a constant, are shown in Fig. 14.

Using period04 (Lenz & Breger 2005) for the whole dataset, we found a signal with a frequency of 8.60238(1) c d-1 corresponding to 2.79 h or 0.116 d and a semi-amplitude of 0.083(1) mag. No eclipse was observed, while the pulse profile is asymmetric with a steeper rise than decline, as also noted by Rosen et al. (1989).
We continued frequency analysis for the above residuals, and the next powerful frequency was 17.2 c d-1, the second harmonic of 8.602 c d-1, suggesting that the variation in our data is not completely sinusoidal, as is obvious from Fig. 14. All subsequent frequencies did not have significant amplitude, and the corresponding folding revealed no trends.
We divided our light curves into 4 subgroups of duration no longer than 20 d and performed frequency analysis for each one. The two stand-alone runs of 5 June 2004 and 14 January 2005, which were shorter than 2.8 h, have not been included. The same applies for the two short runs of September 2003, since the PS showed strong aliases and it was difficult to distinguish which peak was real. The subgroups can be seen in Table 6. Included together are the corresponding highest peaks of the PS.
| Subgroup | Time interval | [c d-1] | Amp.[mag] |
|---|---|---|---|
| 1 | 02–03jun03 | 8.548(6) | 0.133(2) |
| 2 | 19–23jul03 | 8.586(2) | 0.090(2) |
| 3 | 14–21may04 | 8.589(2) | 0.104(2) |
| 4 | 03–14may05 | 8.628(2) | 0.125(3) |
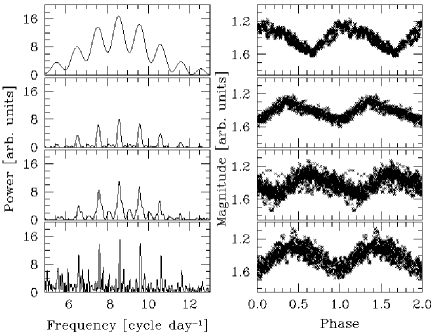
It appears that the modulation appearing in all subgroups is indeed unstable both in amplitude and period. In this respect, a single period fitted to one subgroup is often out-of-phase with the best-fit sinusoid of the other subgroups. This is clearly shown in Fig. 6, where each row from top to bottom represents subgroups 1–4. The PS from 5–13 c d-1 and the data folded on the corresponding periodicity are shown in the left and right columns, respectively. It was also noticed that, if taken at face value, the change in the period corresponds to a decrease of 0.005 d over a year. Fig. 14 shows the sinusoidal representation of each subgroup’s periodicity superimposed on the light curves belonging to the same subgroup. The two individual nights of 5 June 2004 and 14 June 2005, as well as those of September 2003, were fitted with the sine curves of the subgroups closer to them.
QPOs have been reported on in the past. Lately, Patterson et al. (2002) reported a broad signal near 80 c d-1 that possibly resolved into components at 71.0 and 80.4 c d-1 in 2002 and similar results but at slightly different frequencies in 1993. We constructed the average PS of all runs exceeding a duration of 2 h and confirm the existence of a QPO near 80 c d-1 as is clearly shown in Fig. 7. In our case the broad signal also resolves into two components with slightly shifted frequencies compared to the ones reported by Patterson et al. (2002). An inspection of each year’s average PS revealed the same QPO and its components, though each time at slightly different frequencies and power.
The power law index that characterises the “red noise” seen in Fig. 7 has a value of . Its values for 2003, 2004, and 2005 individually are 1.55(3), 0.84(5), and 1.33(4), respectively. The real errors coming from changes in the fitting region reach 0.17 for the average PS and vary between 0.25–0.4 for the average PSa of the individual years. The amount of flickering was also measured by removing the appropriate sinusoidal periodicity from each subgroup and following the same procedure as in the previous CVs. For all runs it was found to be 0.0526(124) mag. Additionally, the mean values for the 2004 and 2005 runs increased by 36% in comparison to the 2003 runs, after treating each year individually,.
3.5 MCT 2347-3144
MCT 2347-3144 was recently discovered and classified as a CV in the Montreal-Cambridge-Tololo (MCT) survey of southern sub-luminous blue stars (Lamontagne et al. 2000). This discovery did not undergo any observational follow-up or subsequent analysis. It has therefore been one of our selected targets of poorly known CVs.
Our dataset consists of two observing runs (totalling 7 nights) conducted at the SAAO. The first one was acquired in October 2002 and the other one in August 2003. All runs were unfiltered, and the exposure time varied between 20 and 120 s depending on the atmospheric conditions. The observing journal is given in Table 7. A preliminary analysis of the results was presented by Papadaki et al. (2004).
The two comparison stars indicated in Fig. 10, S1 (U0525_44380565, =14.7) and S2 (U0525_44381883, =16.6), were selected for differential photometry. Their magnitudes and designations were adopted from the USNO at ESO catalogue. The reality of the increase in the system’s mean magnitude by 1 mag in a one-year period is evident in Table 1 when comparing to .
Frequency analysis was first performed on the October 2002 data. The most powerful frequency that was detected is 1.608(2) c d-1 of semi-amplitude 0.182(3) mag along with its aliases. However, it was difficult to distinguish which should be the accepted frequency. Indeed, as seen in Fig. 8a, the frequencies of 1.6 c d-1, as well as 0.6, 2.6, and 3.6 c d-1, have very similar power. We therefore tested each one with the aim of choosing the one that best fits the data and has the smallest residuals as well. In this way we concluded on two most probable frequencies. Either 2.6 c d-1 corresponding to 9.2 h or 3.6 c d-1 corresponding to 6 h. The folding of the October 2002 data on both periodicities can be found in Fig. 8b and Fig. 8c. The residuals of the two probable periodicities were searched further but no other periodicities were revealed.
In contrast to the first dataset, the second one did not reveal any coherent periodicities. The light curves can be seen in more detail in Fig. 15. Since the mean of the comparison stars, represented by error bars in the same figure, does not change for the two datasets, the large scatter visible in the second one should not be attributed to poorer weather conditions but to an increase of 50% in the amplitude of the flickering. In particular, for 2003 its mean value and were 0.0771(39) mag, while for 2002 they were 0.0528(34) mag (computations based on the same procedure as for V1193 Ori), after subtracting the sinusoidal periodicity of 2.6 c d-1. Therefore, even if the modulation existed, we would not have been able to detect it.
Because of the uncertainty in determining the exact periodicity in the first dataset, no ephemeris will be given. However, by fitting a parabola, we obtained the only time of maximum available, which was found to be 2452572.356 d.


In Fig. 9 the log-log PSa of all observing runs, as well as of October 2002 and August 2003 alone, are shown. A broad signal near 25 c d-1 or 58 min is clear in the 2003 graph. This broad signal appears to resolve into two components, but is not seen in the runs of 2002. Moreover, another broad signal could exist near 50 c d-1, but it is not as clear. Given the fact that there were not many runs to average and the non-persistence of the signals during the 1-year period, we can only propose these two signals and especially the first more prominent one as candidate QPOs. The power law index for the average PS, as well as the two sets of runs, was found 1.32(5), 1.40(8), and 1.21(8), respectively. Small changes in the fitting region of the linear part (in log-log) resulted in an error reaching 0.25 for the average PS and 0.25–0.5 for the individual PSa of each year.
4 Discussion
4.1 V1193 Ori
For the first time we confirm V1193 Ori’s of 3.97 h photometrically. The failure of the previous photometric campaigns to detect it can be attributed to a combination of reasons: the rapid high-amplitude flickering, the much smaller amplitude of the periodicity than the flickering, as well as the insufficient duration of the runs. We also note that no eclipses were seen in our light curves, in accordance to Warner & Nather (1988) and Bond et al. (1987).
We find evidence of a QPO around 20 min and confirm the high-amplitude flickering. The power-law index was found to be 1.74(1) for the average PS, while it differed between the individual average PSa of 2002 and 2003. It is interesting to note that in 2003 the decrease in the mean system brightness was followed by a decrease in the flickering amplitude and , similar to TT Ari. As discussed in Kraicheva et al. (1999), this might reflect either changes in the pulse shapes or a change in the distribution of the shots’ duration. The same interpretation applies to the rest of this work’s CVs that have shown seasonal changes in . It should also be noted that the decrease in between 2002 and 2003 is accompanied by the disappearance of the periodic photometric modulation in 2003.
A possible origin of the periodic brightness change is, given the morphology of the folded data, the low amplitude of the periodicity, and the fact that the observed signal has a periodicity identical to the , extra light of the side of the secondary that is face-on with the primary, i.e. the irradiation of the companion star. One asset of this explanation is that Ringwald et al. (1994), who have performed the only spectroscopic study of V1193 Ori so far, also suggest that the H emission line profile variations throughout the orbit could result from the irradiation of the secondary.
4.2 LQ Peg
We have been able to detect a clear modulation of 2.99 h. Flickering was found to vary within the narrow interval of 0.0218–0.0258 mag. The average PS is described by and a candidate QPO, resolving into two components, was also detected near 30 min.
That this periodicity has not been detected so far could be attributed to the following reasons. First of all, the photometric studies were performed either during the return to normal brightness or during the fading. The state of the CV is unknown only in the study performed by Misselt & Shafter (1995), consisting of only 6 h of observation. In all cases, however, there was high amplitude flickering that could easily be the reason for the periodicity’s masking. Furthermore, Schmidke et al. (2002) point out that as the system brightened, approaching its normal high state, the amount of flickering declined in magnitude units. As noted above, they report a decrease in amplitude from 0.09 to 0.02 mag. Therefore, if LQ Peg is caught in a state other than its high one, the periodicity will probably be masked by the increased flickering. The clear appearance of the signal in our data should be connected to LQ Peg being at its normal high-brightness state. The steadiness of the flickering amplitude throughout the three-month observing time-interval could also be an indication that the system is neither fading nor brightening, but lies at its normal high state instead.
Concerning the interpretation of the photometric signal and due to its similarity with that of V1193 Ori it could also, for the same reasons, represent the resulting from the irradiation of the secondary star. However, if we consider that (i) this modulation has come up during the system’s high-state, (ii) no periodicity had been found in the previous years when it was observed in states other than its high one, (iii) it has a rather large amplitude with a triangular-like form, and (iv) there is a suspected spectroscopic of 2.9 h, then the photometric signal could be a . However, as previously discussed in Sect. 3.2, the of LQ Peg is not very accurately known. Even if the 2.9 h period was correct and the 2.99 h was the , the fractional period excess would be about 0.03, much too small for a system with such a (Patterson et al. 2005). But given the uncertainty in , there is nothing to rule out the possibility that the modulation could also be a , slightly shorter than the .
The WHT spectra, both in the blue and the red arms, show single-peaked emission lines. All lines are weak compared to the continuum and show no orbital radial-velocity variations. Although the spectroscopic data are not adequate, some possible explanations could be a disc wind, a very low inclination, and emission-line components produced by the irradiating side of the secondary. The WHT spectra were obtained during a high state of LQ Peg as is deduced from the long-term light curve of Honeycutt & Kafka (2004), and this is the state that mostly favours the existence of an AD driven wind, due to the high mass transfer rate. Such a situation could also have explained how the full widths of the emission lines in the spectra we analysed proved to be half those of Ringwald and that the lines are now single-peaked. If the wind has grown stronger, obscuring the inner radii of the disc from where it originates, this could result in a velocity decrease in the wings of our lines, giving narrower lines, as well as filling in the space between the two disc peaks, giving single-peaked lines. In the optical, such winds are revealed via either P-Cygni profile, a shallow, blue-shifted, very broad absorption component in the emission lines, or by a red-emission wing of a line, characteristic of a receding outflow (for examples see Kafka & Honeycutt 2004). However, no such signature was ever detected in our set of spectra. Concerning the second explanation, it is true that, if LQ Peg is a very low inclined system, then stationary single-peaked emission lines would be expected. Such a scenario, though, would be in accordance with the powerful photometric modulation, only if this signal is a superhump and not if caused by irradiation. That is, because irradiation-caused modulations are not expected to be seen in low-inclined systems, while superhumps are known to be nearly independent of inclination (Warner 1995). The third possible explanation has its origin in the chromospheric Balmer emission that is commonly observed in CVs (Warner 1995). The irradiating part of the secondary facing the primary has in many cases appeared as a narrow emission-line component. That this component creates radial velocities approximately in anti-phase to those of the emission lines originating from the AD means that the radial velocities of the two Balmer lines could include unresolved emission components from both the AD and the irradiating part of the secondary. But being in anti-phase will result in the computation of almost no radial velocities.
We believe that in our spectra the system lies in a higher state than that of Ringwald, so the anti-phased secondary component is enhanced, producing negligible radial-velocity variations. However, another possible mechanism producing stationary emission has been detected during DN outbursts (Steeghs et al. 1996) and is referred to as “slingshot prominences”. During this phenomenon, plasma flows along the lines of stable magnetic loops formed by the secondary. It then piles up on top of the loops and, confined there, it forms a dense region of gas, illuminated by the disc and the irradiating face of the secondary. This leads to an emission source co-rotating with the secondary, which could produce stationary emission-lines. However, in our case this can only remain a hypothesis, due to the lack of adequate data.
4.3 LD 317
In 2003, our observations indicate an apparently fading episode, which was followed by an increase in the flickering amplitude and , in contrast to V1193 Ori. Therefore, no conclusion on the correlation between a system’s mean brightness and its flickering activity can be drawn from this study. No periodic signal was detected from our data, but this might have been caused by the very large flickering activity noted.
Combining the facts that LD 317 has already been proposed as a NL CV, that in our observations it has appeared to fade by 1 mag in an interval of approximately 50 d, and that it appears in an even lower state in 2005, we conclude that it should belong to the VY Scl subtype. In this respect we must have caught the system during two fading episodes, one in 2003 and one in 2005. Judging by its mean magnitudes, the star fades by at least 2.5 mag.
One NL CV that presents some similarities to LD 317 is found to be V794 Aql of the VY Scl subtype. They share an almost identical , while the slow decline is also in common. V794 Aql has been reported to show declines by about 1–3 mag in intervals of 50–100 d (Honeycutt et al. 1994). Multiple cycles of slow declines are uncommon among NL CVs but a few cases certainly exist. Unfortunately the coverage of our runs was insufficient for revealing any rising episodes or any data belonging to the system’s normal high state. In this respect, we are not yet able to conclude much about the system’s behaviour as a VY Scl star. The only thing, though, that can be stated for certain is that the system’s fadings are associated with declines of up to 2.5 mag. Moreover, the decline during September–October 2003 is considered slow compared to those of other VY Scl stars and has a duration of at least 58 d according to our data. This does not, however, exclude shorter durations. As was the case with V794 Aql, the fadings could vary both in duration and depth.
Light curves from AAVSO observers before our 2003 data and during Autumn 2004 show that in October 2003 the system was already in a fading episode, but still brighter than when we observed it. It also seems that it started a fading episode in October 2004. At that time, it was still much brighter than when we observed it in January 2005.
4.4 V795 Her
All resulting light curves reveal that the 2.8 h modulation is present and of high amplitude. We confirm the previously reported QPO near 80 c d-1, as well as its resolution into two components.
According to Patterson & Skillman (1994) the signal is definitely phase stable on time scales smaller than 20 d, and an extensive observing campaign was proposed to test the longer term stability. In our campaign, the frequency of the modulation, the amplitude, and the phase did not prove stable. The different values we found agreed with different previously reported values. This enhances the speculation that the similar but different values reported for the modulation so far were expected. This is nevertheless inevitable since this modulation is by now strongly and broadly believed to be a superhump and superhumps are known for such instabilities. Additionally, if it is a superhump then, as also noted by Patterson & Skillman (1994), which is in accordance to the known empirical relation between and as shown in Fig. 17 of Patterson et al. (1993). We therefore favour the disc-precessing model with the being unstable not only in period and amplitude but also in phase for time intervals longer than 20 d.
4.5 MCT 2347-3144
The two runs show a difference in the mean magnitude of the system, which appeared brighter in 2003. In 2002, the most likely period is around 6 h. In 2003, no periodicity could be found. This could, however, be attributed to the increase - by a factor 0.5- in the flickering. Possible QPOs were detected near 25 and 50 c d-1.
Acknowledgements.
We are grateful for the generous allocations of time to Prof. Klaus Reif and Prof. Wilhelm Seggewiss at the Observatorium Hoher List, to Dr. Panayotis Boumis at Kryoneri Observatory, to Prof. John Papamastorakis, Dr. Iosif Papadakis, and Dr. Pablo Reig at Skinakas Observatory. Skinakas Observatory is a collaborative project of the University of Crete, the Foundation for Research and Technology-Hellas, and the Max–Planck–Institut für extraterrestrische Physik. This paper uses observations made at the South African Astronomical Observatory (SAAO) and is partially based on data from the ING Archive. We thank Dr. F.A. Ringwald for kindly providing us with some results of his work. We are also grateful to the referee for his careful, exhaustive, and very useful report. Moreover, this work has been partly supported by “IAP P5/36” Interuniversity Attraction Poles Programme of the Belgian Federal Office for Scientific, Technical, and Cultural Affairs. C.P. gratefully acknowledges a doctoral research grant by the Belgian Federal Science Policy Office (Belspo). J.C. acknowledges financial support from the Fund for Scientific Research - Flanders (Belgium).References
- Ak et al. (2005) Ak, T., Retter, A., & Liu, A. 2005, submitted to New A
- Baidak et al. (1985) Baidak, A. V., Lipunova, N. A., Shugarov, S. Y., Moshkalev, V. G., & Volkov, I. M. 1985, IBVS, No. 2676
- Bak et al. (1988) Bak, P., Tang, C., & Wiesenfeld, K. 1988, Phys. Rev. A, 38, 364
- Bond et al. (1987) Bond, H. E., Grauer, A. D., Burtsein, D., & Marzke, R. O. 1987, PASP, 99, 1097
- Bruch (1992) Bruch, A. 1992, A&A, 266, 237
- Casares et al. (1996) Casares, J., Martinez-Pais, I. G., Marsh, T. R., Charles, P. A., & Lazaro, C. 1996, MNRAS, 278, 219
- Dahlmark (1999) Dahlmark, L. 1999, IBVS, Np. 4734, 1
- Dickinson et al. (1997) Dickinson, R. J., Prinja, Raman, K., Rosen, S. R., et al. 1997, MNRAS, 286, 447
- Fenton et al. (in preparation) Fenton, W. H., Thorstensen, J. R., & Taylor, C. J. in preparation
- Ferguson et al. (1984) Ferguson, D. H., Green, R. F., & Liebert, J. 1984, ApJ, 287, 320
- Filippenko & Ebneter (1986) Filippenko, A. V. & Ebneter, K. 1986, IAU Circ., No. 4190
- Green et al. (1982) Green, R. F., Ferguson, D. H., Liebert, J., & Schmidt, M. 1982, PASP, 94, 560
- Hamuy & Maza (1986) Hamuy, M. & Maza, J. 1986, IBVS, No. 2867
- Henden & Honeycutt (1995) Henden, A. A. & Honeycutt, R. 1995, PASP, 107, 324
- Honeycutt et al. (1994) Honeycutt, R. K., Cannizzo, J. K., & W., R. J. 1994, ApJ, 425, 835
- Honeycutt & Kafka (2004) Honeycutt, R. K. & Kafka, S. 2004, AJ, 128, 1279
- Kafka & Honeycutt (2004) Kafka, S. & Honeycutt, R. K. 2004, AJ, 128, 2420
- Kaluzny (1989) Kaluzny, J. 1989, AcA, 39, 235
- Kato & Uemura (1999) Kato, T. & Uemura, M. 1999, IBVS, No. 4786
- Kraicheva et al. (1999) Kraicheva, Z., Stanishev, V., Genkov, V., & Iliev, L. 1999, å, 351, 607
- Lamontagne et al. (2000) Lamontagne, R., Demers, S., Wesemael, F., & Fontaine, G. 2000, AJ, 119, 241
- Lenz & Breger (2005) Lenz, P. & Breger, M. 2005, Communications in Asteroseismology, 146, 53
- Maza et al. (1986) Maza, J., Hamuy, H., & Ruiz, M. T. 1986, IAU Circ., No. 4172
- Mineshige et al. (1994) Mineshige, S., Ouchi, N. B., & Nishimori, H. 1994, PASJ, 46, 97
- Mironov et al. (1983) Mironov, A. V., Moshkalev, V. G., & Sugarov, S. Y. 1983, IBVS, No. 2438
- Misselt & Shafter (1995) Misselt, K. A. & Shafter, A. W. 1995, AJ, 109, 1757
- Papadaki et al. (2004) Papadaki, C., Boffin, H. M. J., Cuypers, J., et al. 2004, in Spectroscopically and Spatially Resolving the Components of Close Binary Stars, ed. R. W. Hilditch, H. Hensberge, & K. Pavlovski, Vol. 318 (ASP Conference Series)
- Patterson et al. (2002) Patterson, J., Fenton, W. H., Thorstensen, J. R., et al. 2002, PASP, 114, 1364
- Patterson et al. (2005) Patterson, J., Kemp, J., Harvey, D. A., et al. 2005, PASP, 117, 1204
- Patterson & Skillman (1994) Patterson, J. & Skillman, D. R. 1994, PASP, 106, 1141
- Patterson et al. (1993) Patterson, J., Thomas, G., Skillman, D. R., & Diaz, M. 1993, ApJS, 86, 235
- Prinja et al. (1992) Prinja, R. K., Drew, J. E., & Rosen, S. R. 1992, MNRAS, 256, 219
- Prinja & Rosen (1993) Prinja, R. K. & Rosen, S. R. 1993, MNRAS, 262, L37
- Ringwald (1993) Ringwald, F. A. 1993, PhD thesis, Dartmouth College
- Ringwald et al. (1994) Ringwald, F. A., Thorstensen, J. R., & Hamwey, R. M. 1994, MNRAS, 271, 323
- Rosen et al. (1989) Rosen, S. R., Branduardi-Raymont, G., & Mason, K. O. 1989, MNRAS, 237, 1037
- Rosen et al. (1998) Rosen, S. R., Prinja, R. K., Drew, J. E., Mason, K. O., & Howell, S. B. 1998, MNRAS, 299, 305
- Rosen et al. (1995) Rosen, S. R., Watson, T. K., Robinson, E. L., et al. 1995, A&A, 300, 392
- Schmidke et al. (2002) Schmidke, P. C., Ciudin, G. A., Idlekofer, U. R., et al. 2002, in Physics of Cataclysmic Variables and Related Objects, ed. B. Gansicke, K. Beuermann, & R. K., Vol. 261 (ASP Conference Series)
- Shafter et al. (1990) Shafter, A. W., Robinson, E. L., Crampton, D., Warner, B., & Prestage, R. M. 1990, ApJ, 354, 708
- Shafter et al. (1987) Shafter, A. W.and Robinson, E. L., Crampton, D., & Warner, B. 1987, BAAS, 19, 1058
- Sokolov et al. (1996) Sokolov, D. A., Shugarov, S. Y., & Pavlenko, E. P. 1996, in Cataclysmic Variables and Related Objects, ed. A. Evans & J. H. Wood (Kluwer Academic Publisher), p.219
- Steeghs et al. (1996) Steeghs, D., Horne, K., Marsh, T. R., & Donati, J. F. 1996, MNRAS, 281, 626
- Takeuchi et al. (1995) Takeuchi, M., Mineshige, S., & Negoro, H. 1995, PASJ, 47, 617
- Thorstensen (1986) Thorstensen, J. R. 1986, AJ, 91, 940
- Warner (1995) Warner, B. 1995, Cataclysmic Variable Stars (Cambridge University Press)
- Warner & Nather (1988) Warner, B. & Nather, R. E. 1988, IBVS, No. 3140
- Watanabe (1999) Watanabe, T. 1999, VSOLJ Variable Star Bulletin, 34, 3
- Zhang et al. (1991) Zhang, E., Robinson, E. L., Ramseyer, T. F., Shetrone, M. D., & Stiening, R. F. 1991, ApJ, 381, 534
Appendix A
| CV | UT date | Site | Dur. | Band | CV | UT date | Site | Dur. | Band | ||
|---|---|---|---|---|---|---|---|---|---|---|---|
| V1193 Ori | 22oct02 | SAAO | 2570.542 | 1.8 | - | V795 Her | 19jul03 | SK | 2840.291 | 3.0 | |
| 23oct02 | SAAO | 2571.504 | 2.7 | - | —cont.— | 19jul03 | SK | 2840.419 | 2.8 | ||
| 24oct02 | SAAO | 2572.420 | 4.6 | - | 20jul03 | SK | 2841.274 | 3.0 | |||
| 25oct02 | SAAO | 2573.436 | 4.2 | - | 21jul03 | SK | 2842.269 | 3.0 | |||
| 26oct02 | SAAO | 2574.448 | 3.9 | - | 21jul03 | SK | 2842.393 | 3.0 | |||
| 04nov03 | OHL | 2948.499 | 4.2 | - | 22jul03 | SK | 2843.265 | 3.0 | |||
| 05nov03 | OHL | 2949.472 | 4.9 | - | 22jul03 | SK | 2843.393 | 3.0 | |||
| 06nov03 | OHL | 2950.474 | 4.9 | - | 23jul03 | SK | 2844.268 | 1.5 | |||
| 08nov03 | OHL | 2952.465 | 4.9 | - | 23jul03 | SK | 2844.405 | 1.5 | |||
| 17jan04 | OHL | 3022.333 | 2.9 | - | 11sep03 | OHL | 2894.316 | 2.8 | - | ||
| 18jan04 | OHL | 3023.293 | 1.0 | - | 13sep03 | OHL | 2896.291 | 2.5 | - | ||
| 10oct04 | OHL | 3289.607 | 2.2 | - | 14may04 | OHL | 3140.381 | 1.4 | - | ||
| 12oct04 | OHL | 3291.574 | 2.0 | - | 15may04 | OHL | 3141.365 | 1.8 | - | ||
| 10jan05 | OHL | 3381.348 | 1.8 | - | 16may04 | OHL | 3142.362 | 1.8 | - | ||
| 14jan05 | OHL | 3385.382 | 2.8 | - | 19may04 | KR | 3145.306 | 7.0 | - | ||
| LQ Peg | 01jun04 | SK | 3158.469 | 2.8 | 20may04 | KR | 3146.303 | 7.0 | - | ||
| 02jun04 | SK | 3159.465 | 3.2 | 21may04 | KR | 3147.312 | 6.4 | - | |||
| 03jun04 | SK | 3160.466 | 3.2 | 05jun04 | SK | 3162.349 | 2.3 | ||||
| 05jun04 | SK | 3162.454 | 3.1 | 14jan05 | OHL | 3385.673 | 2.1 | - | |||
| 06jun04 | SK | 3163.455 | 3.6 | 03may05 | KR | 3494.369 | 2.9 | - | |||
| 19aug04 | KR | 3237.363 | 5.0 | - | 04may05 | KR | 3495.350 | 2.3 | - | ||
| 20aug04 | KR | 3238.287 | 7.7 | - | 05may05 | KR | 3496.345 | 5.9 | - | ||
| 21aug04 | KR | 3239.345 | 6.5 | - | 07may05 | KR | 3498.336 | 2.5 | - | ||
| 22aug04 | KR | 3240.454 | 3.5 | - | 08may05 | KR | 3499.337 | 2.7 | - | ||
| 30aug04 | SK | 3248.397 | 6.8 | 09may05 | KR | 3500.323 | 3.1 | - | |||
| LD 317 | 11sep03 | OHL | 2894.468 | 0.5 | - | 11may05 | KR | 3502.353 | 2.0 | - | |
| 13sep03 | OHL | 2896.419 | 3.8 | - | 13may05 | KR | 3504.333 | 2.9 | - | ||
| 14sep03 | OHL | 2897.291 | 6.0 | - | 14may05 | KR | 3505.441 | 1.3 | - | ||
| 04nov03 | OHL | 2948.248 | 5.4 | - | MCT | 24oct02 | SAAO | 2572.290 | 3.0 | - | |
| 05nov03 | OHL | 2949.232 | 5.0 | - | 2347-3144 | 25oct02 | SAAO | 2573.305 | 3.0 | - | |
| 06nov03 | OHL | 2950.222 | 6.0 | - | 26oct02 | SAAO | 2574.277 | 3.6 | - | ||
| 08nov03 | OHL | 2952.345 | 2.8 | - | 27oct02 | SAAO | 2575.272 | 4.2 | - | ||
| 12jan05 | OHL | 3383.240 | 3.0 | - | 13aug03 | SAAO | 2865.398 | 4.5 | - | ||
| V795 Her | 02jun03 | KR | 2793.477 | 2.5 | - | 16aug03 | SAAO | 2868.343 | 8.5 | - | |
| 03jun03 | KR | 2794.342 | 6.0 | - | 17aug03 | SAAO | 2869.379 | 7.0 | - |
Notes: ; Dur. is the duration of each run in hours.